Download in PDF and JPG format
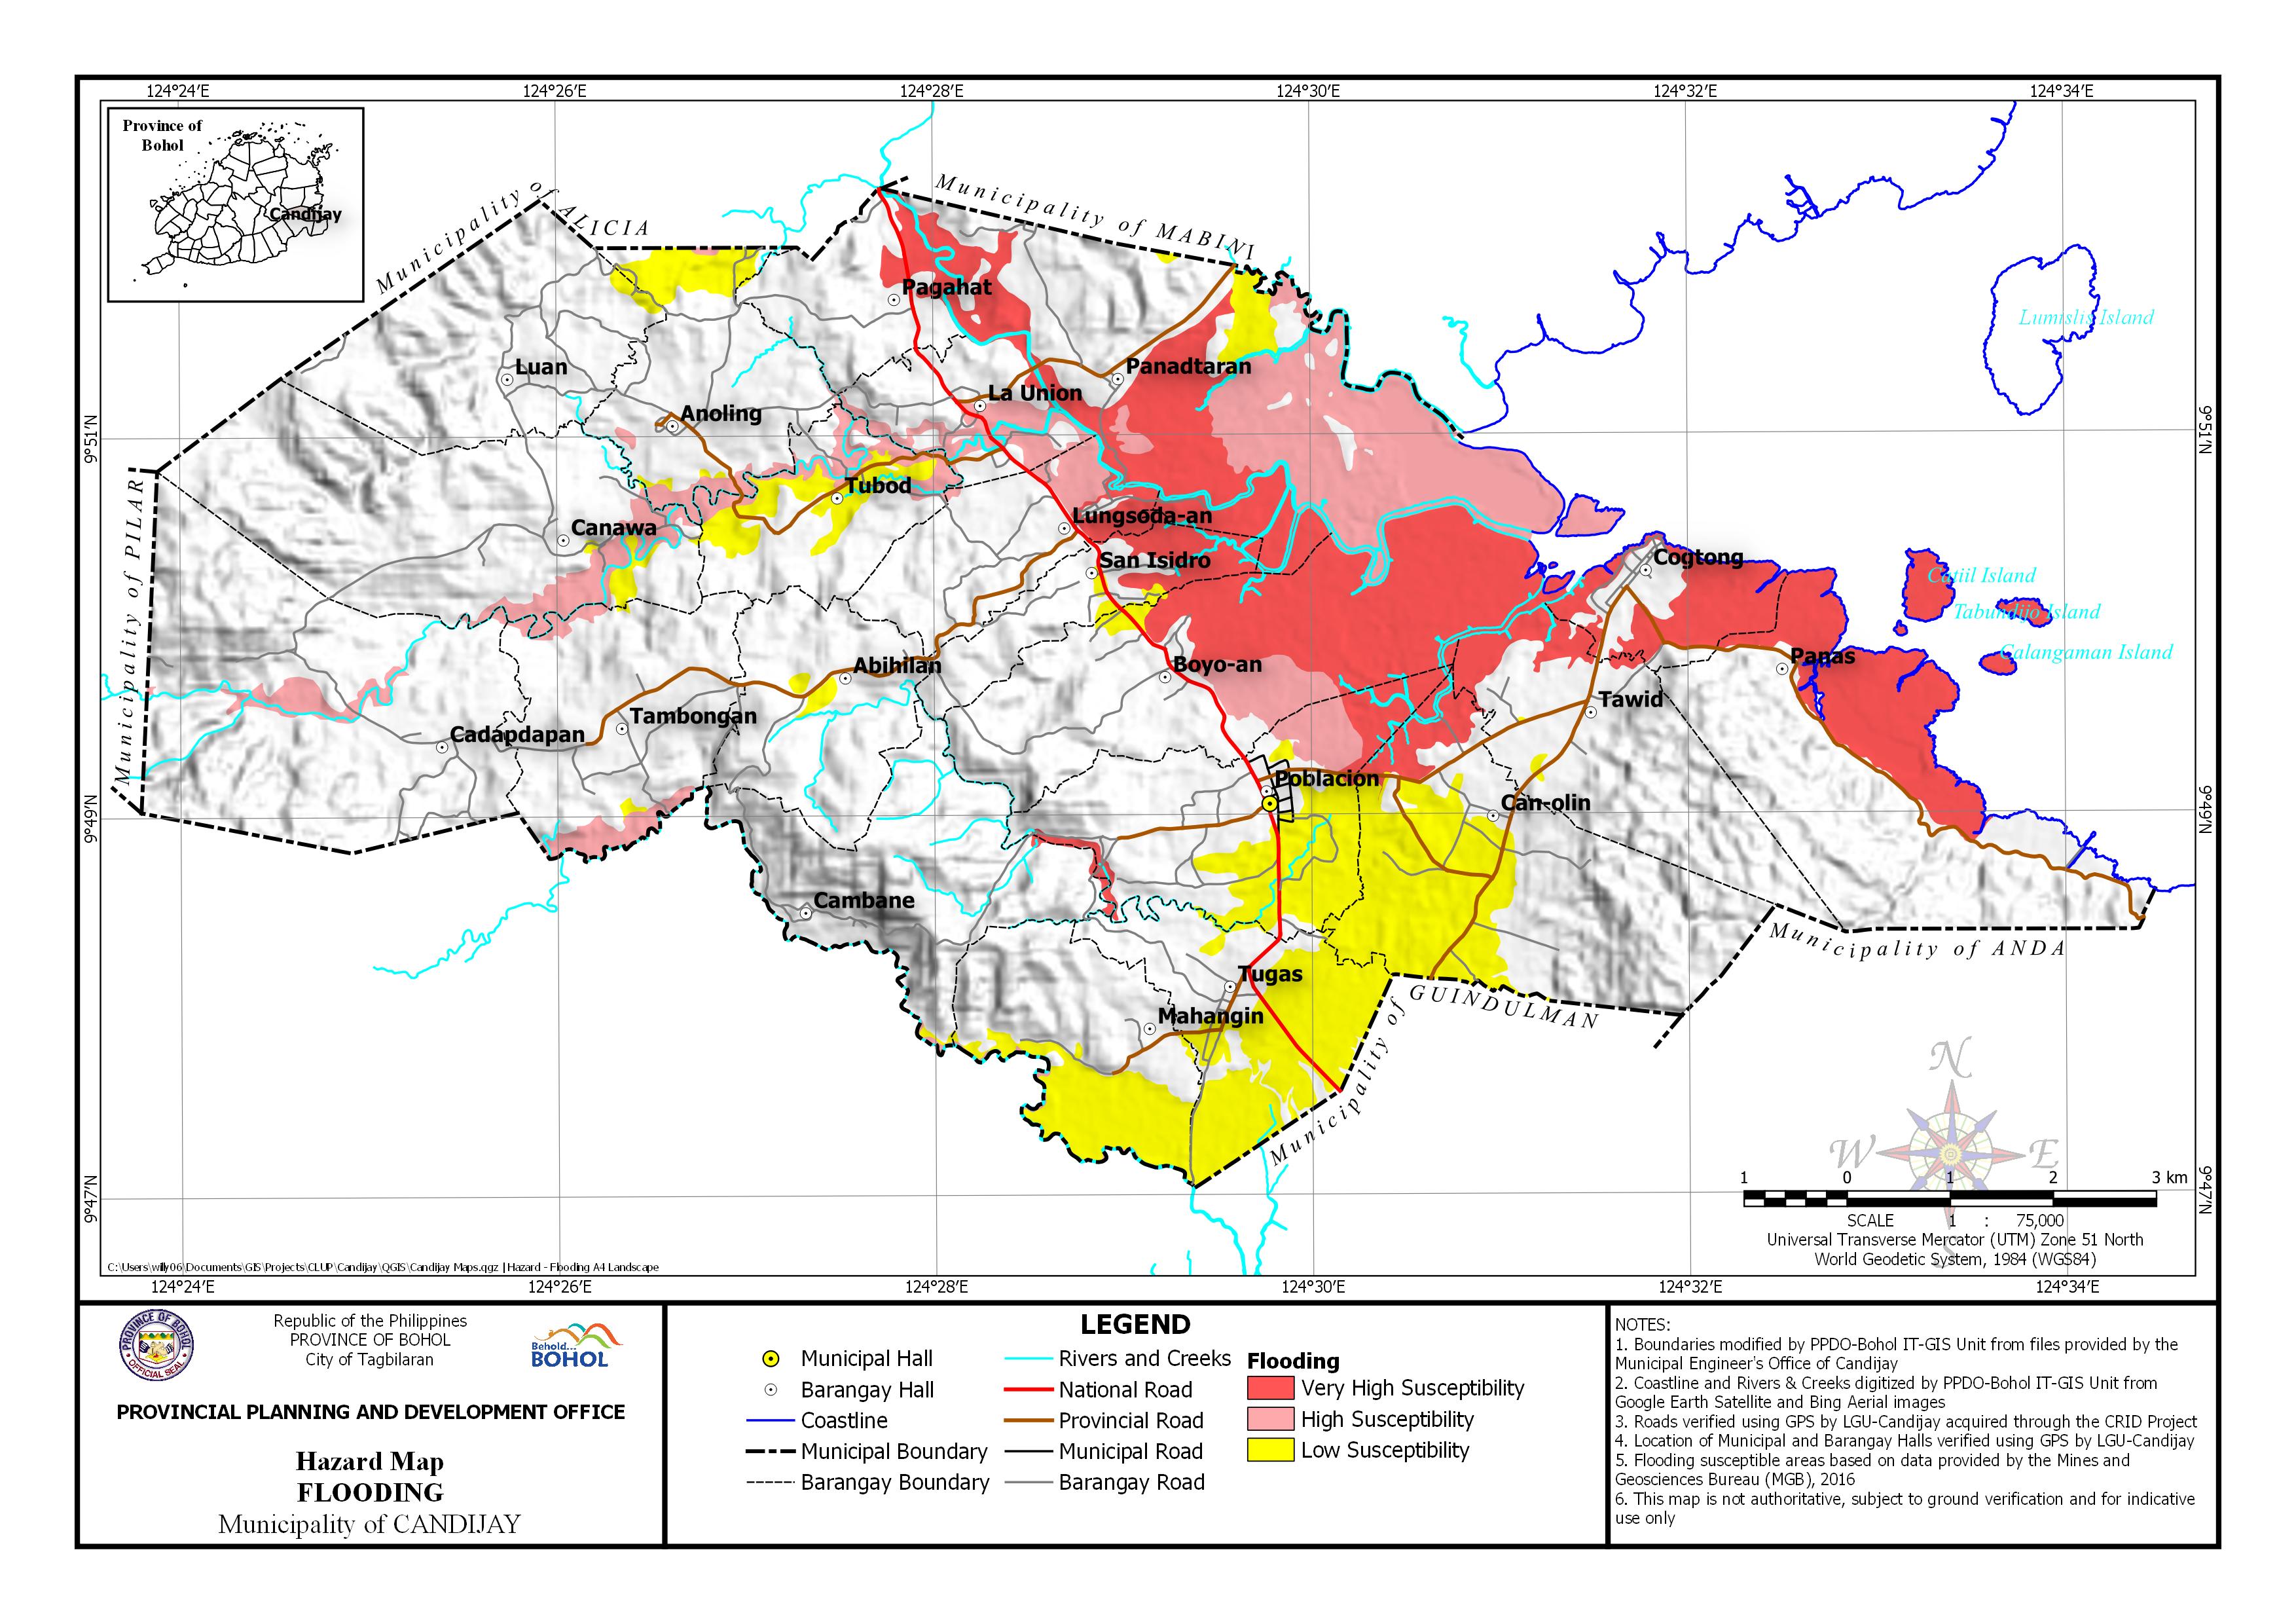
AREA EXPOSED TO FLOODING HAZARD BY BARANGAY
| Barangay | Area | Area Exposed to Very High Susceptibility | Area Exposed to High Susceptibility | Area Exposed to Low Susceptibility | |||
| (Hectares) | (Hectares) | (Percentage) | (Hectares) | (Percentage) | (Hectares) | (Percentage) | |
| Abihilan | 349.259 | 8.553 | 2.45% | ||||
| Anoling | 386.931 | 26.023 | 6.73% | 51.619 | 13.34% | ||
| Boyo-an | 772.874 | 381.346 | 49.34% | 59.3 | 7.67% | 10.16 | 1.32% |
| Cadapdapan | 888.484 | 36.918 | 4.16% | ||||
| Cambane | 491.001 | 3.669 | 0.75% | 1.885 | 0.38% | 1.655 | 0.34% |
| Can-olin | 722.689 | 48.764 | 6.75% | 258.189 | 35.73% | ||
| Canawa | 763.727 | 65.862 | 8.62% | 13.731 | 1.80% | ||
| Cogtong | 185.749 | 114.621 | 61.71% | 0.298 | 0.16% | ||
| La Union | 207.807 | 8.648 | 4.16% | 57.62 | 27.73% | ||
| Luan | 496.681 | 7.367 | 1.48% | ||||
| Lungsoda-an | 284.118 | 27.554 | 9.70% | 28.863 | 10.16% | ||
| Mahangin | 375.233 | 8.168 | 2.18% | 122.074 | 32.53% | ||
| Pagahat | 232.154 | 29.407 | 12.67% | 0.136 | 0.06% | 0.392 | 0.17% |
| Panadtaran | 1,003.93 | 288.602 | 28.75% | 375.325 | 37.39% | 33.536 | 3.34% |
| Panas | 768.855 | 215.776 | 28.07% | ||||
| Poblacion | 522.393 | 52.642 | 10.08% | 38.435 | 7.36% | 141.967 | 27.18% |
| San Isidro | 202.583 | 57.802 | 28.53% | 8.264 | 4.08% | ||
| Tambongan | 454.057 | 43.683 | 9.62% | 2.566 | 0.57% | ||
| Tawid | 465.637 | 52.274 | 11.23% | 2.516 | 0.54% | ||
| Tubod | 291.064 | 54.938 | 18.88% | 69.432 | 23.86% | ||
| Tugas | 399.458 | 0.055 | 0.01% | 228.344 | 57.16% | ||
| Sub-Total | 10,264.69 | 1,281.11 | 12.48% | 797.51 | 7.77% | 960.366 | 9.36% |
| Calangaman Island | 5.447 | 4.953 | 90.93% | ||||
| Catiil Island | 26.478 | 25.488 | 96.26% | ||||
| Tabundijo Island | 8.506 | 7.684 | 90.34% | ||||
| Inland Water | 74.017 | 40.721 | 55.02% | 29.205 | 39.46% | 1.527 | 2.06% |
| Sub-Total | 114.447 | 78.845 | 68.89% | 29.205 | 25.52% | 1.527 | 1.33% |
| Total | 10,453.15 | 1,359.95 | 13.01% | 826.715 | 7.91% | 961.892 | 9.20% |

