
Download in PDF and JPG format
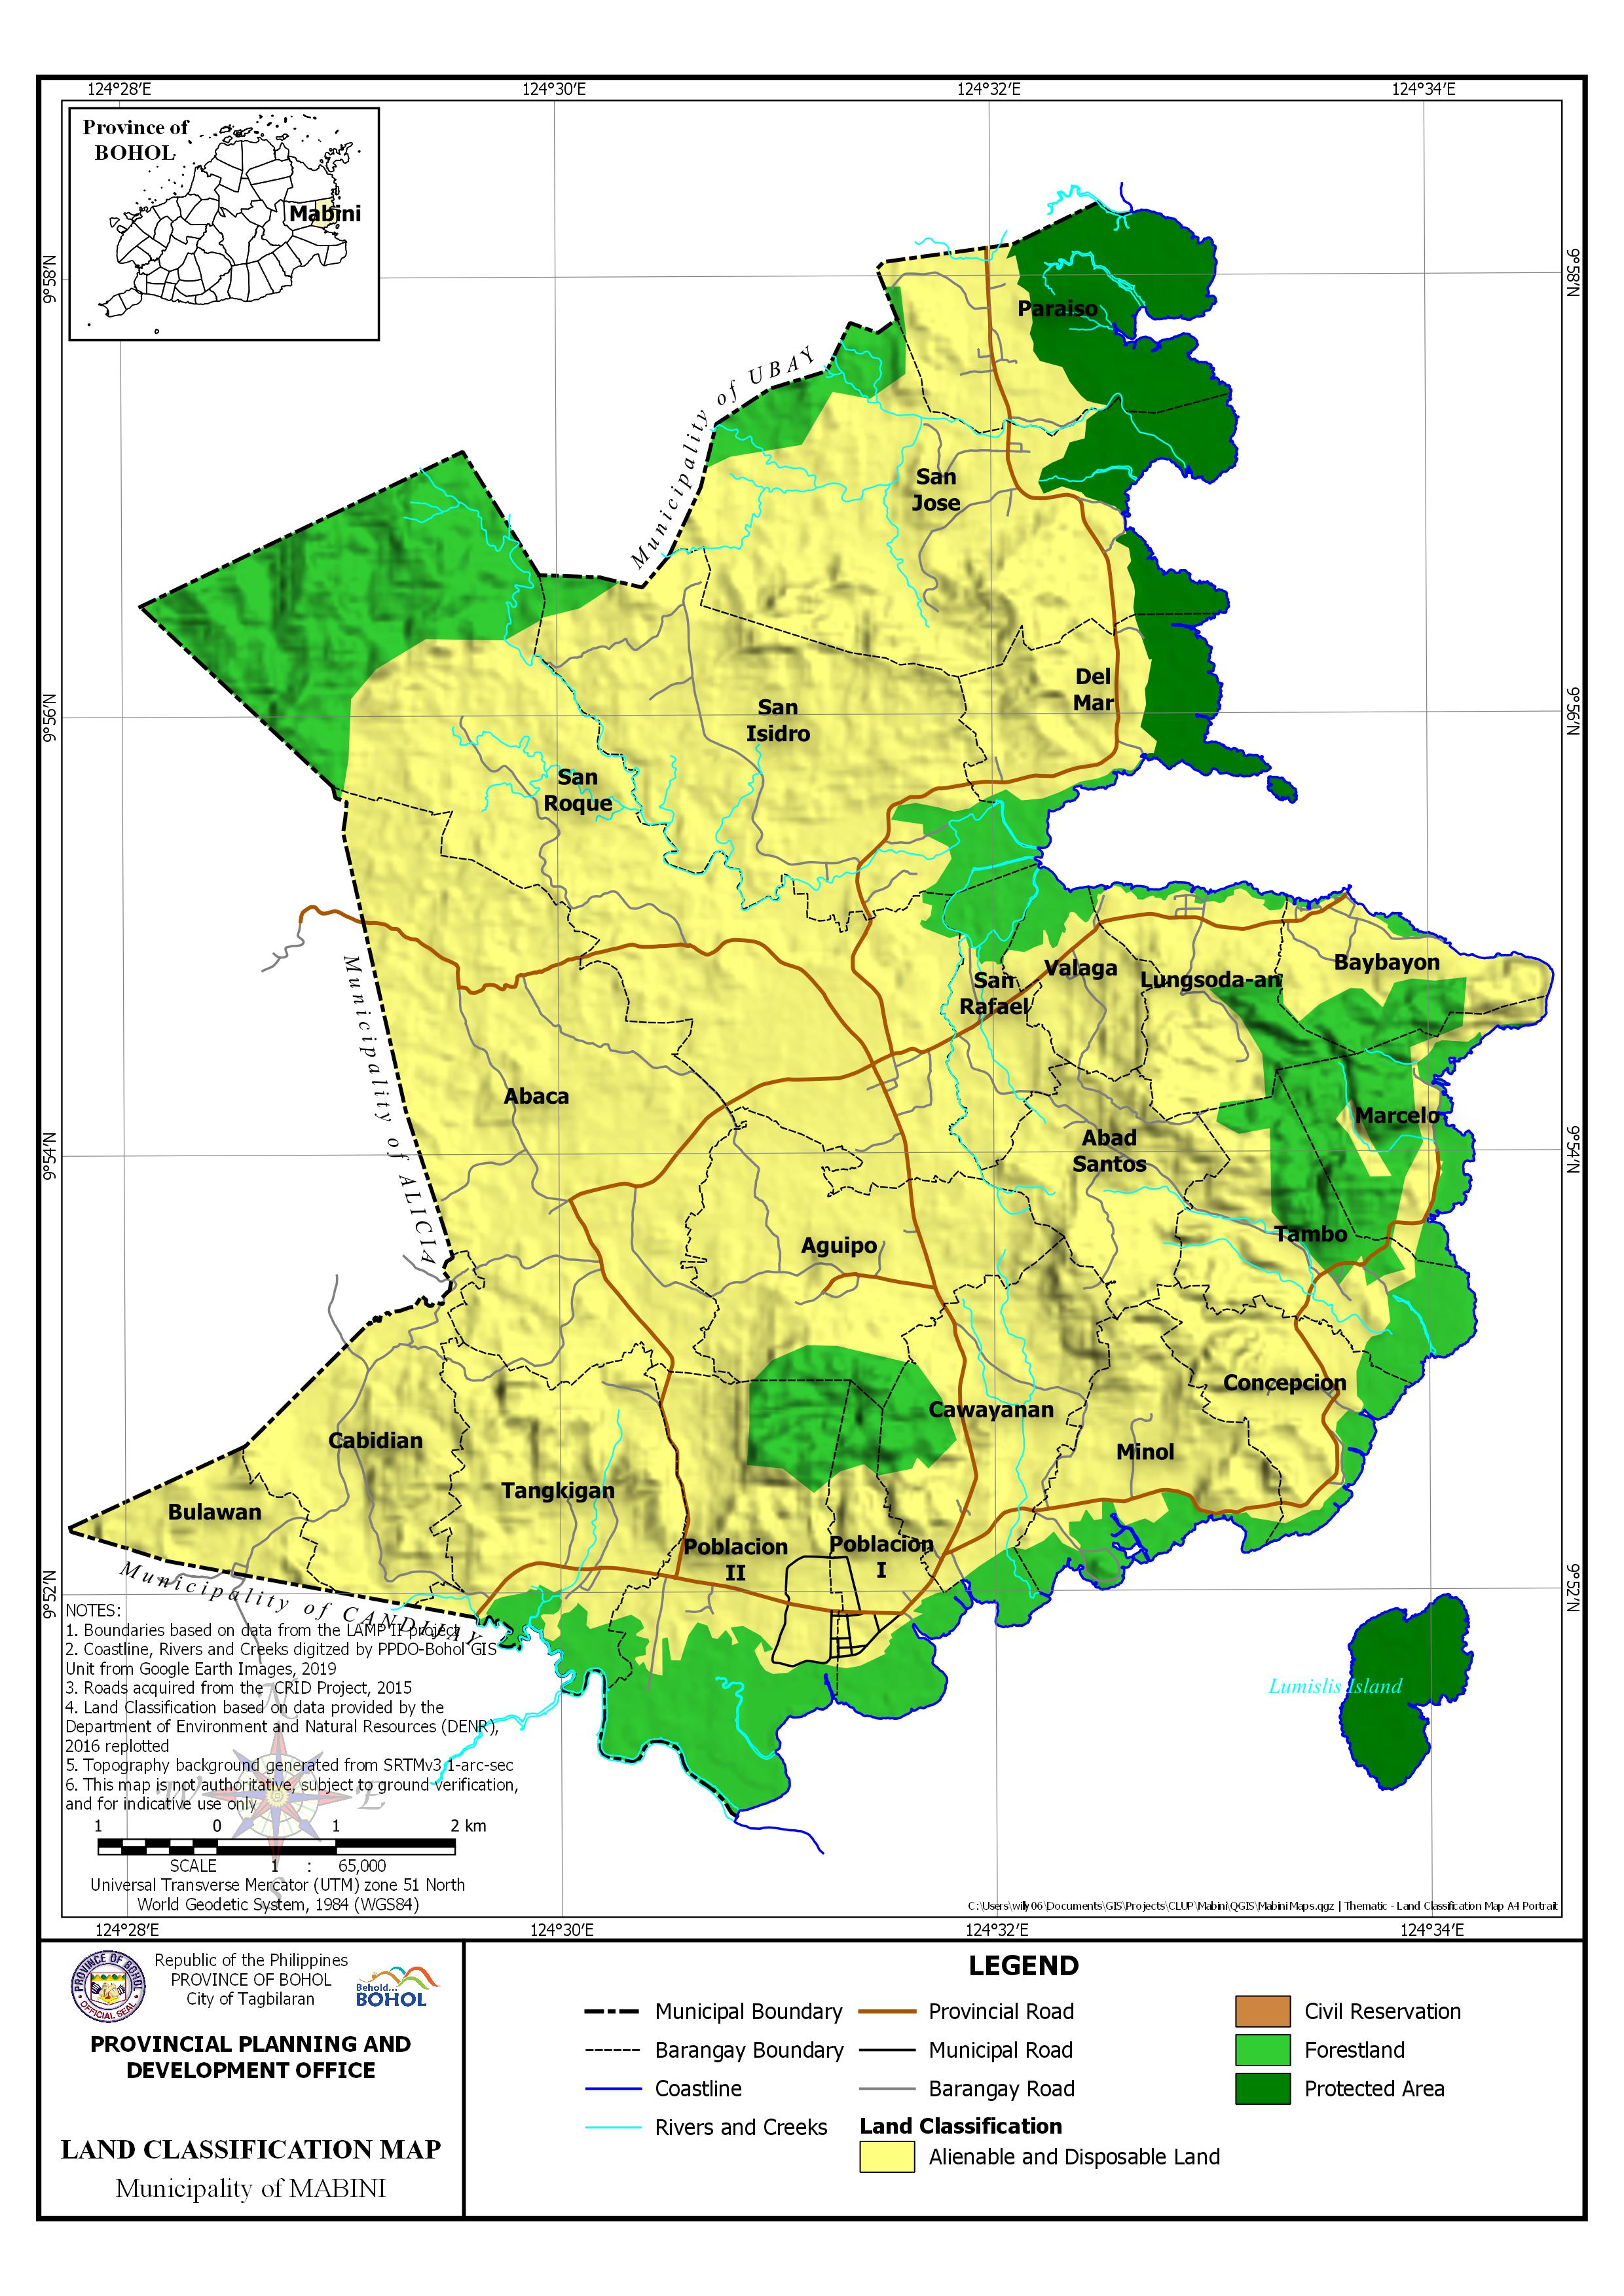
AREA PER LAND CLASSIFICATION BY BARANGAY
| Barangay | Area | Alienable and Disposable Land | Civil Reservation | Forestland | Protected Area | ||||
| Hectares | Hectares | Percentage | Hectares | Percentage | Hectares | Percentage | Hectares | Percentage | |
| Abaca | 944.471 | 943.914 | 99.94% | 0.557 | 0.06% | ||||
| Abad Santos | 232.914 | 232.914 | 100.00% | ||||||
| Aguipo | 442.045 | 408.841 | 92.49% | 33.203 | 7.51% | ||||
| Baybayon | 185.445 | 123.19 | 66.43% | 62.255 | 33.57% | ||||
| Bulawan | 126.765 | 126.765 | 100.00% | ||||||
| Cabidian | 313.637 | 313.637 | 100.00% | ||||||
| Cawayanan | 377.966 | 310.32 | 82.10% | 67.646 | 17.90% | ||||
| Concepcion | 219.29 | 182.68 | 83.31% | 36.611 | 16.70% | ||||
| Del Mar | 286.973 | 184.228 | 64.20% | 21.334 | 7.43% | 81.412 | 28.37% | ||
| Lungsoda-an | 241.967 | 184.48 | 76.24% | 57.486 | 23.76% | ||||
| Marcelo | 218.321 | 56.475 | 25.87% | 161.846 | 74.13% | ||||
| Minol | 284.162 | 219.821 | 77.36% | 64.342 | 22.64% | ||||
| Paraiso | 388.851 | 166.222 | 42.75% | 3.57 | 0.92% | 219.059 | 56.34% | ||
| Poblacion I | 181.389 | 99.434 | 54.82% | 81.955 | 45.18% | ||||
| Poblacion II | 519.893 | 277.128 | 53.31% | 242.765 | 46.70% | ||||
| San Isidro | 733.392 | 669.178 | 91.24% | 64.214 | 8.76% | ||||
| San Jose | 834.795 | 637.68 | 76.39% | 76.484 | 9.16% | 120.63 | 14.45% | ||
| San Rafael | 149.486 | 112.113 | 75.00% | 37.373 | 25.00% | ||||
| San Roque | 1,376.05 | 943.519 | 68.57% | 0.261 | 0.02% | 432.265 | 31.41% | ||
| Tambo | 303.148 | 158.208 | 52.19% | 144.94 | 47.81% | ||||
| Tangkigan | 423.821 | 374.876 | 88.45% | 48.945 | 11.55% | ||||
| Valaga | 135.718 | 110.828 | 81.66% | 24.89 | 18.34% | ||||
| Sub-Total | 8,920.49 | 6,836.45 | 76.64% | 0.261 | 0.00% | 1,662.68 | 18.64% | 421.101 | 4.72% |
| Lumislis Island | 114.701 | 114.701 | 100.00% | ||||||
| TOTAL | 9,035.19 | 6,836.45 | 75.67% | 0.261 | 0.00% | 1,662.68 | 18.40% | 535.803 | 5.93% |