
Download in PDF and JPG format
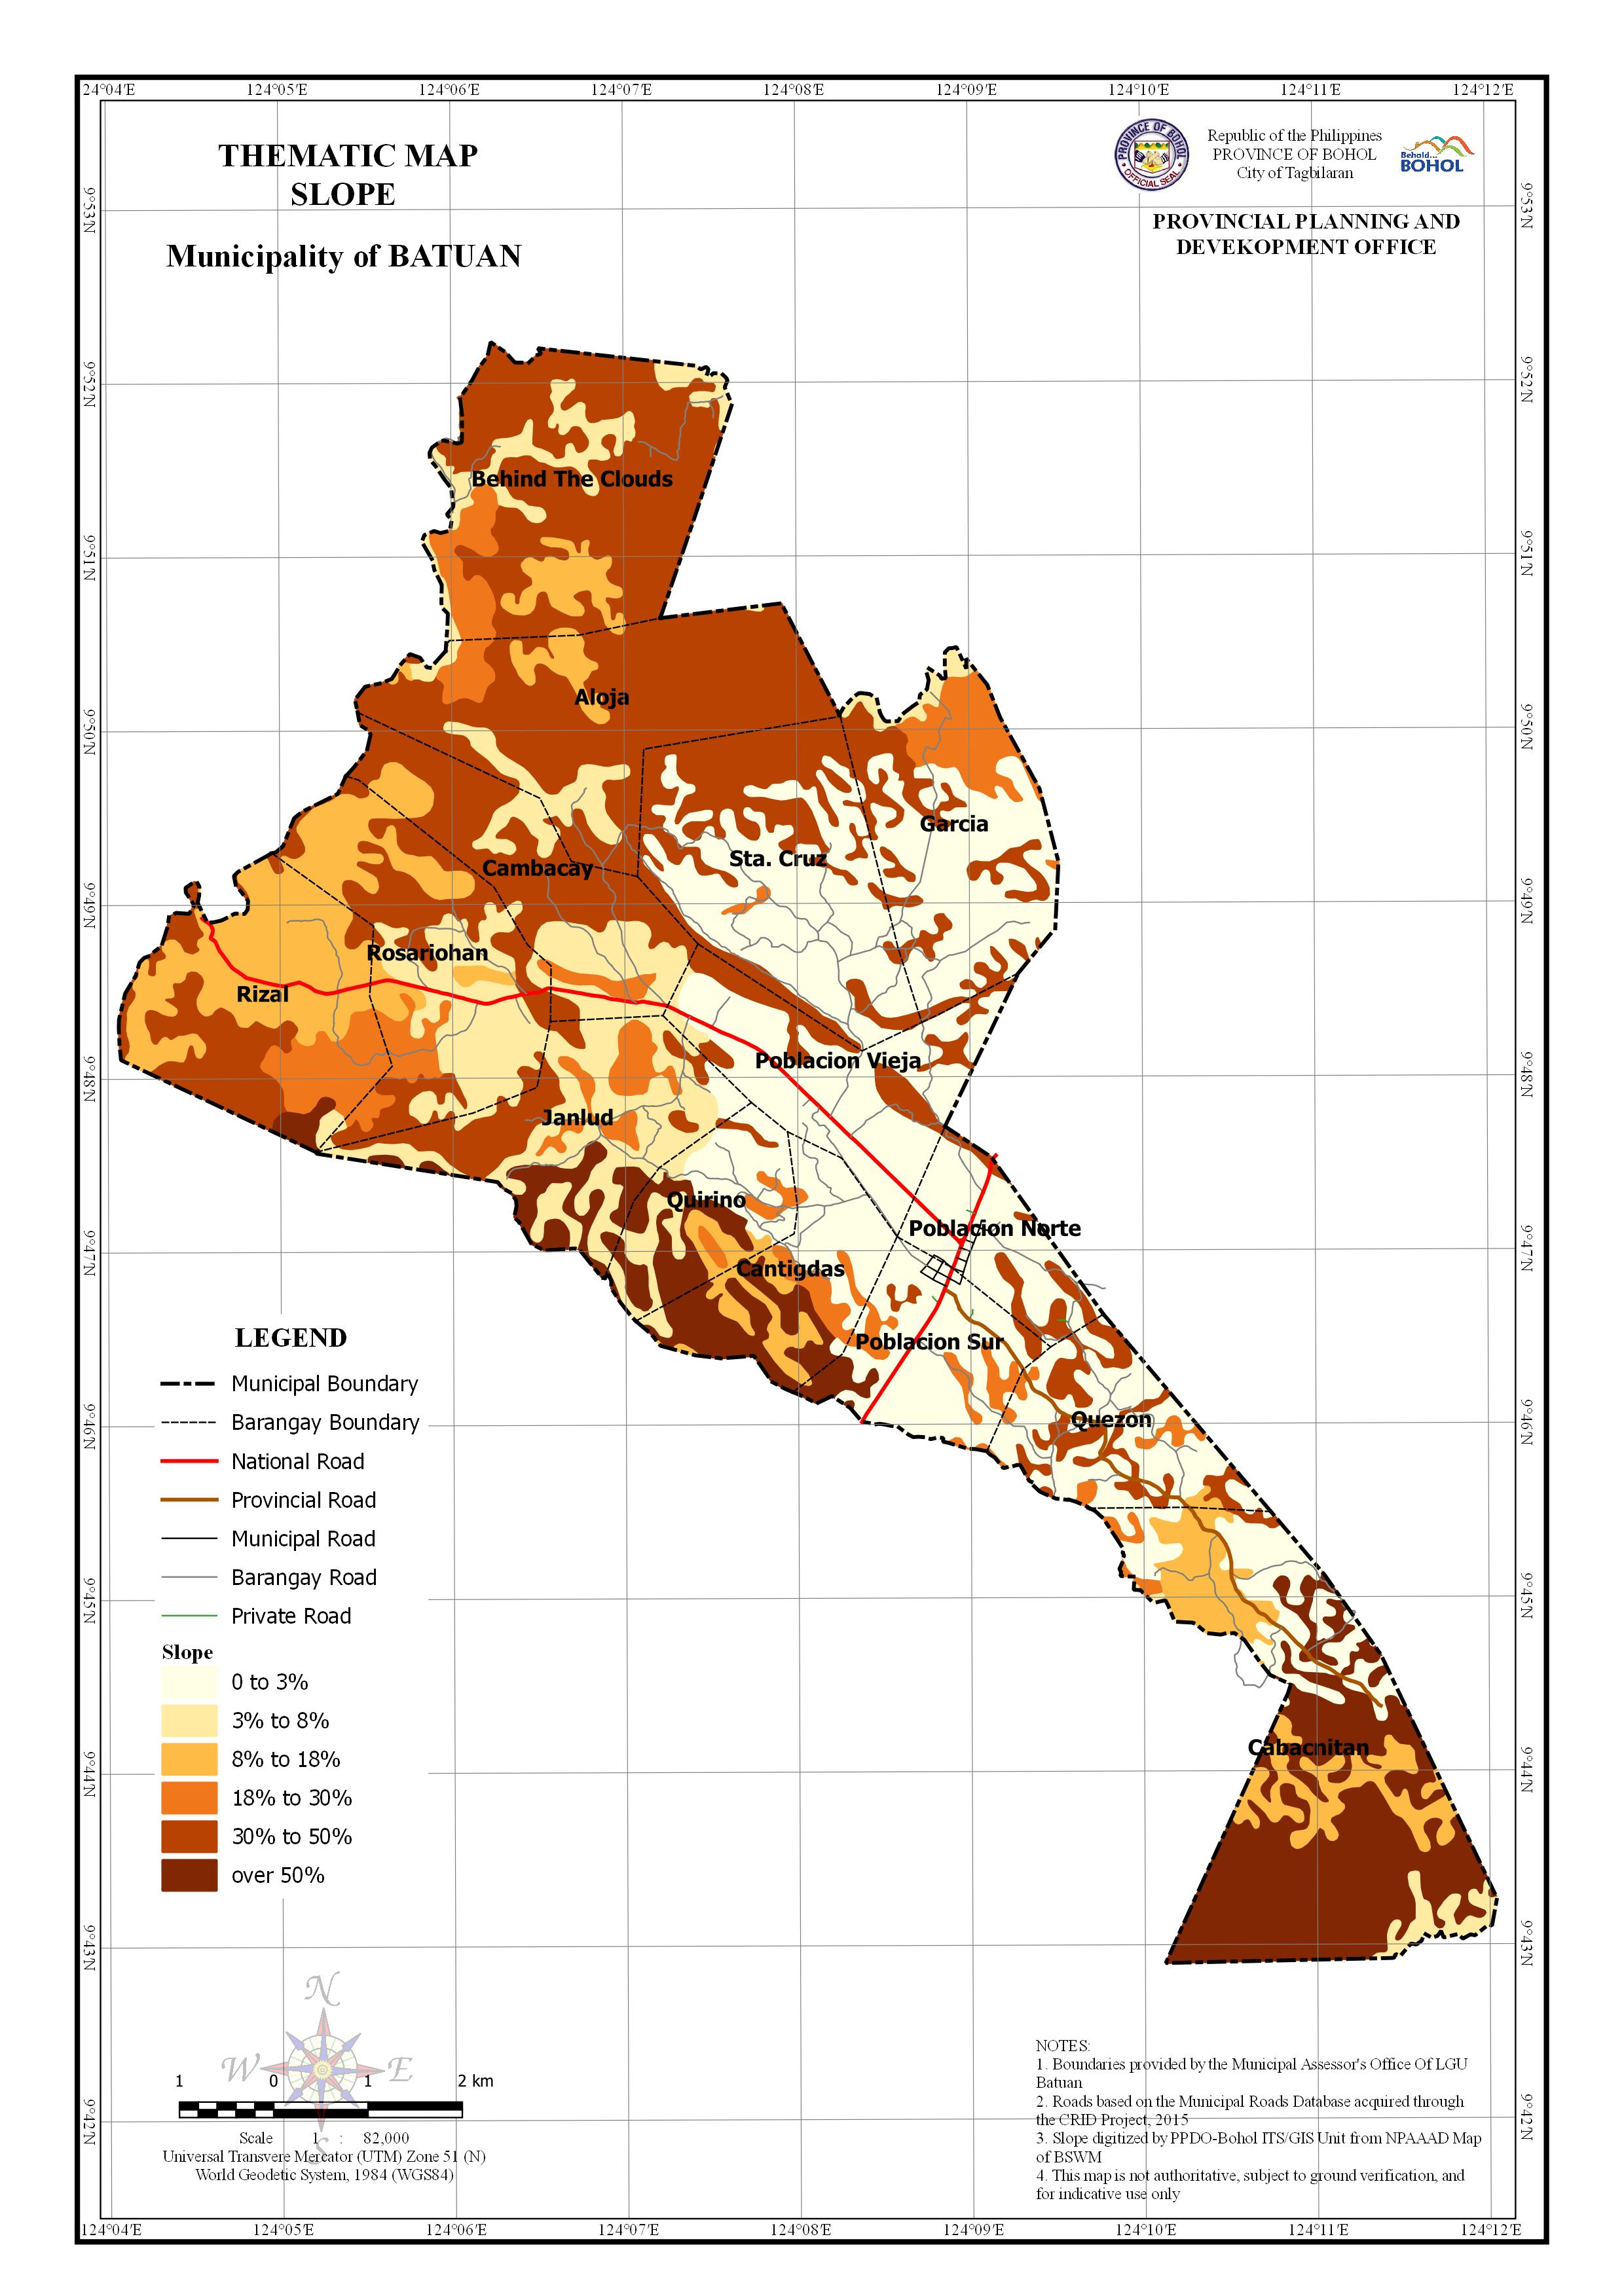
AREA PER SLOPE BY BARANGAY
| Barangay | Area | 0 TO 3% Slope | 3 to 8% Slope | 8 to 18% Slope | 18 to 30% Slope | 30 to 50% Slope | Over 50% Slope | ||||||
| (Hectares) | (Hectares) | Percentage | (Hectares) | Percentage | (Hectares) | Percentage | (Hectares) | Percentage | (Hectares) | Percentage | (Hectares) | Percentage | |
| Aloja | 703.38 | 61.529 | 8.748% | 36.621 | 5.207% | 27.235 | 3.872% | 577.994 | 82.174% | ||||
| Behind The Clouds | 777.08 | 100.046 | 12.875% | 55.165 | 7.099% | 65.438 | 8.421% | 556.431 | 71.605% | ||||
| Cabacnitan | 1009.193 | 152.515 | 15.113% | 35.893 | 3.557% | 203.195 | 20.134% | 14.46 | 1.433% | 6.496 | 0.644% | 596.643 | 59.121% |
| Cambacay | 434.135 | 131.129 | 30.205% | 23.848 | 5.493% | 21.468 | 4.945% | 257.689 | 59.357% | ||||
| Cantigdas | 326.134 | 122.182 | 37.464% | 5.291 | 1.622% | 42.169 | 12.930% | 37.764 | 11.579% | 118.729 | 36.405% | ||
| Garcia | 565.007 | 296.389 | 52.458% | 22.028 | 3.899% | 103.961 | 18.400% | 142.627 | 25.243% | ||||
| Janlud | 506.905 | 13.135 | 2.591% | 219.9 | 43.381% | 69.84 | 13.778% | 114.709 | 22.629% | 89.32 | 17.621% | ||
| Poblacion Norte | 224.341 | 177.027 | 78.910% | 47.315 | 21.091% | ||||||||
| Poblacion Sur | 317.725 | 234.596 | 73.836% | 0.256 | 0.081% | 45.358 | 14.276% | 13.13 | 4.132% | 24.387 | 7.676% | ||
| Poblacion Vieja | 447.363 | 333.114 | 74.462% | 11.947 | 2.670% | 102.3 | 22.867% | ||||||
| Quezon | 344.134 | 207.085 | 60.176% | 5.186 | 1.507% | 27.519 | 7.996% | 104.349 | 30.322% | ||||
| Quirino | 269.747 | 88.356 | 32.755% | 42.508 | 15.758% | 19.967 | 7.402% | 22.516 | 8.347% | 6.727 | 2.494% | 89.672 | 33.243% |
| Rizal | 583.21 | 5.733 | 0.983% | 296.013 | 50.756% | 89.166 | 15.289% | 172.666 | 29.606% | 19.63 | 3.366% | ||
| Rosariohan | 588.702 | 195.431 | 33.197% | 132.535 | 22.513% | 52.702 | 8.952% | 207.947 | 35.323% | 0.088 | 0.015% | ||
| Sta. Cruz | 676.062 | 374.325 | 55.368% | 6.736 | 0.996% | 295.002 | 43.635% | ||||||
| Total | 7773.119 | 1998.725 | 25.713% | 831.435 | 10.696% | 814.954 | 10.484% | 584.163 | 7.515% | 2605.383 | 33.518% | 938.468 | 12.073% |