
Download in PDF and JPG format
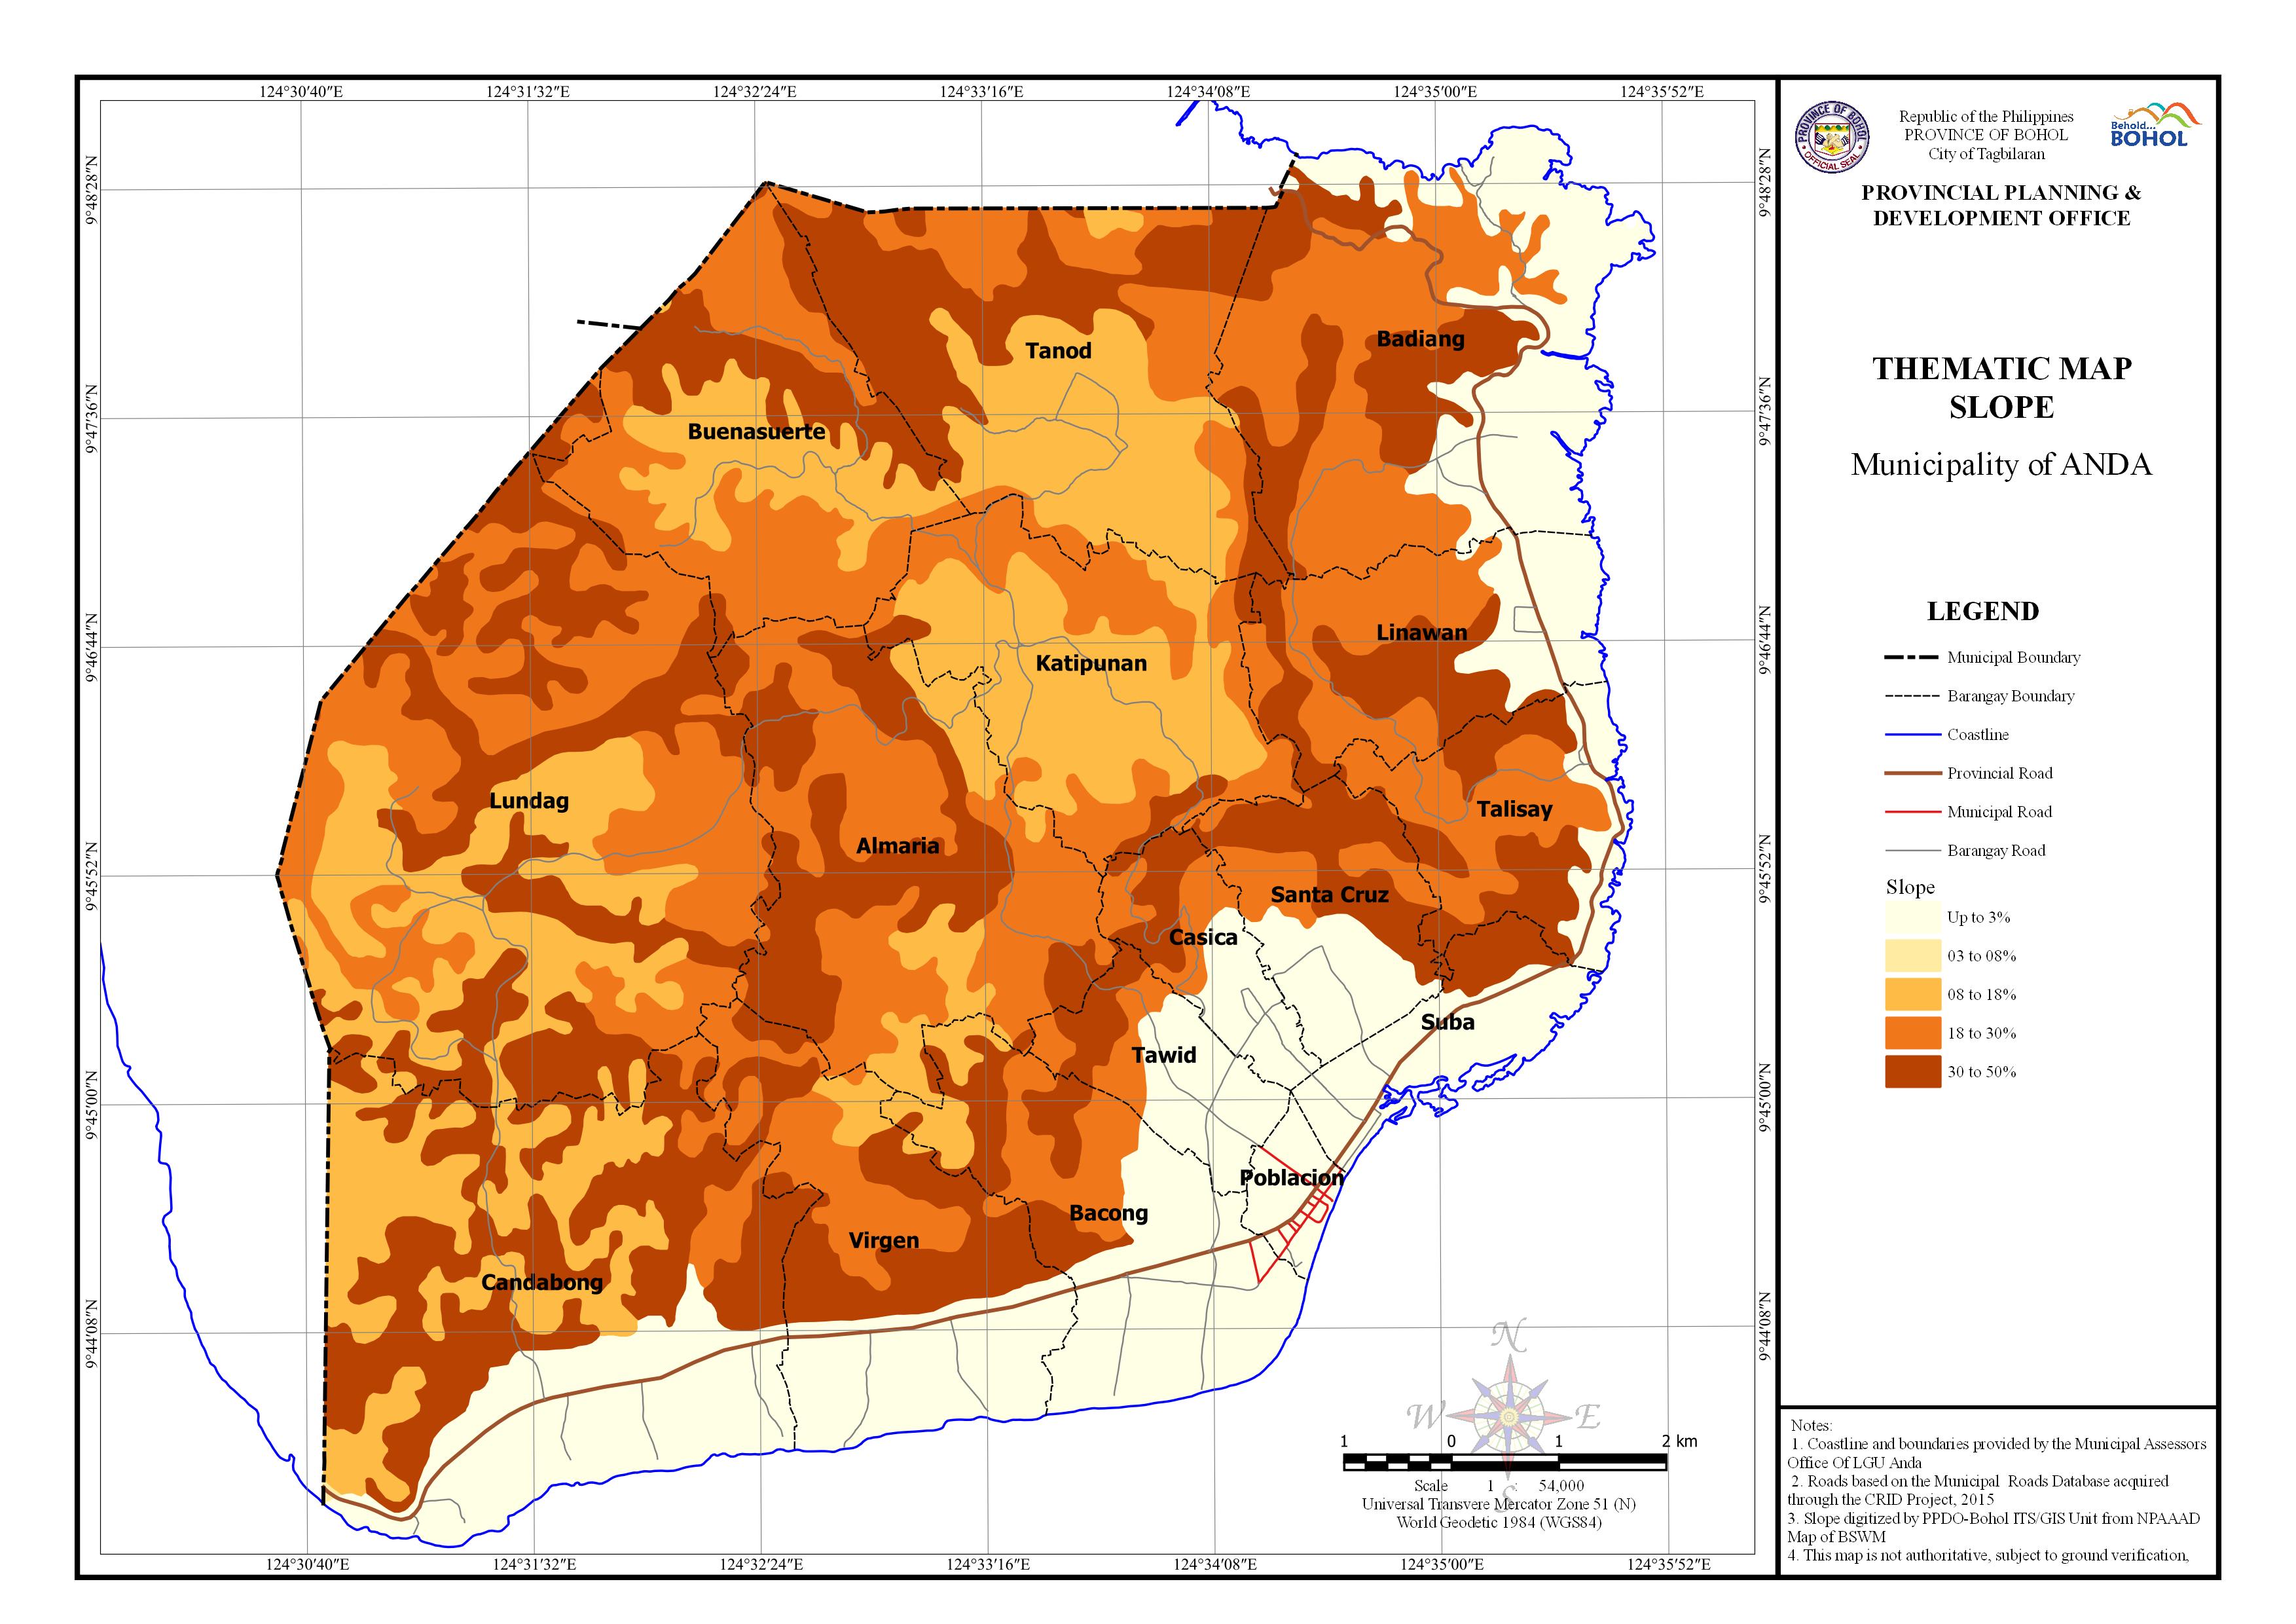
AREA PER SLOPE BY BARANGAY
| Barangay | Area | 0 to 3% Slope | 3 to 8% Slope | 8 to 18% Slope | 18 to 30% Slope | 30 to 50% Slope | No Data | ||||||
| (Hectares) | (Hectares) | Percentage | (Hectares) | Percentage | (Hectares) | Percentage | (Hectares) | Percentage | (Hectares) | Percentage | (Hectares) | Percentage | |
| Almaria | 586.18 | 74.817 | 12.76% | 270.038 | 46.07% | 241.325 | 41.17% | ||||||
| Bacong | 384.549 | 214.919 | 55.89% | 29.641 | 7.71% | 63.942 | 16.63% | 75.748 | 19.70% | 0.299 | 0.08% | ||
| Badiang | 681.255 | 251.155 | 36.87% | 0.395 | 0.06% | 259.81 | 38.14% | 165.73 | 24.33% | 4.166 | 0.61% | ||
| Buenasuerte | 483.765 | 136.142 | 28.14% | 223.866 | 46.28% | 123.758 | 25.58% | ||||||
| Candabong | 913.208 | 261.812 | 28.67% | 0.987 | 0.11% | 242.188 | 26.52% | 34.254 | 3.75% | 371.969 | 40.73% | 1.998 | 0.22% |
| Casica | 127.206 | 56.173 | 44.16% | 36.011 | 28.31% | 35.021 | 27.53% | ||||||
| Katipunan | 437.769 | 252.487 | 57.68% | 157.505 | 35.98% | 27.776 | 6.35% | ||||||
| Linawan | 308.36 | 85.66 | 27.78% | 119.45 | 38.74% | 103.237 | 33.48% | 0.014 | 0.00% | ||||
| Lundag | 1,114.26 | 279.613 | 25.09% | 428.148 | 38.43% | 406.495 | 36.48% | ||||||
| Poblacion | 51.421 | 51.421 | 100.00% | ||||||||||
| Santa Cruz | 211.921 | 78.572 | 37.08% | 45.304 | 21.38% | 88.044 | 41.55% | ||||||
| Suba | 150.647 | 114.973 | 76.32% | 29.462 | 19.56% | 6.211 | 4.12% | ||||||
| Talisay | 242.032 | 52.774 | 21.81% | 100.712 | 41.61% | 88.406 | 36.53% | 0.14 | 0.06% | ||||
| Tanod | 611.43 | 236.846 | 38.74% | 144.821 | 23.69% | 229.767 | 37.58% | ||||||
| Tawid | 142.246 | 83.022 | 58.37% | 30.239 | 21.26% | 28.985 | 20.38% | ||||||
| Virgen | 438.871 | 163.279 | 37.20% | 17.37 | 3.96% | 103.215 | 23.52% | 153.686 | 35.02% | 1.321 | 0.30% | ||
| Total | 6,885.12 | 1,413.76 | 20.53% | 0.987 | 0.01% | 1,269.50 | 18.44% | 2,017.32 | 29.30% | 2,169.41 | 31.51% | 14.149 | 0.21% |