
Download in PDF and JPG format
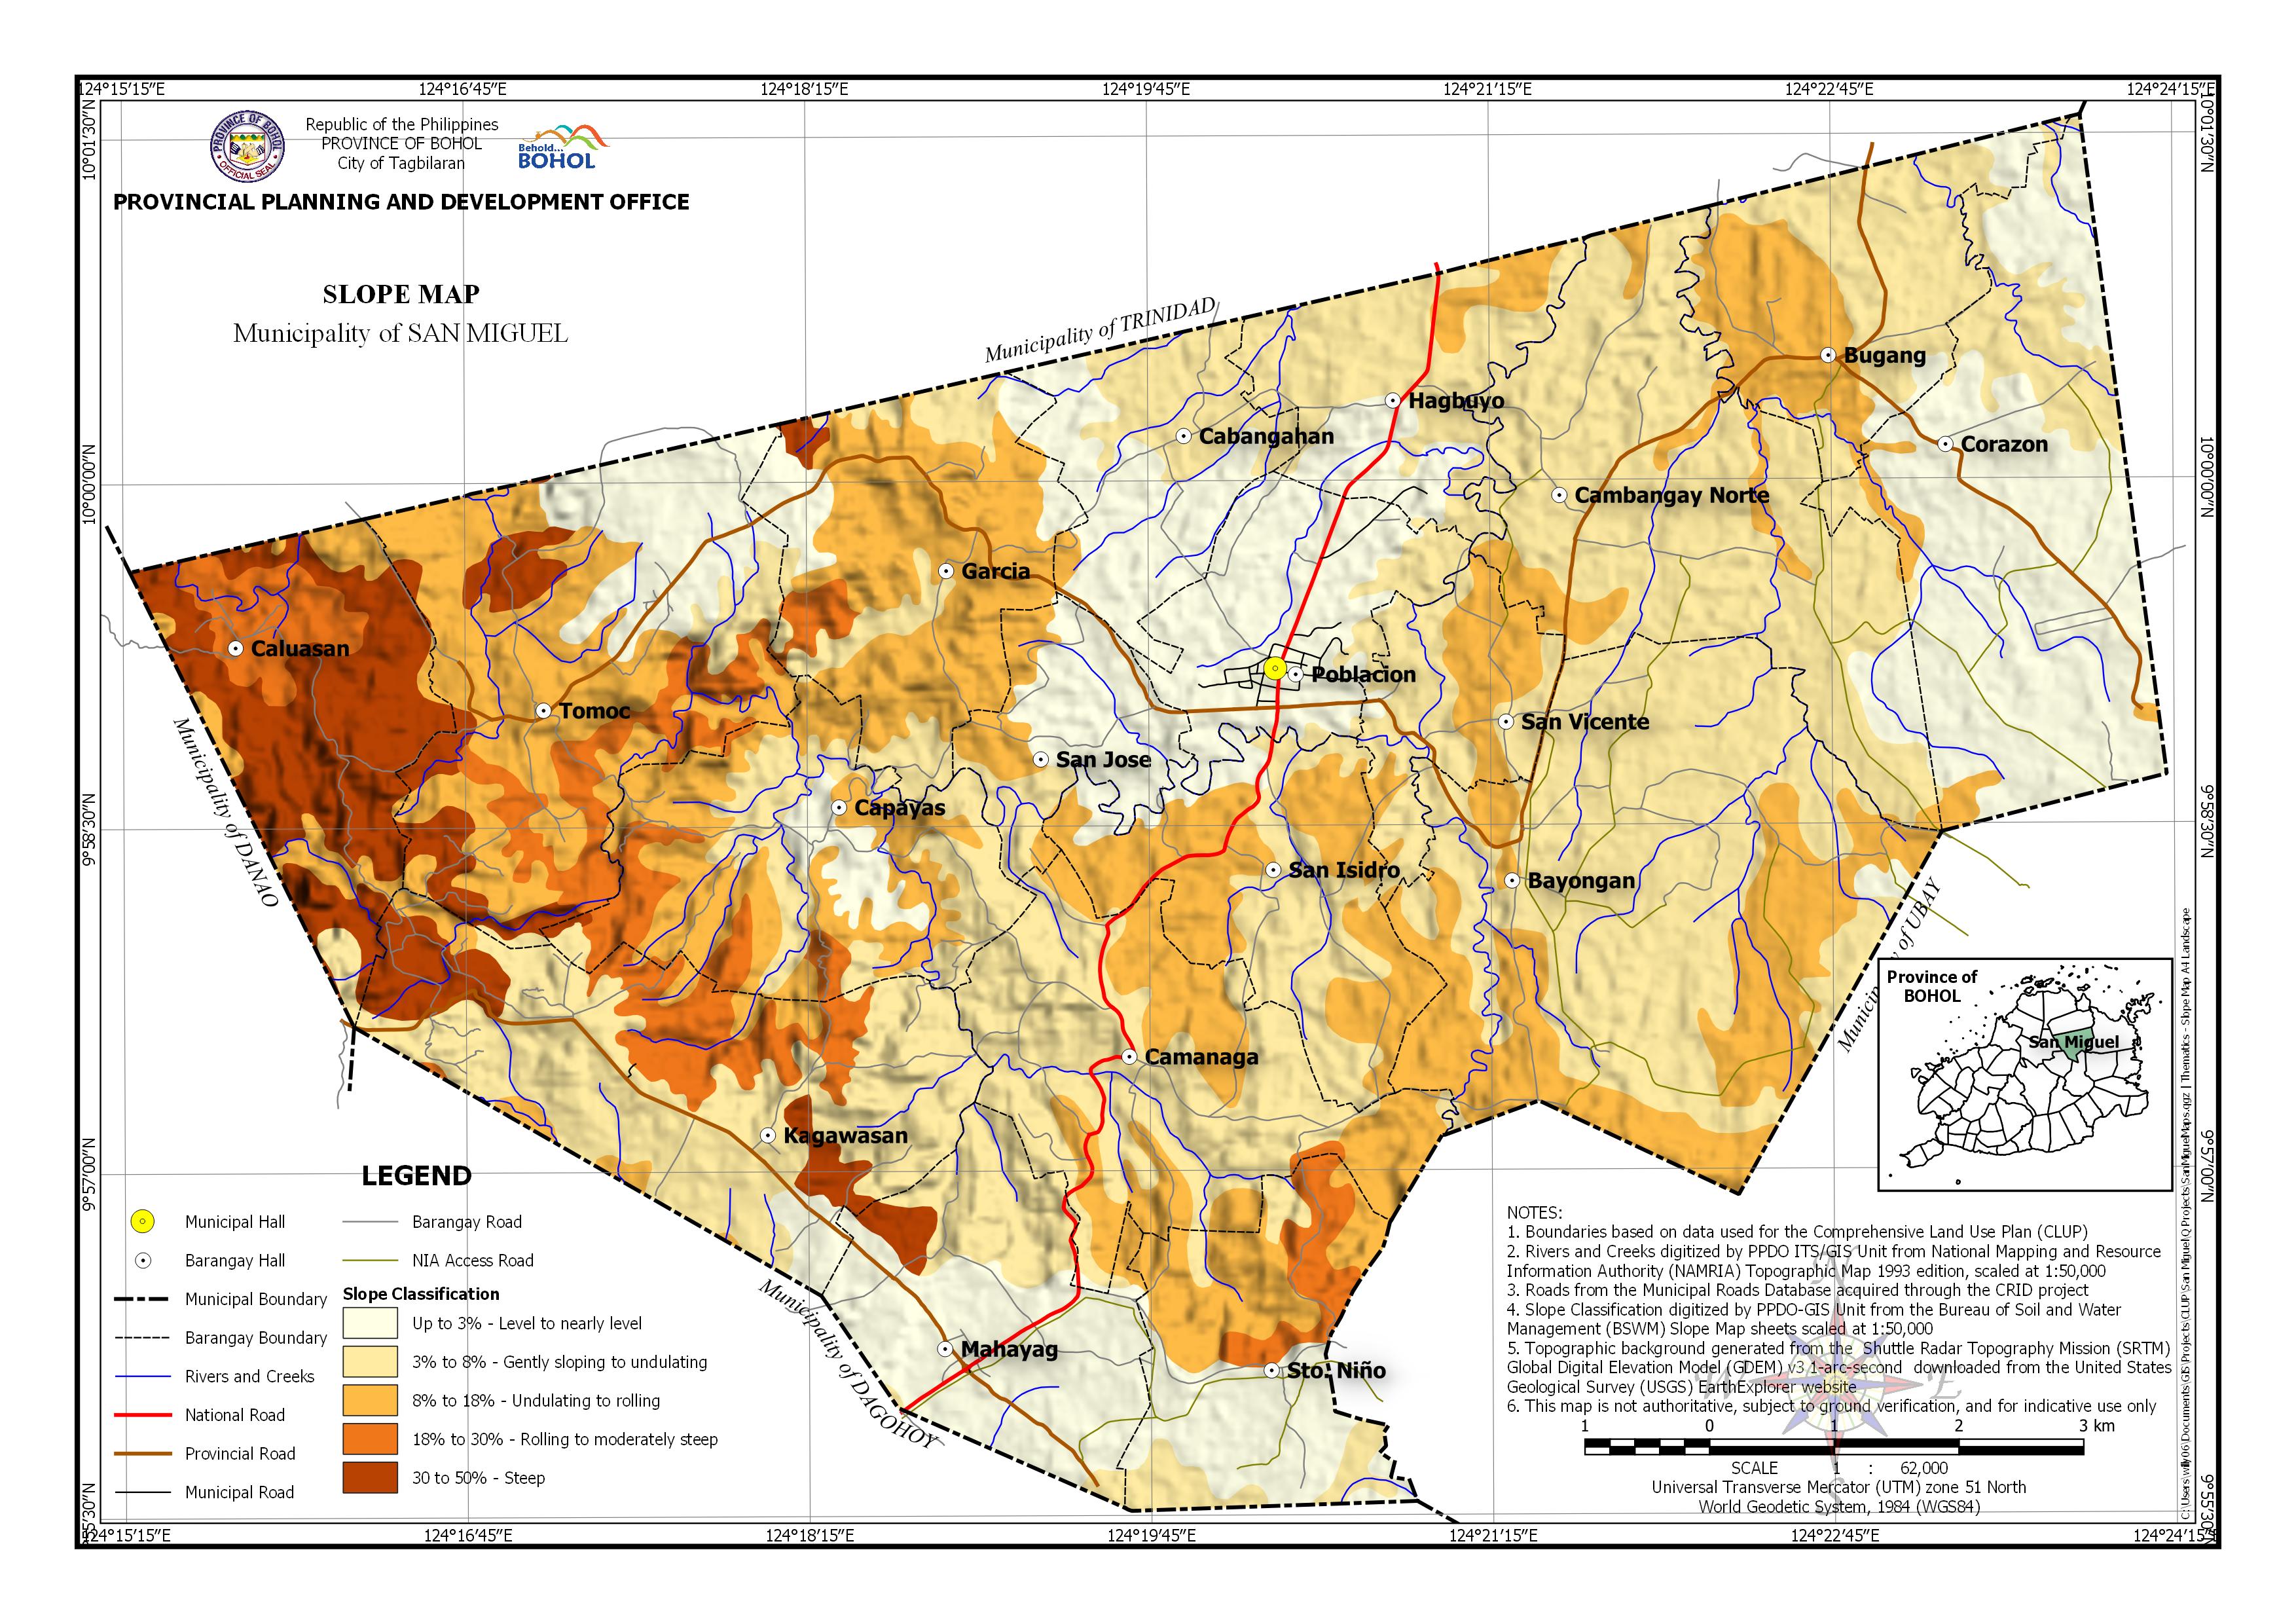
AREA PER SLOPE CLASSIFICATION BY BARANGAY
| Barangay | Area | Up to 3% – Level to Nearly Level | 3% to 08% – Gently Sloping to Undulating | 8% to 18% – Undulating to Rolling | 18% to 30% – Rolling to Moderately Steep | 30% to 50% – Steep | |||||
| (Hectares) | (Hectares) | (Percentage) | (Hectares) | (Percentage) | (Hectares) | (Percentage) | (Hectares) | (Percentage) | (Hectares) | (Percentage) | |
| Bayongan | 1,250.10 | 10.286 | 0.82% | 807.074 | 64.56% | 432.738 | 34.62% | ||||
| Bugang | 440.944 | 28.959 | 6.57% | 248.146 | 56.28% | 163.839 | 37.16% | ||||
| Cabangahan | 339.211 | 195.074 | 57.51% | 134.67 | 39.70% | 9.468 | 2.79% | ||||
| Caluasan | 524.448 | 14.767 | 2.82% | 61.095 | 11.65% | 96.301 | 18.36% | 352.285 | 67.17% | ||
| Camanaga | 656.314 | 2.198 | 0.34% | 410.455 | 62.54% | 238.971 | 36.41% | 4.69 | 0.72% | ||
| Cambangay Norte | 858.694 | 38.89 | 4.53% | 729.445 | 84.95% | 90.358 | 10.52% | ||||
| Capayas | 590.621 | 55.363 | 9.37% | 186.208 | 31.53% | 264.774 | 44.83% | 80.852 | 13.69% | 3.424 | 0.58% |
| Corazon | 848.991 | 660.41 | 77.79% | 150.335 | 17.71% | 38.247 | 4.51% | ||||
| Garcia | 569.211 | 68.785 | 12.08% | 107.703 | 18.92% | 356.881 | 62.70% | 25.659 | 4.51% | 10.184 | 1.79% |
| Hagbuyo | 367.155 | 79.683 | 21.70% | 248.674 | 67.73% | 38.798 | 10.57% | ||||
| Kagawasan | 819.411 | 32.807 | 4.00% | 501.203 | 61.17% | 53.79 | 6.56% | 132.39 | 16.16% | 99.222 | 12.11% |
| Mahayag | 492.551 | 327.561 | 66.50% | 133.86 | 27.18% | 8.725 | 1.77% | 22.406 | 4.55% | ||
| Poblacion | 358.19 | 306.036 | 85.44% | 52.093 | 14.54% | 0.061 | 0.02% | ||||
| San Isidro | 470.994 | 37.471 | 7.96% | 171.131 | 36.33% | 262.392 | 55.71% | ||||
| San Jose | 234.559 | 140.247 | 59.79% | 38.696 | 16.50% | 55.616 | 23.71% | ||||
| San Vicente | 248.082 | 4.991 | 2.01% | 144.689 | 58.32% | 98.403 | 39.67% | ||||
| Sto. Niño | 441.053 | 169.246 | 38.37% | 73.768 | 16.73% | 127.089 | 28.82% | 70.951 | 16.09% | ||
| Tomoc | 886.864 | 195.617 | 22.06% | 42.121 | 4.75% | 398.07 | 44.89% | 141.439 | 15.95% | 109.616 | 12.36% |
| Total | 10,397.39 | 2,353.62 | 22.64% | 4,195.04 | 40.35% | 2,699.31 | 25.96% | 552.281 | 5.31% | 597.137 | 5.74% |