
Download in PDF and JPG format
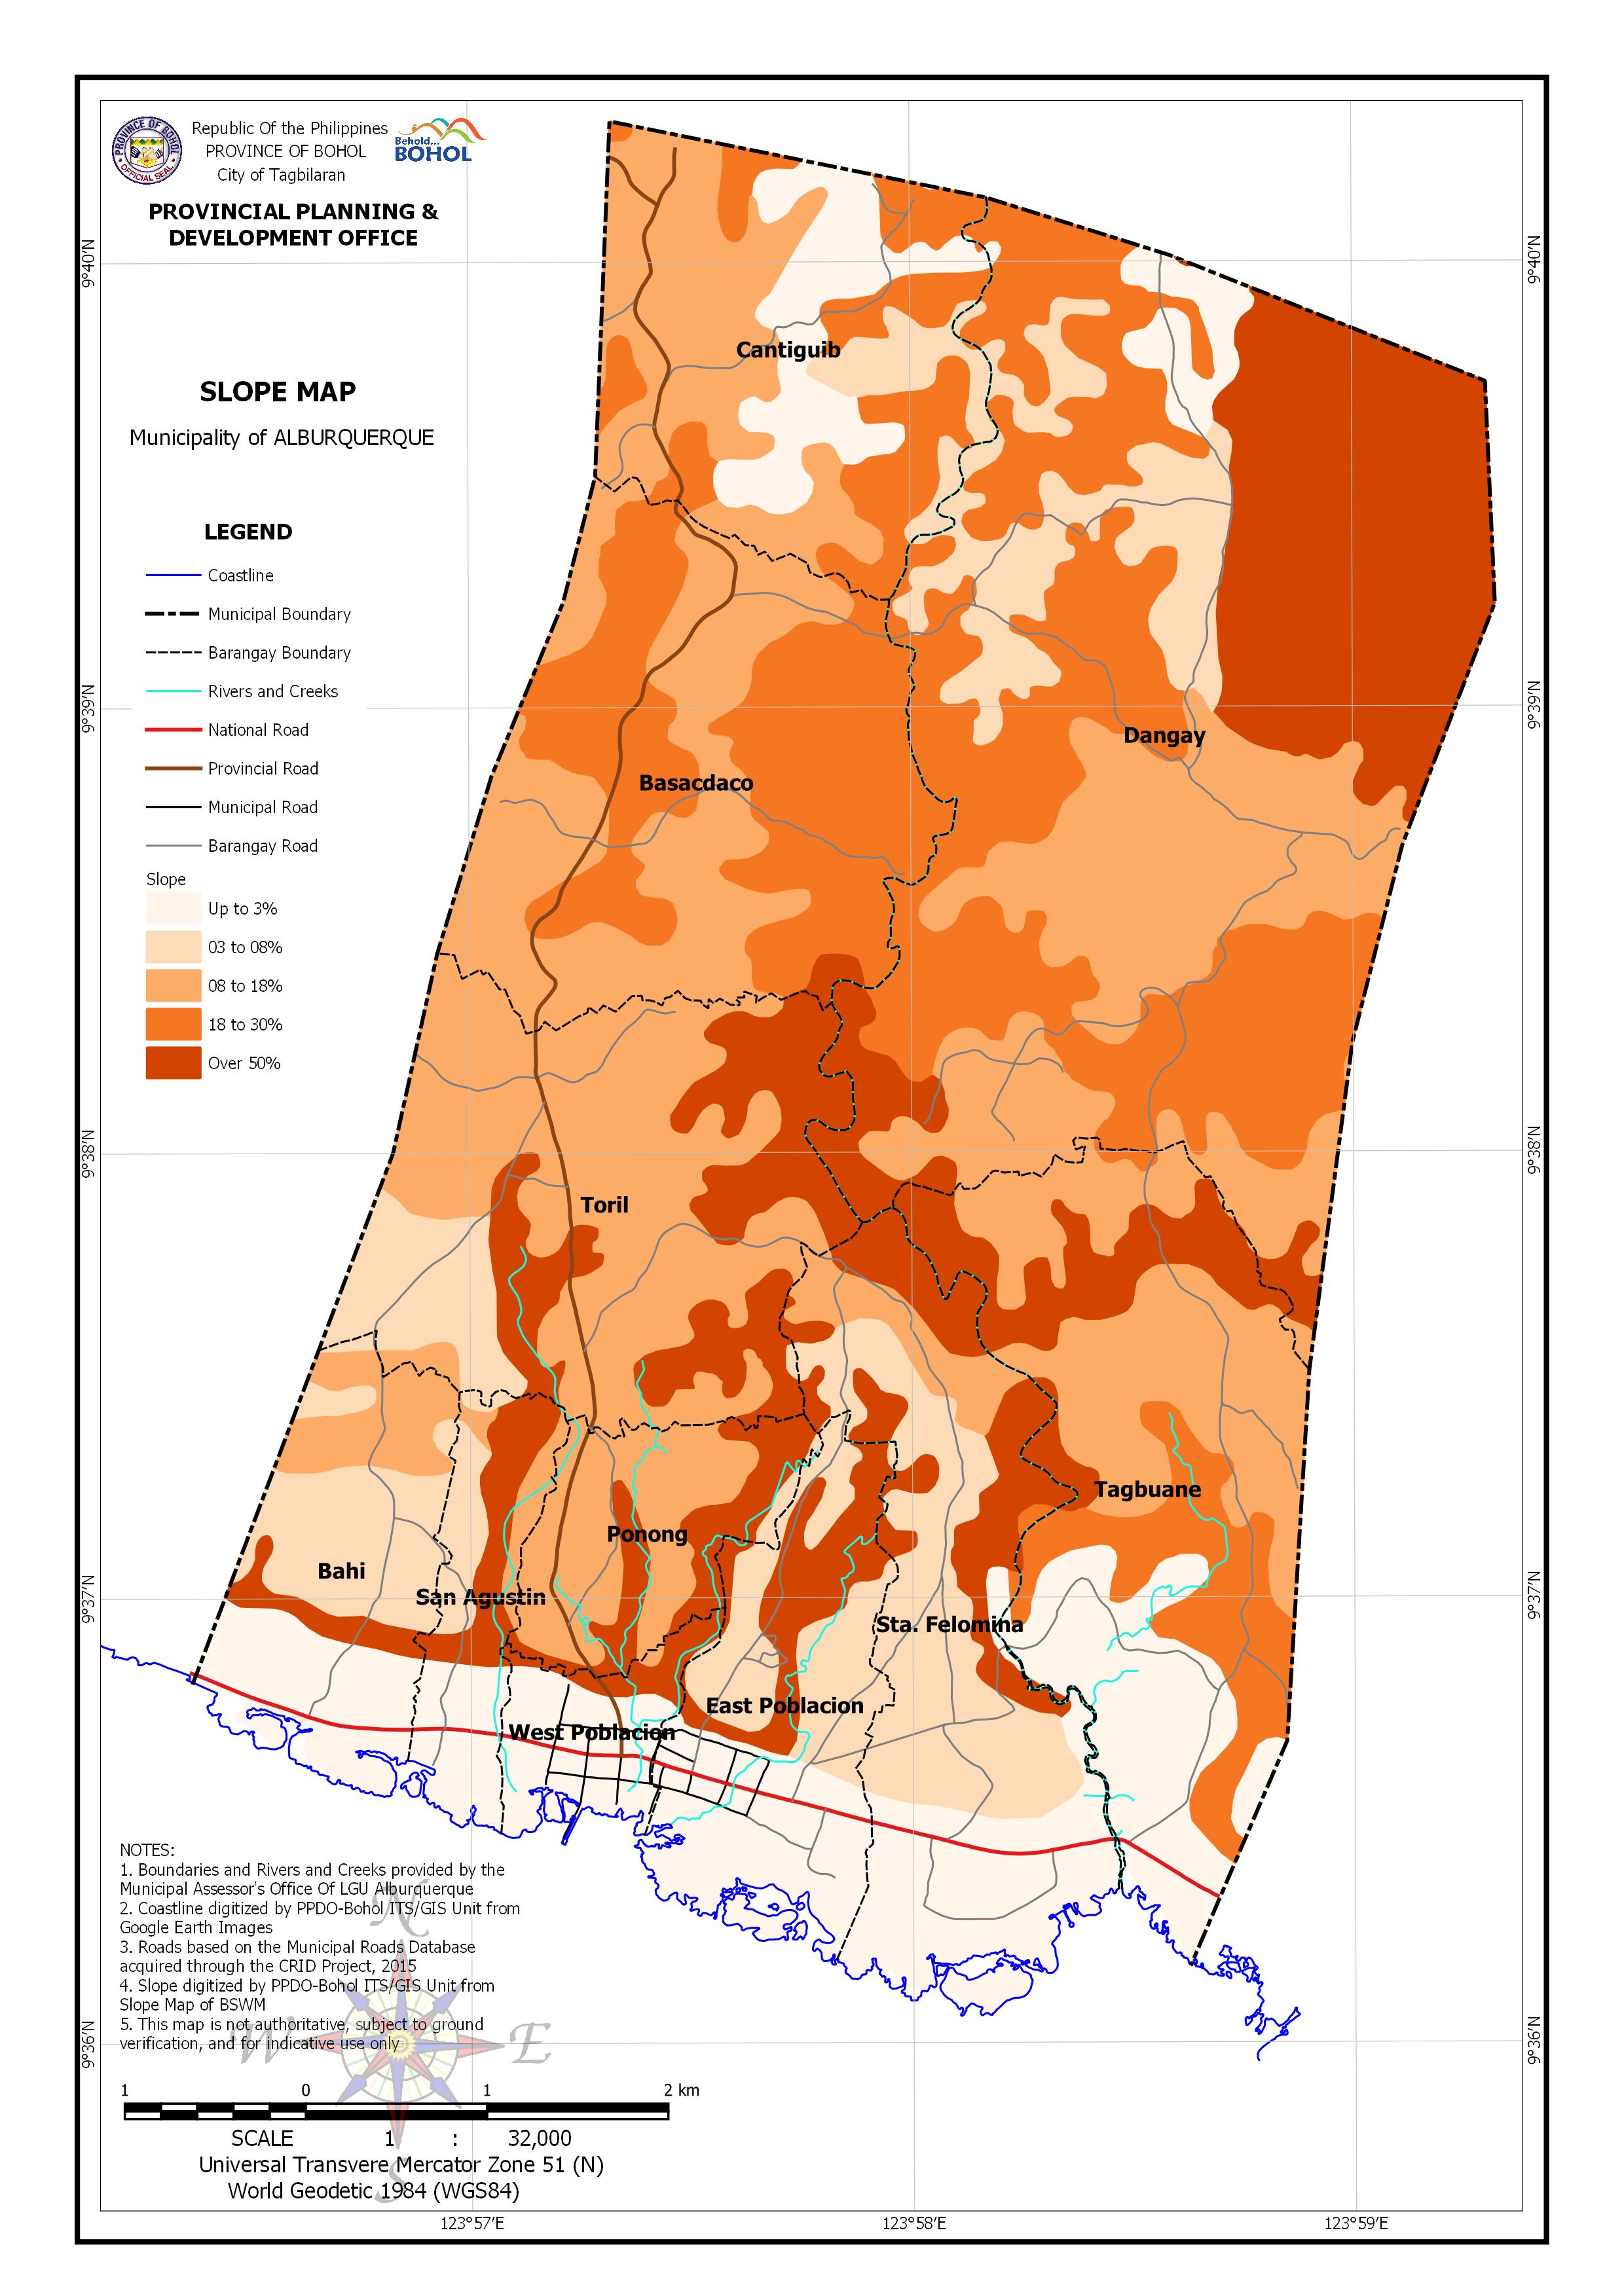
AREA PER SLOPE CLASSIFCATION BY BARANGAY
| Barangay | Area | Up to 3% – Level to Nearly Level | 3% to 8% – Gently Sloping to Undulating | 8% to 18% – Undulating to Rolling | 18% to 30% – Rolling to Moderately Steep | 30% to 50% – Steep | |||||
| (Hectares) | (Hectares) | (Percentage) | (Hectares) | (Percentage) | (Hectares) | (Percentage) | (Hectares) | (Percentage) | (Hectares) | (Percentage) | |
| Bahi | 131.978 | 45.845 | 34.74% | 49.39 | 37.42% | 26.402 | 20.01% | 10.341 | 7.84% | ||
| Basacdaco | 320.521 | 144.46 | 45.07% | 172.662 | 53.87% | 3.399 | 1.06% | ||||
| Cantiguib | 244.97 | 53.086 | 21.67% | 20.575 | 8.40% | 101.032 | 41.24% | 70.277 | 28.69% | ||
| Dangay | 815.135 | 21.034 | 2.58% | 79.929 | 9.81% | 196.015 | 24.05% | 295.616 | 36.27% | 222.541 | 27.30% |
| East Poblacion | 141.696 | 60.297 | 42.55% | 47.39 | 33.45% | 34.008 | 24.00% | ||||
| Ponong | 89.032 | 0.003 | 0.00% | 2.309 | 2.59% | 57.129 | 64.17% | 29.592 | 33.24% | ||
| San Agustin | 65.521 | 22.92 | 34.98% | 13.316 | 20.32% | 8.109 | 12.38% | 21.176 | 32.32% | ||
| Sta. Felomina | 242.704 | 75.219 | 30.99% | 88.857 | 36.61% | 20.764 | 8.56% | 1.45 | 0.60% | 56.414 | 23.24% |
| Tagbuane | 319.398 | 83.397 | 26.11% | 113.937 | 35.67% | 68.19 | 21.35% | 53.873 | 16.87% | ||
| Toril | 308.17 | 38.265 | 12.42% | 180.595 | 58.60% | 0.001 | 0.00% | 89.309 | 28.98% | ||
| West Poblacion | 47.003 | 36.484 | 77.62% | 0.216 | 0.46% | 0.468 | 1.00% | 9.835 | 20.93% | ||
| Total | 2,726.13 | 398.285 | 14.61% | 340.247 | 12.48% | 848.912 | 31.14% | 608.196 | 22.31% | 530.488 | 19.46% |