
Download in PDF and JPG format
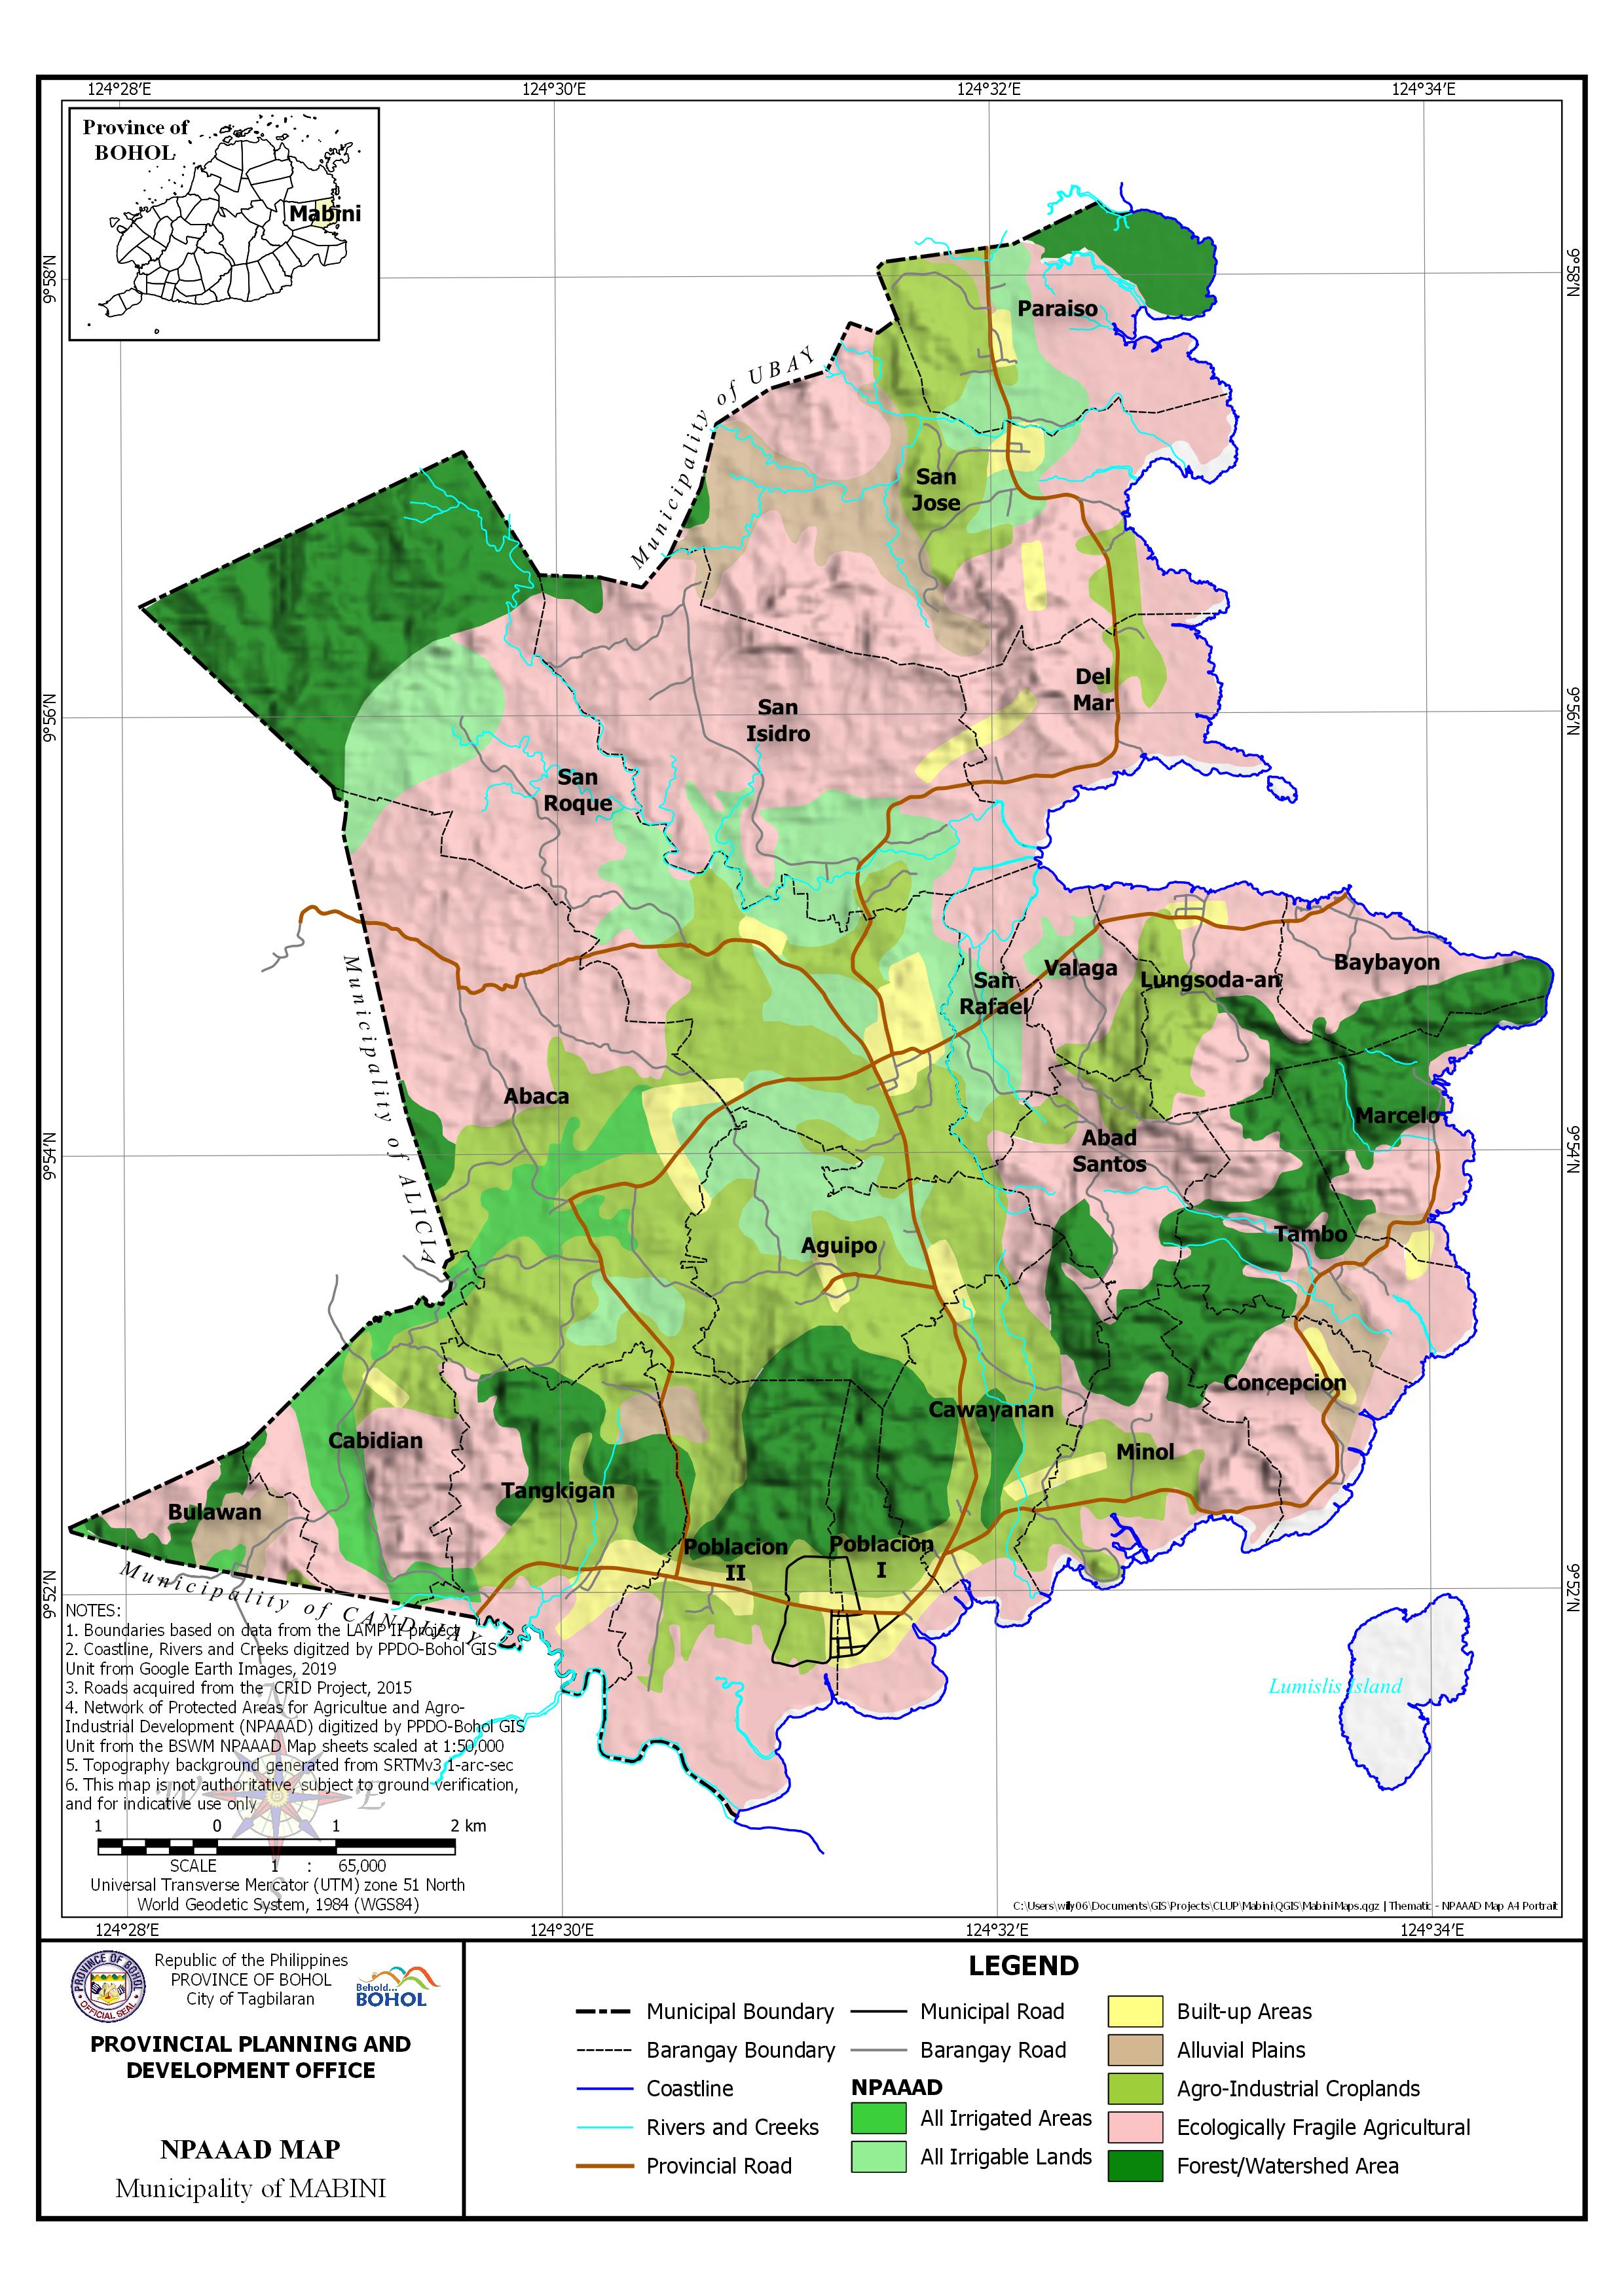
AREA PER NPAAAD CLASSIFICATION BY BARANGAY
| Barangay | Area | All Irrigated Areas | All Irrigable Lands | Built-up Areas | Alluvial Plains | Agro-Industrial Croplands | Ecologically Fragile Agricultural | Forest/Watershed Area | No Data | ||||||||
| Hectares | Hectares | Percentage | Hectares | Percentage | Hectares | Percentage | Hectares | Percentage | Hectares | Percentage | Hectares | Percentage | Hectares | Percentage | Hectares | Percentage | |
| Abaca | 944.471 | 95.278 | 10.09% | 69.647 | 7.37% | 29.23 | 3.10% | 321.285 | 34.02% | 407.614 | 43.16% | 21.418 | 2.27% | ||||
| Abad Santos | 232.914 | 42.46 | 18.23% | 160.068 | 68.72% | 30.385 | 13.05% | 0 | 0.00% | ||||||||
| Aguipo | 442.045 | 115.391 | 26.10% | 22.247 | 5.03% | 243.657 | 55.12% | 19.463 | 4.40% | 41.286 | 9.34% | ||||||
| Baybayon | 185.445 | 120.765 | 65.12% | 64.629 | 34.85% | 0.051 | 0.03% | ||||||||||
| Bulawan | 126.765 | 6.42 | 5.07% | 35.879 | 28.30% | 2.398 | 1.89% | 52.054 | 41.06% | 30.013 | 23.68% | 0.001 | 0.00% | ||||
| Cabidian | 313.637 | 106.252 | 33.88% | 7.013 | 2.24% | 0.672 | 0.21% | 53.191 | 16.96% | 143.06 | 45.61% | 3.449 | 1.10% | ||||
| Cawayanan | 377.966 | 21.658 | 5.73% | 178.71 | 47.28% | 47.841 | 12.66% | 126.365 | 33.43% | 3.393 | 0.90% | ||||||
| Concepcion | 219.29 | 13.373 | 6.10% | 27.821 | 12.69% | 113.488 | 51.75% | 52.03 | 23.73% | 12.578 | 5.74% | ||||||
| Del Mar | 286.973 | 12.33 | 4.30% | 26.681 | 9.30% | 231.777 | 80.77% | 16.186 | 5.64% | ||||||||
| Lungsoda-an | 241.967 | 10.68 | 4.41% | 68.809 | 28.44% | 136.037 | 56.22% | 26.435 | 10.93% | 0.004 | 0.00% | ||||||
| Marcelo | 218.321 | 5.039 | 2.31% | 11.903 | 5.45% | 74.92 | 34.32% | 123.959 | 56.78% | 2.5 | 1.15% | ||||||
| Minol | 284.162 | 7.787 | 2.74% | 97.321 | 34.25% | 119.107 | 41.92% | 46.648 | 16.42% | 13.3 | 4.68% | ||||||
| Paraiso | 388.851 | 77.353 | 19.89% | 8.704 | 2.24% | 8.233 | 2.12% | 82.132 | 21.12% | 126.03 | 32.41% | 82.721 | 21.27% | 3.678 | 0.95% | ||
| Poblacion I | 181.389 | 39.159 | 21.59% | 34.644 | 19.10% | 48.737 | 26.87% | 52.289 | 28.83% | 6.559 | 3.62% | ||||||
| Poblacion II | 519.893 | 30.078 | 5.79% | 14.553 | 2.80% | 157.812 | 30.36% | 183.37 | 35.27% | 129.005 | 24.81% | 5.075 | 0.98% | ||||
| San Isidro | 733.392 | 140.099 | 19.10% | 10.441 | 1.42% | 5.741 | 0.78% | 15.351 | 2.09% | 549.639 | 74.95% | 11.713 | 1.60% | 0.408 | 0.06% | ||
| San Jose | 834.795 | 43.191 | 5.17% | 26.069 | 3.12% | 185.94 | 22.27% | 126.686 | 15.18% | 432.64 | 51.83% | 4.639 | 0.56% | 15.631 | 1.87% | ||
| San Rafael | 149.486 | 65.201 | 43.62% | 20.244 | 13.54% | 64.041 | 42.84% | 0 | 0.00% | ||||||||
| San Roque | 1,376.05 | 345.643 | 25.12% | 64.11 | 4.66% | 248.833 | 18.08% | 296.592 | 21.55% | 420.521 | 30.56% | 0.345 | 0.03% | ||||
| Tambo | 303.148 | 3.335 | 1.10% | 38.045 | 12.55% | 139.151 | 45.90% | 119.453 | 39.40% | 3.163 | 1.04% | ||||||
| Tangkigan | 423.821 | 8.654 | 2.04% | 34.489 | 8.14% | 13.685 | 3.23% | 119.127 | 28.11% | 132.545 | 31.27% | 115.321 | 27.21% | ||||
| Valaga | 135.718 | 21.791 | 16.06% | 34.361 | 25.32% | 79.566 | 58.63% | ||||||||||
| Sub-Total | 8,920.49 | 216.604 | 2.43% | 878.316 | 9.85% | 345.742 | 3.88% | 342.472 | 3.84% | 1,873.70 | 21.00% | 3,678.50 | 41.24% | 1,502.28 | 16.84% | 82.872 | 0.93% |
| Lumislis Island | 114.701 | 114.701 | 100.00% | ||||||||||||||
| TOTAL | 9,035.19 | 216.604 | 2.40% | 878.316 | 9.72% | 345.742 | 3.83% | 342.472 | 3.79% | 1,873.70 | 20.74% | 3,678.50 | 40.71% | 1,502.28 | 16.63% | 197.573 | 2.19% |