
Download in PDF and JPG format
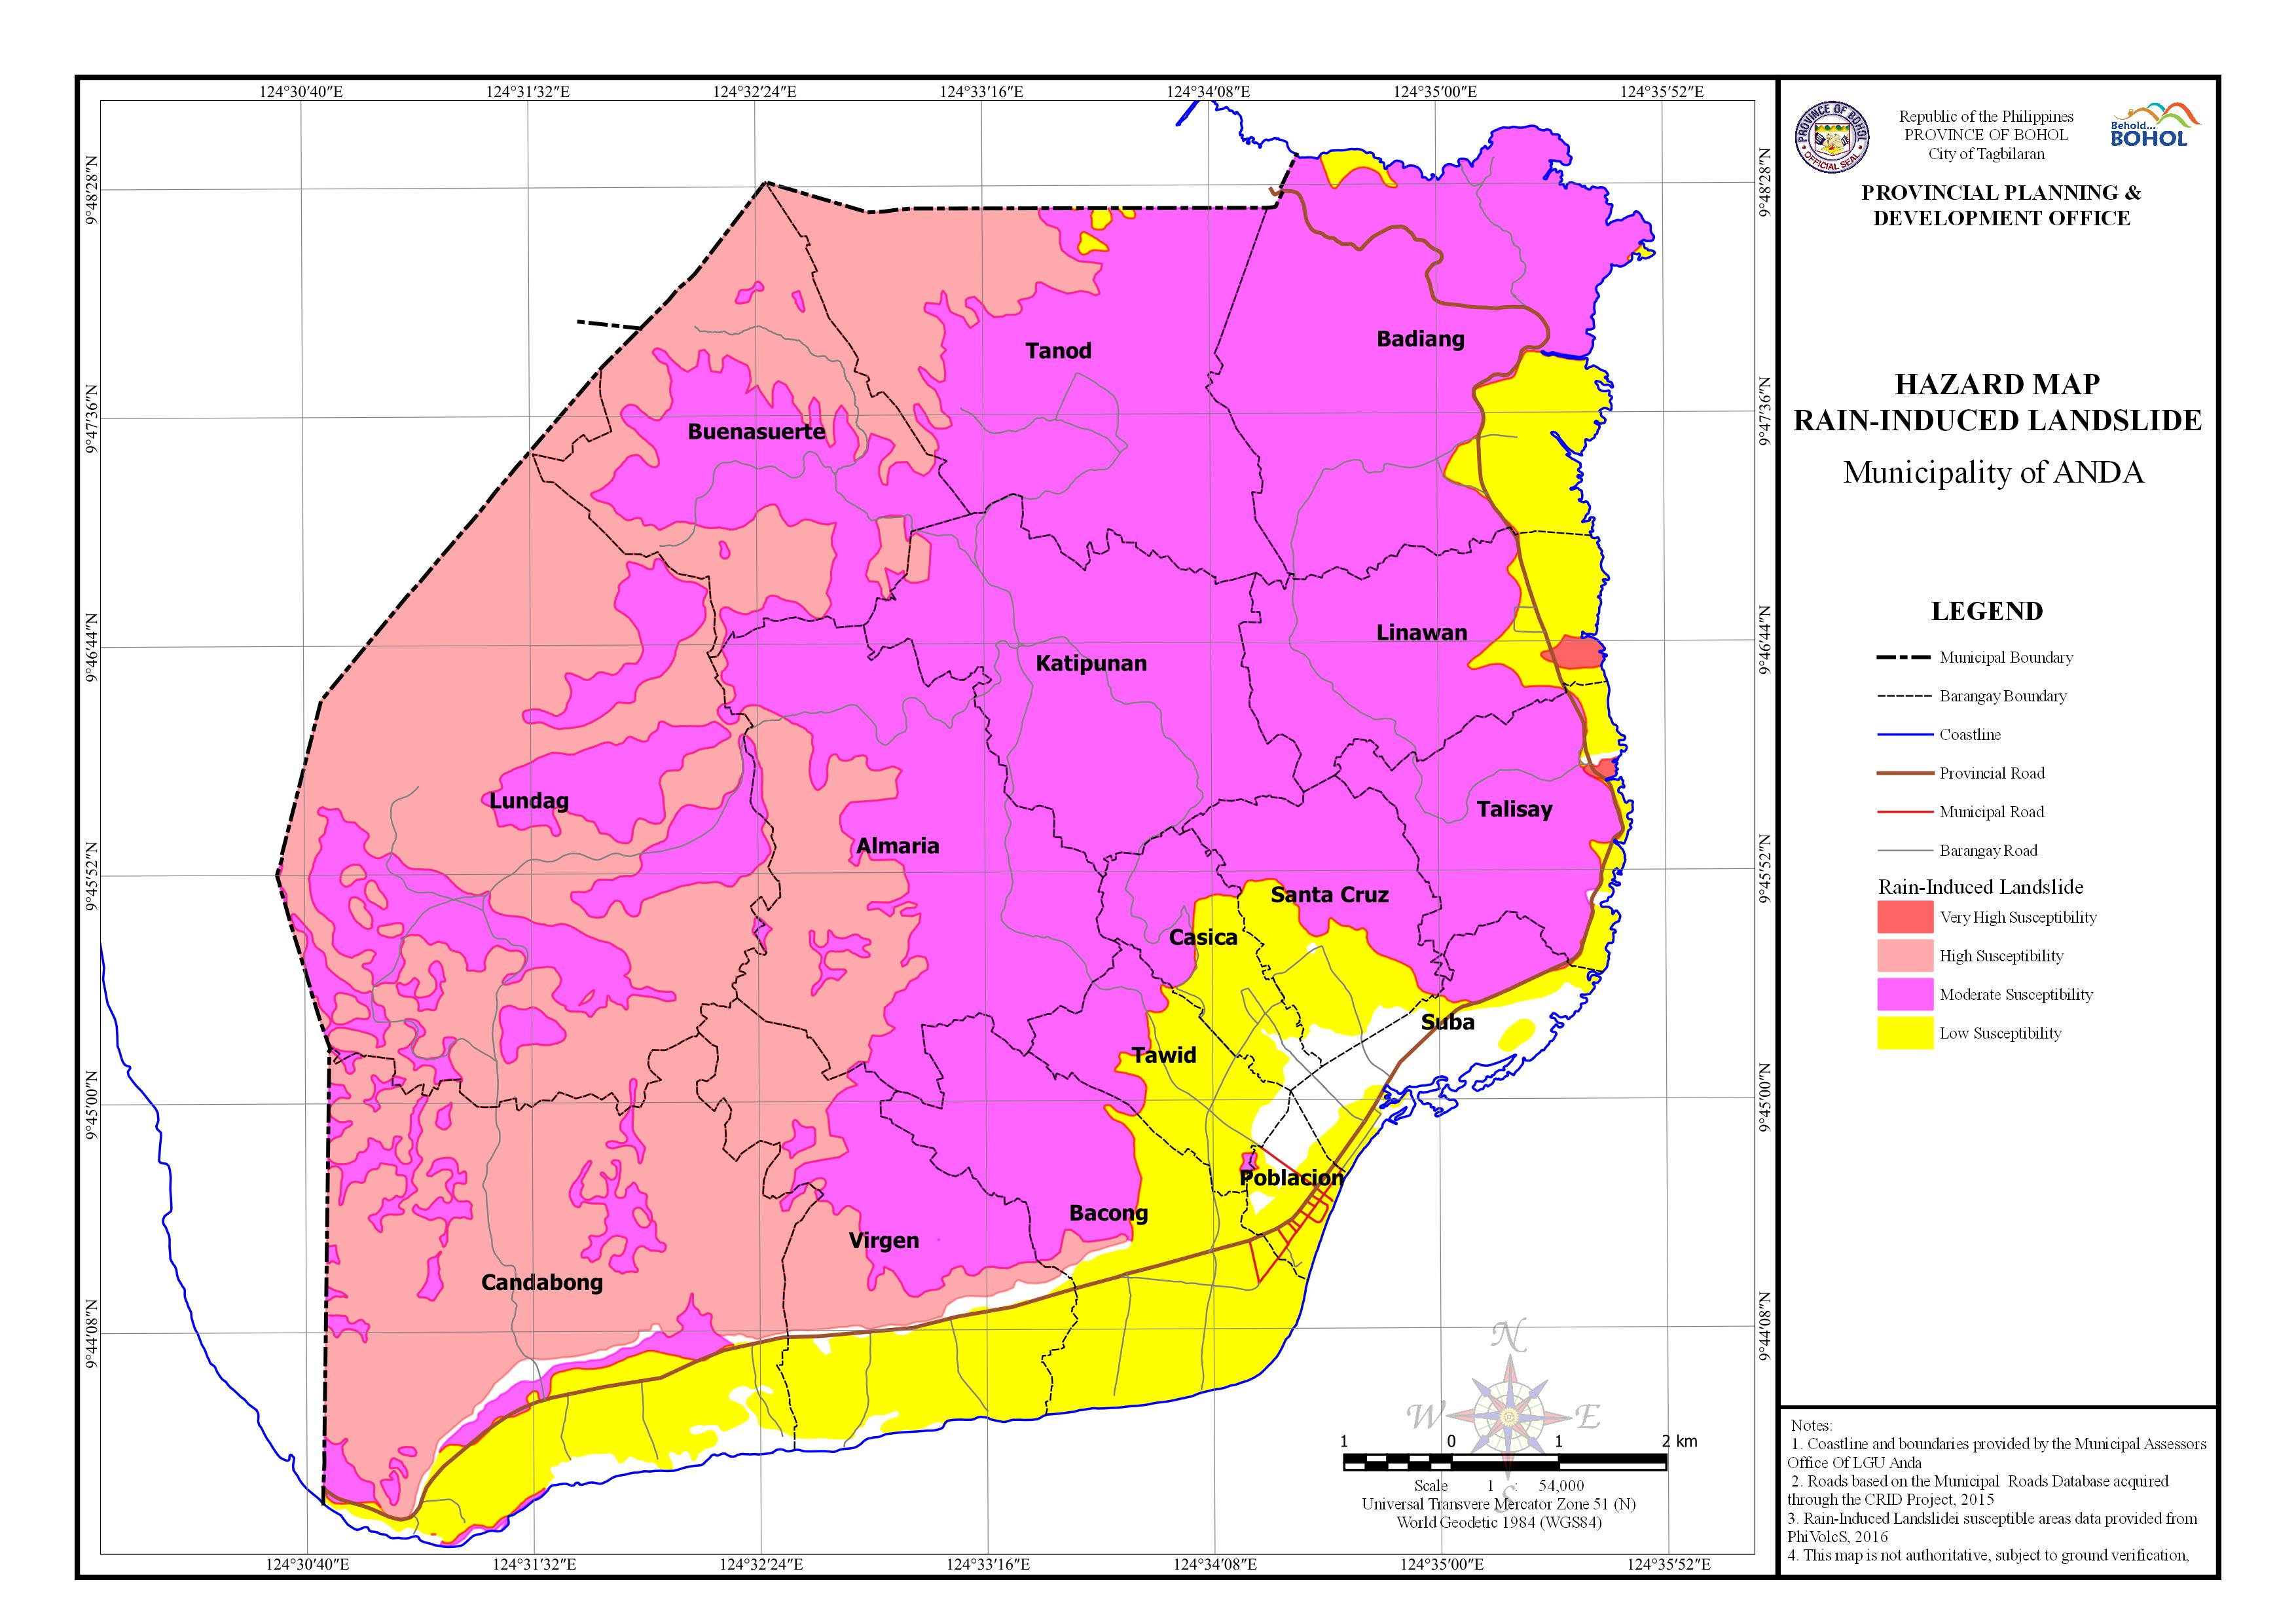
AREA EXPOSED TO RAIN-INDUCED LANDSLIDE BY BARANGAY
| Barangay | Area | Area Exposed to Very High Susceptibility | Area Exposed to High Susceptibility | Area Exposed to Moderate Susceptibility | Area Exposed to Low Susceptibility | ||||
| (Hectares) | (Hectares) | Percentage | (Hectares) | Percentage | (Hectares) | Percentage | (Hectares) | Percentage | |
| Almaria | 586.18 | 186.18 | 31.76% | 400 | 68.24% | ||||
| Bacong | 384.549 | 6.349 | 1.65% | 163.76 | 42.59% | 211.985 | 55.13% | ||
| Badiang | 681.255 | 578.629 | 84.94% | 102.362 | 15.03% | ||||
| Buenasuerte | 483.765 | 272.913 | 56.41% | 210.853 | 43.59% | ||||
| Candabong | 913.208 | 596.467 | 65.32% | 102.803 | 11.26% | 162.25 | 17.77% | ||
| Casica | 127.206 | 61.525 | 48.37% | 58.213 | 45.76% | ||||
| Katipunan | 437.769 | 4.702 | 1.07% | 433.067 | 98.93% | ||||
| Linawan | 308.36 | 7.384 | 2.40% | 240.414 | 77.97% | 60.534 | 19.63% | ||
| Lundag | 1,114.26 | 784.675 | 70.42% | 329.581 | 29.58% | ||||
| Poblacion | 51.421 | 0.431 | 0.84% | 36.137 | 70.28% | ||||
| Santa Cruz | 211.921 | 130.166 | 61.42% | 70.326 | 33.19% | ||||
| Suba | 150.647 | 34.44 | 22.86% | 31.201 | 20.71% | ||||
| Talisay | 242.032 | 2.36 | 0.98% | 208.327 | 86.07% | 27.937 | 11.54% | ||
| Tanod | 611.43 | 174.607 | 28.56% | 432.552 | 70.74% | 4.274 | 0.70% | ||
| Tawid | 142.246 | 57.852 | 40.67% | 78.422 | 55.13% | ||||
| Virgen | 438.871 | 154.338 | 35.17% | 123.853 | 28.22% | 135.816 | 30.95% | ||
| Total | 6,885.12 | 9.744 | 0.14% | 2,180.23 | 31.67% | 3,508.25 | 50.95% | 979.458 | 14.23% |