
Download in PDF and JPG format
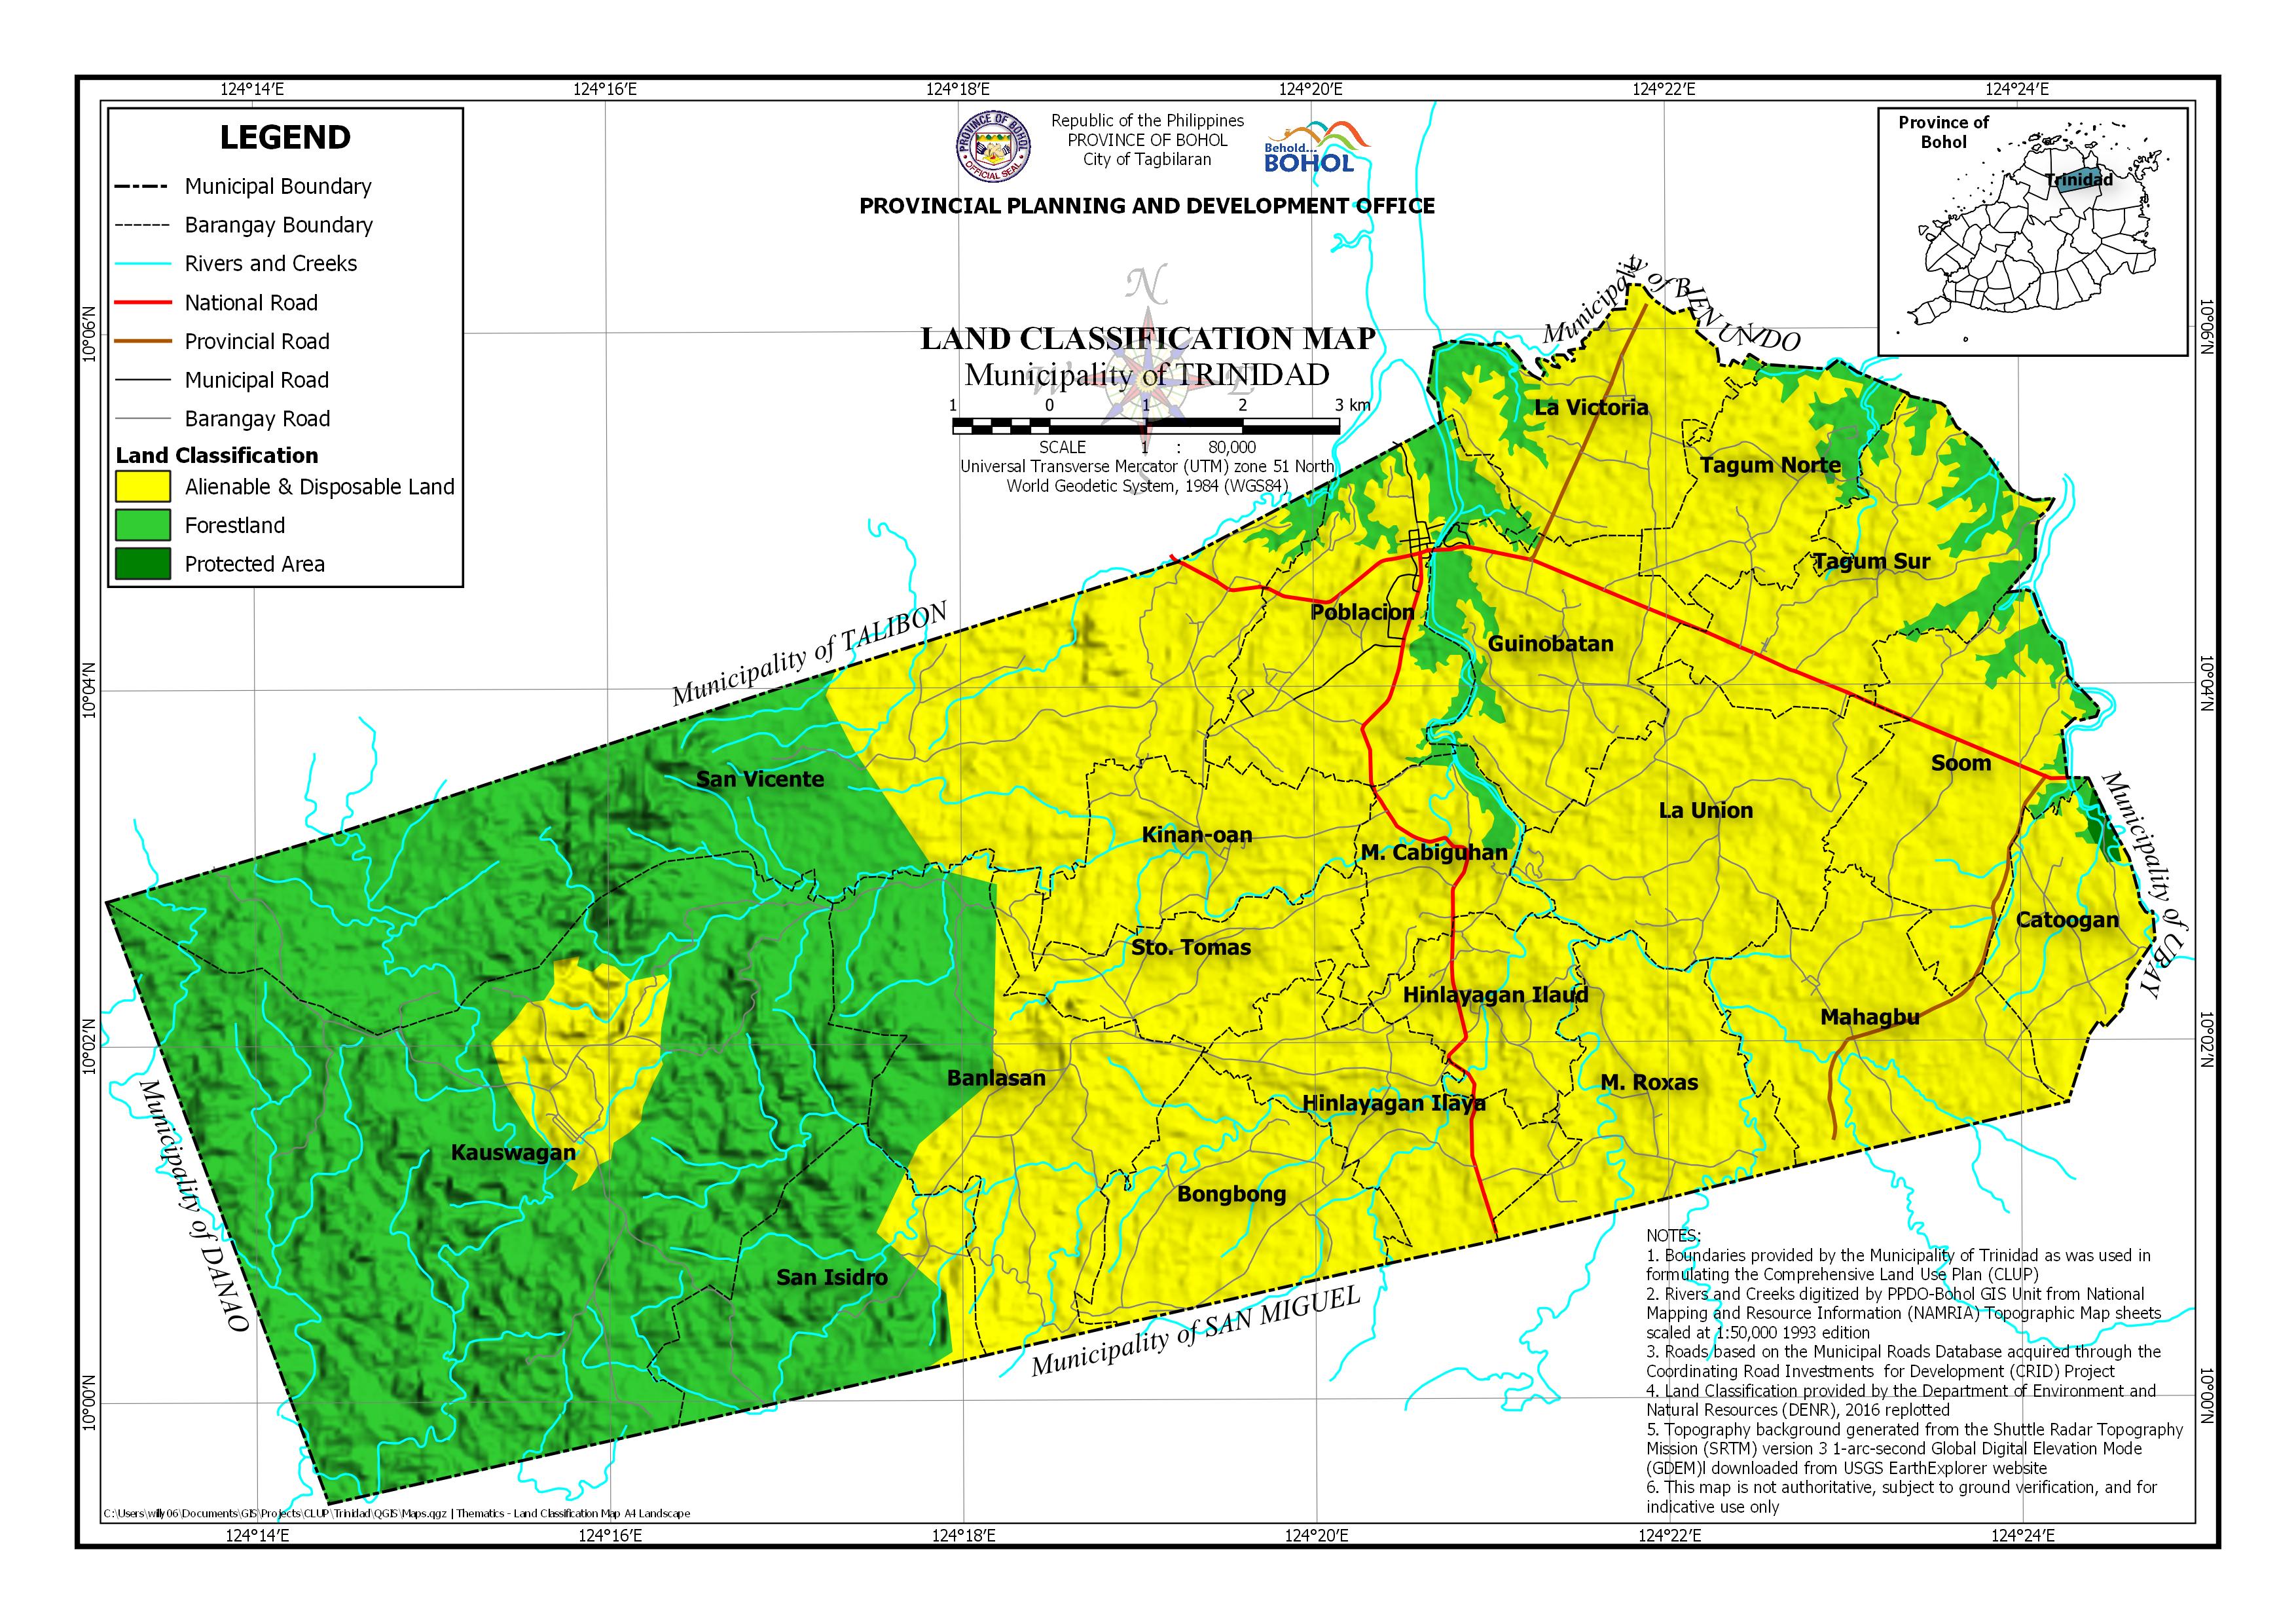
AREA PER LAND CLASSIFICATION BY BARANGAY
| Barangay | Area | Alienable and Disposable Land | Forestland | Protected Area | |||
| (Hectares) | (Hectares) | (Percentage) | (Hectares) | (Percentage) | (Hectares) | (Percentage) | |
| Banlasan | 988.739 | 601.375 | 60.82% | 387.364 | 39.18% | ||
| Bongbong | 540.748 | 540.748 | 100.00% | ||||
| Catoogan | 335.1 | 312.67 | 93.31% | 8.828 | 2.64% | 13.602 | 4.06% |
| Guinobatan | 563.906 | 489.208 | 86.75% | 74.698 | 13.25% | ||
| Hinlayagan Ilaud | 306.645 | 306.645 | 100.00% | ||||
| Hinlayagan Ilaya | 486.672 | 486.672 | 100.00% | ||||
| Kauswagan | 3,091.78 | 275.556 | 8.91% | 2,816.22 | 91.09% | ||
| Kinan-oan | 439.893 | 439.893 | 100.00% | ||||
| La Union | 724.351 | 724.351 | 100.00% | ||||
| La Victoria | 516.037 | 438.767 | 85.03% | 77.27 | 14.97% | ||
| M. Cabiguhan | 306.975 | 272.972 | 88.92% | 34.003 | 11.08% | ||
| M. Roxas | 512.497 | 512.497 | 100.00% | ||||
| Mahagbu | 627.355 | 627.355 | 100.00% | ||||
| Poblacion | 671.786 | 523.975 | 78.00% | 147.811 | 22.00% | ||
| San Isidro | 620.653 | 101.71 | 16.39% | 518.944 | 83.61% | ||
| San Vicente | 2,233.06 | 914.473 | 40.95% | 1,318.59 | 59.05% | ||
| Soom | 616.046 | 549.786 | 89.24% | 65.969 | 10.71% | 0.292 | 0.05% |
| Sto. Tomas | 401.716 | 399.656 | 99.49% | 2.06 | 0.51% | ||
| Tagum Norte | 392.375 | 311.105 | 79.29% | 81.27 | 20.71% | ||
| Tagum Sur | 613.829 | 486.165 | 79.20% | 127.664 | 20.80% | ||
| Total | 14,990.16 | 9,315.58 | 62.15% | 5,660.69 | 37.76% | 13.894 | 0.09% |