
Download in PDF and JPG format
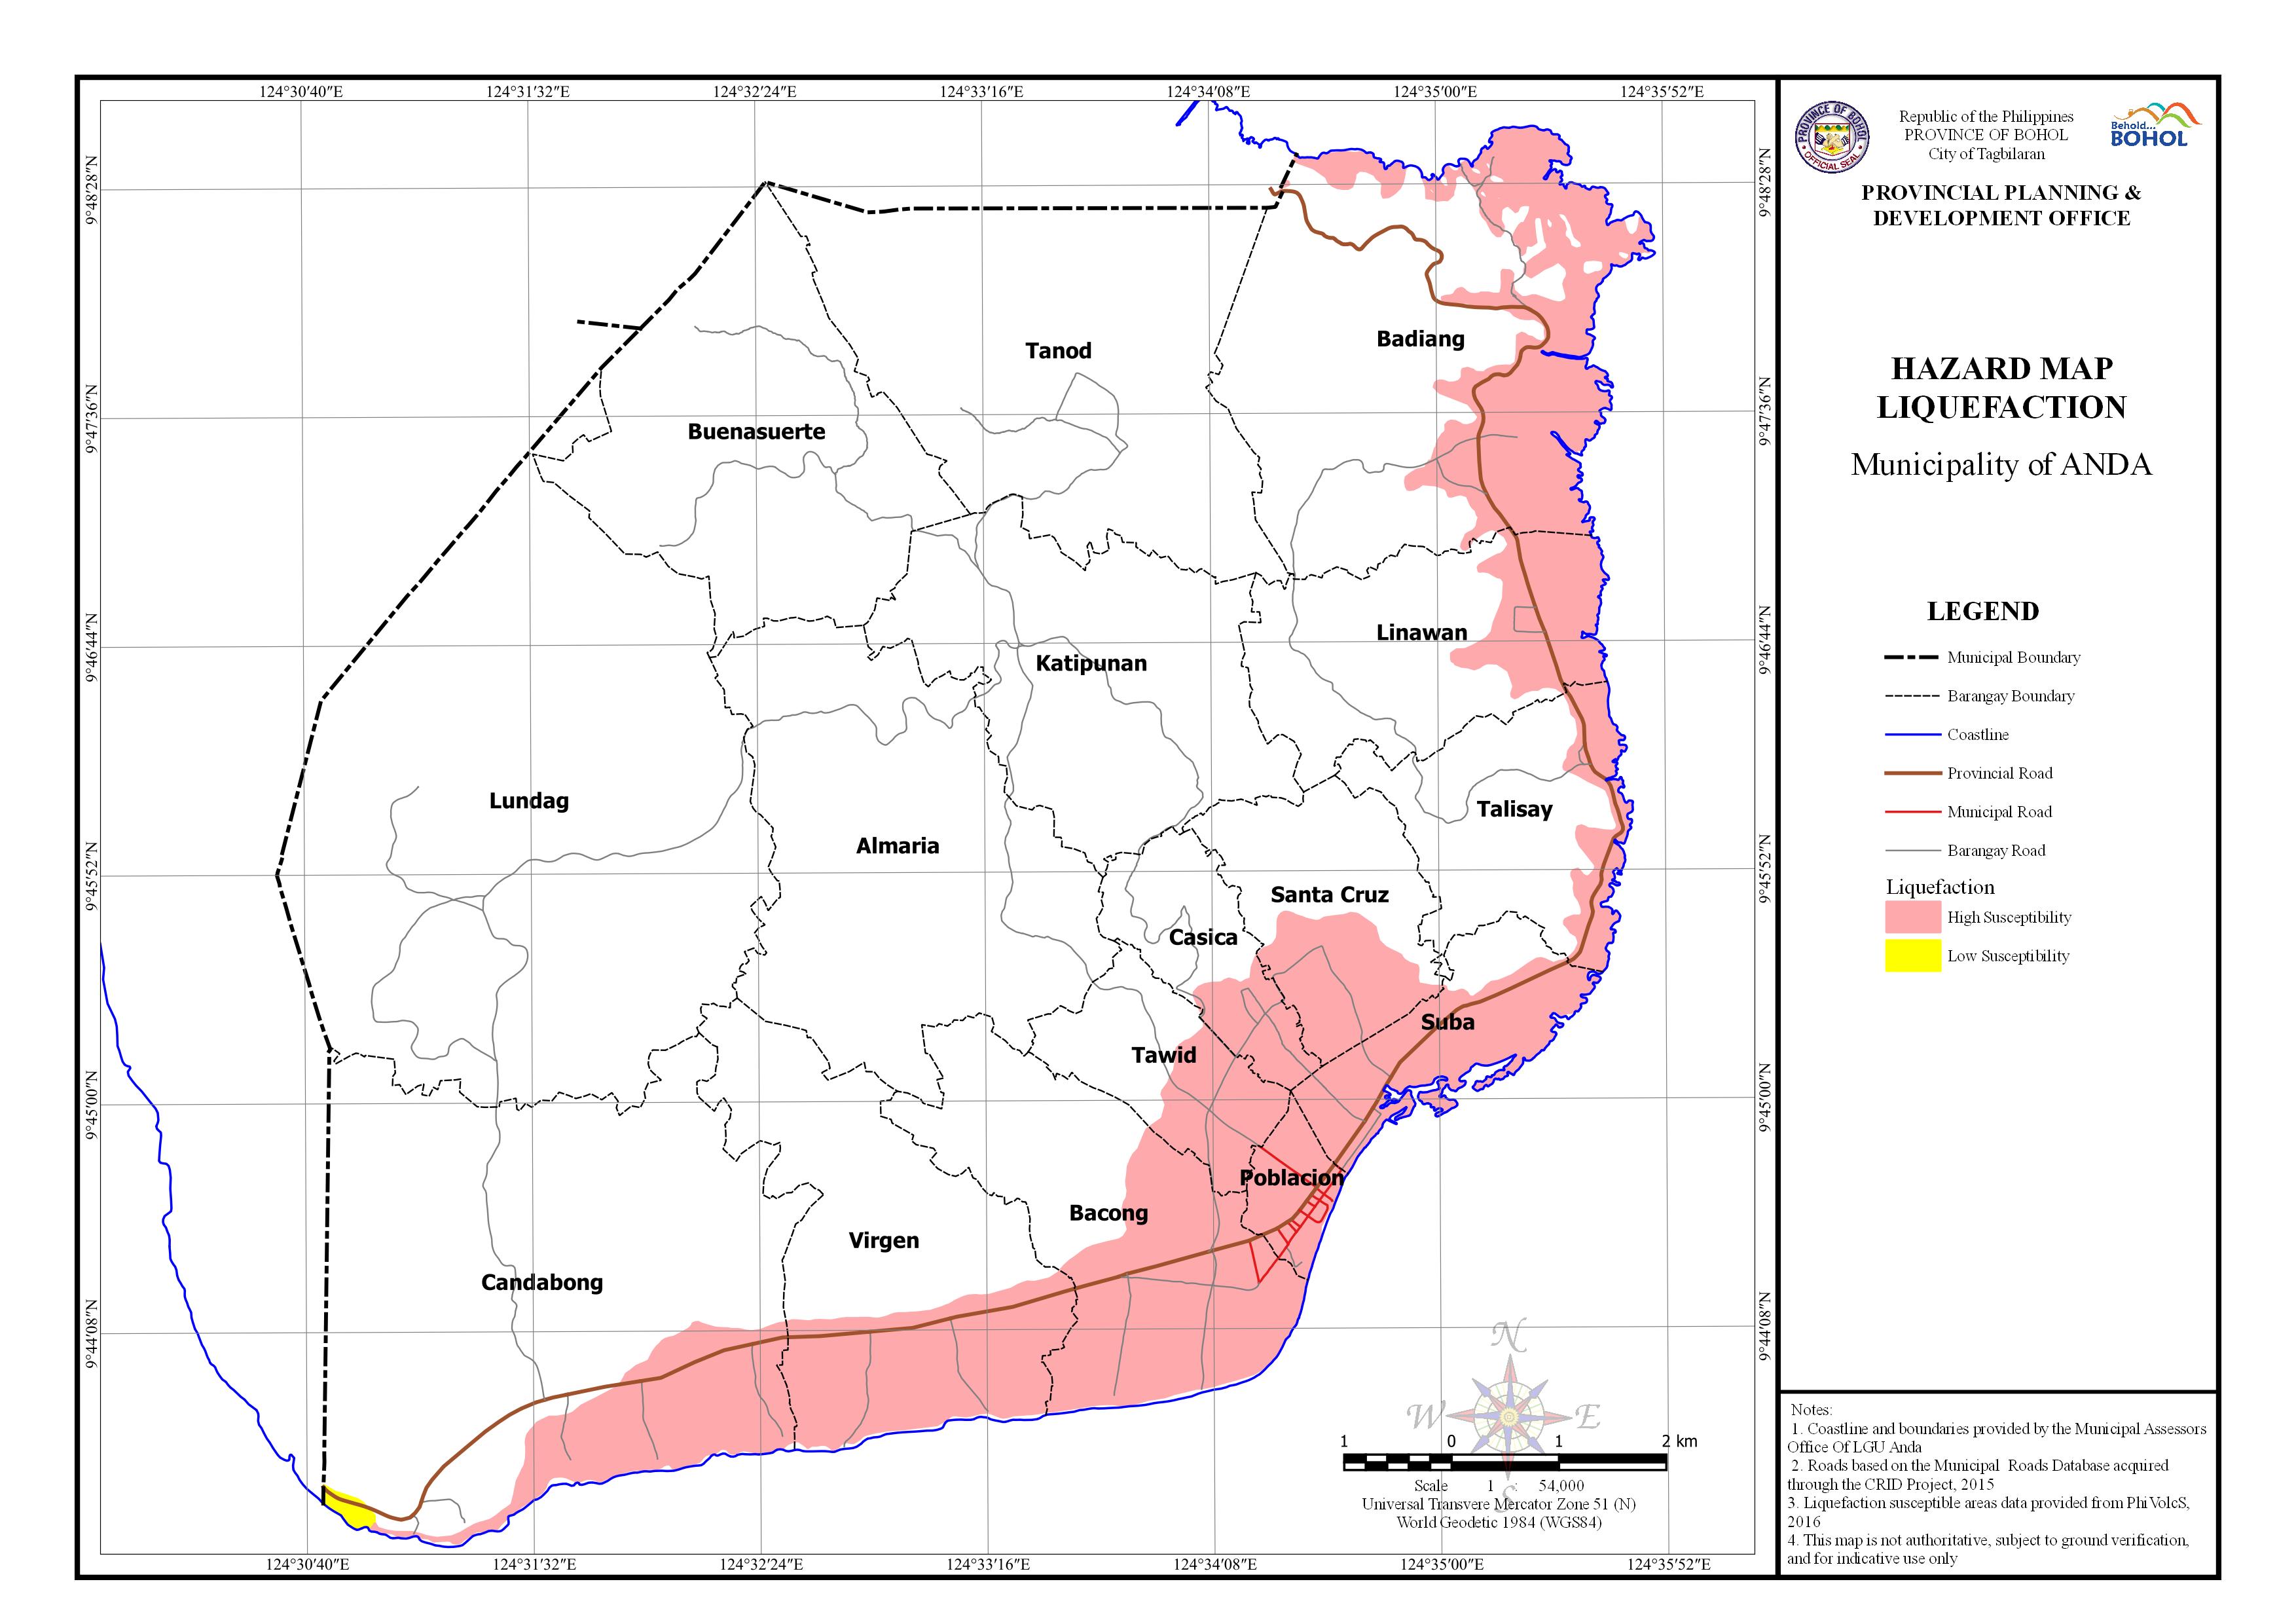
AREA EXPOSED TOI LIQUEFACTION BY BARANGAY
| Barangay | Area | Area Exposed to High Susceptibility | Area Exposed to Low Susceptibility | ||
| (Hectares) | (Hectares) | Percentage | (Hectares) | Percentage | |
| Almaria | 586.18 | ||||
| Bacong | 384.549 | 212.958 | 55.379% | ||
| Badiang | 681.255 | 230.552 | 33.842% | ||
| Buenasuerte | 483.765 | ||||
| Candabong | 913.208 | 140.841 | 15.423% | 5.76 | 0.631% |
| Casica | 127.206 | 41.09 | 32.302% | ||
| Katipunan | 437.769 | ||||
| Linawan | 308.36 | 82.172 | 26.648% | ||
| Lundag | 1114.256 | ||||
| Poblacion | 51.421 | 50.948 | 99.081% | ||
| Santa Cruz | 211.921 | 77.185 | 36.422% | ||
| Suba | 150.647 | 123.494 | 81.976% | ||
| Talisay | 242.032 | 51.009 | 21.076% | ||
| Tanod | 611.43 | ||||
| Tawid | 142.246 | 63.653 | 44.749% | ||
| Virgen | 438.871 | 162.855 | 37.108% | ||
| Total | 6885.115 | 1236.758 | 17.963% | 5.76 | 0.084% |