
Download in PDF and JPG format
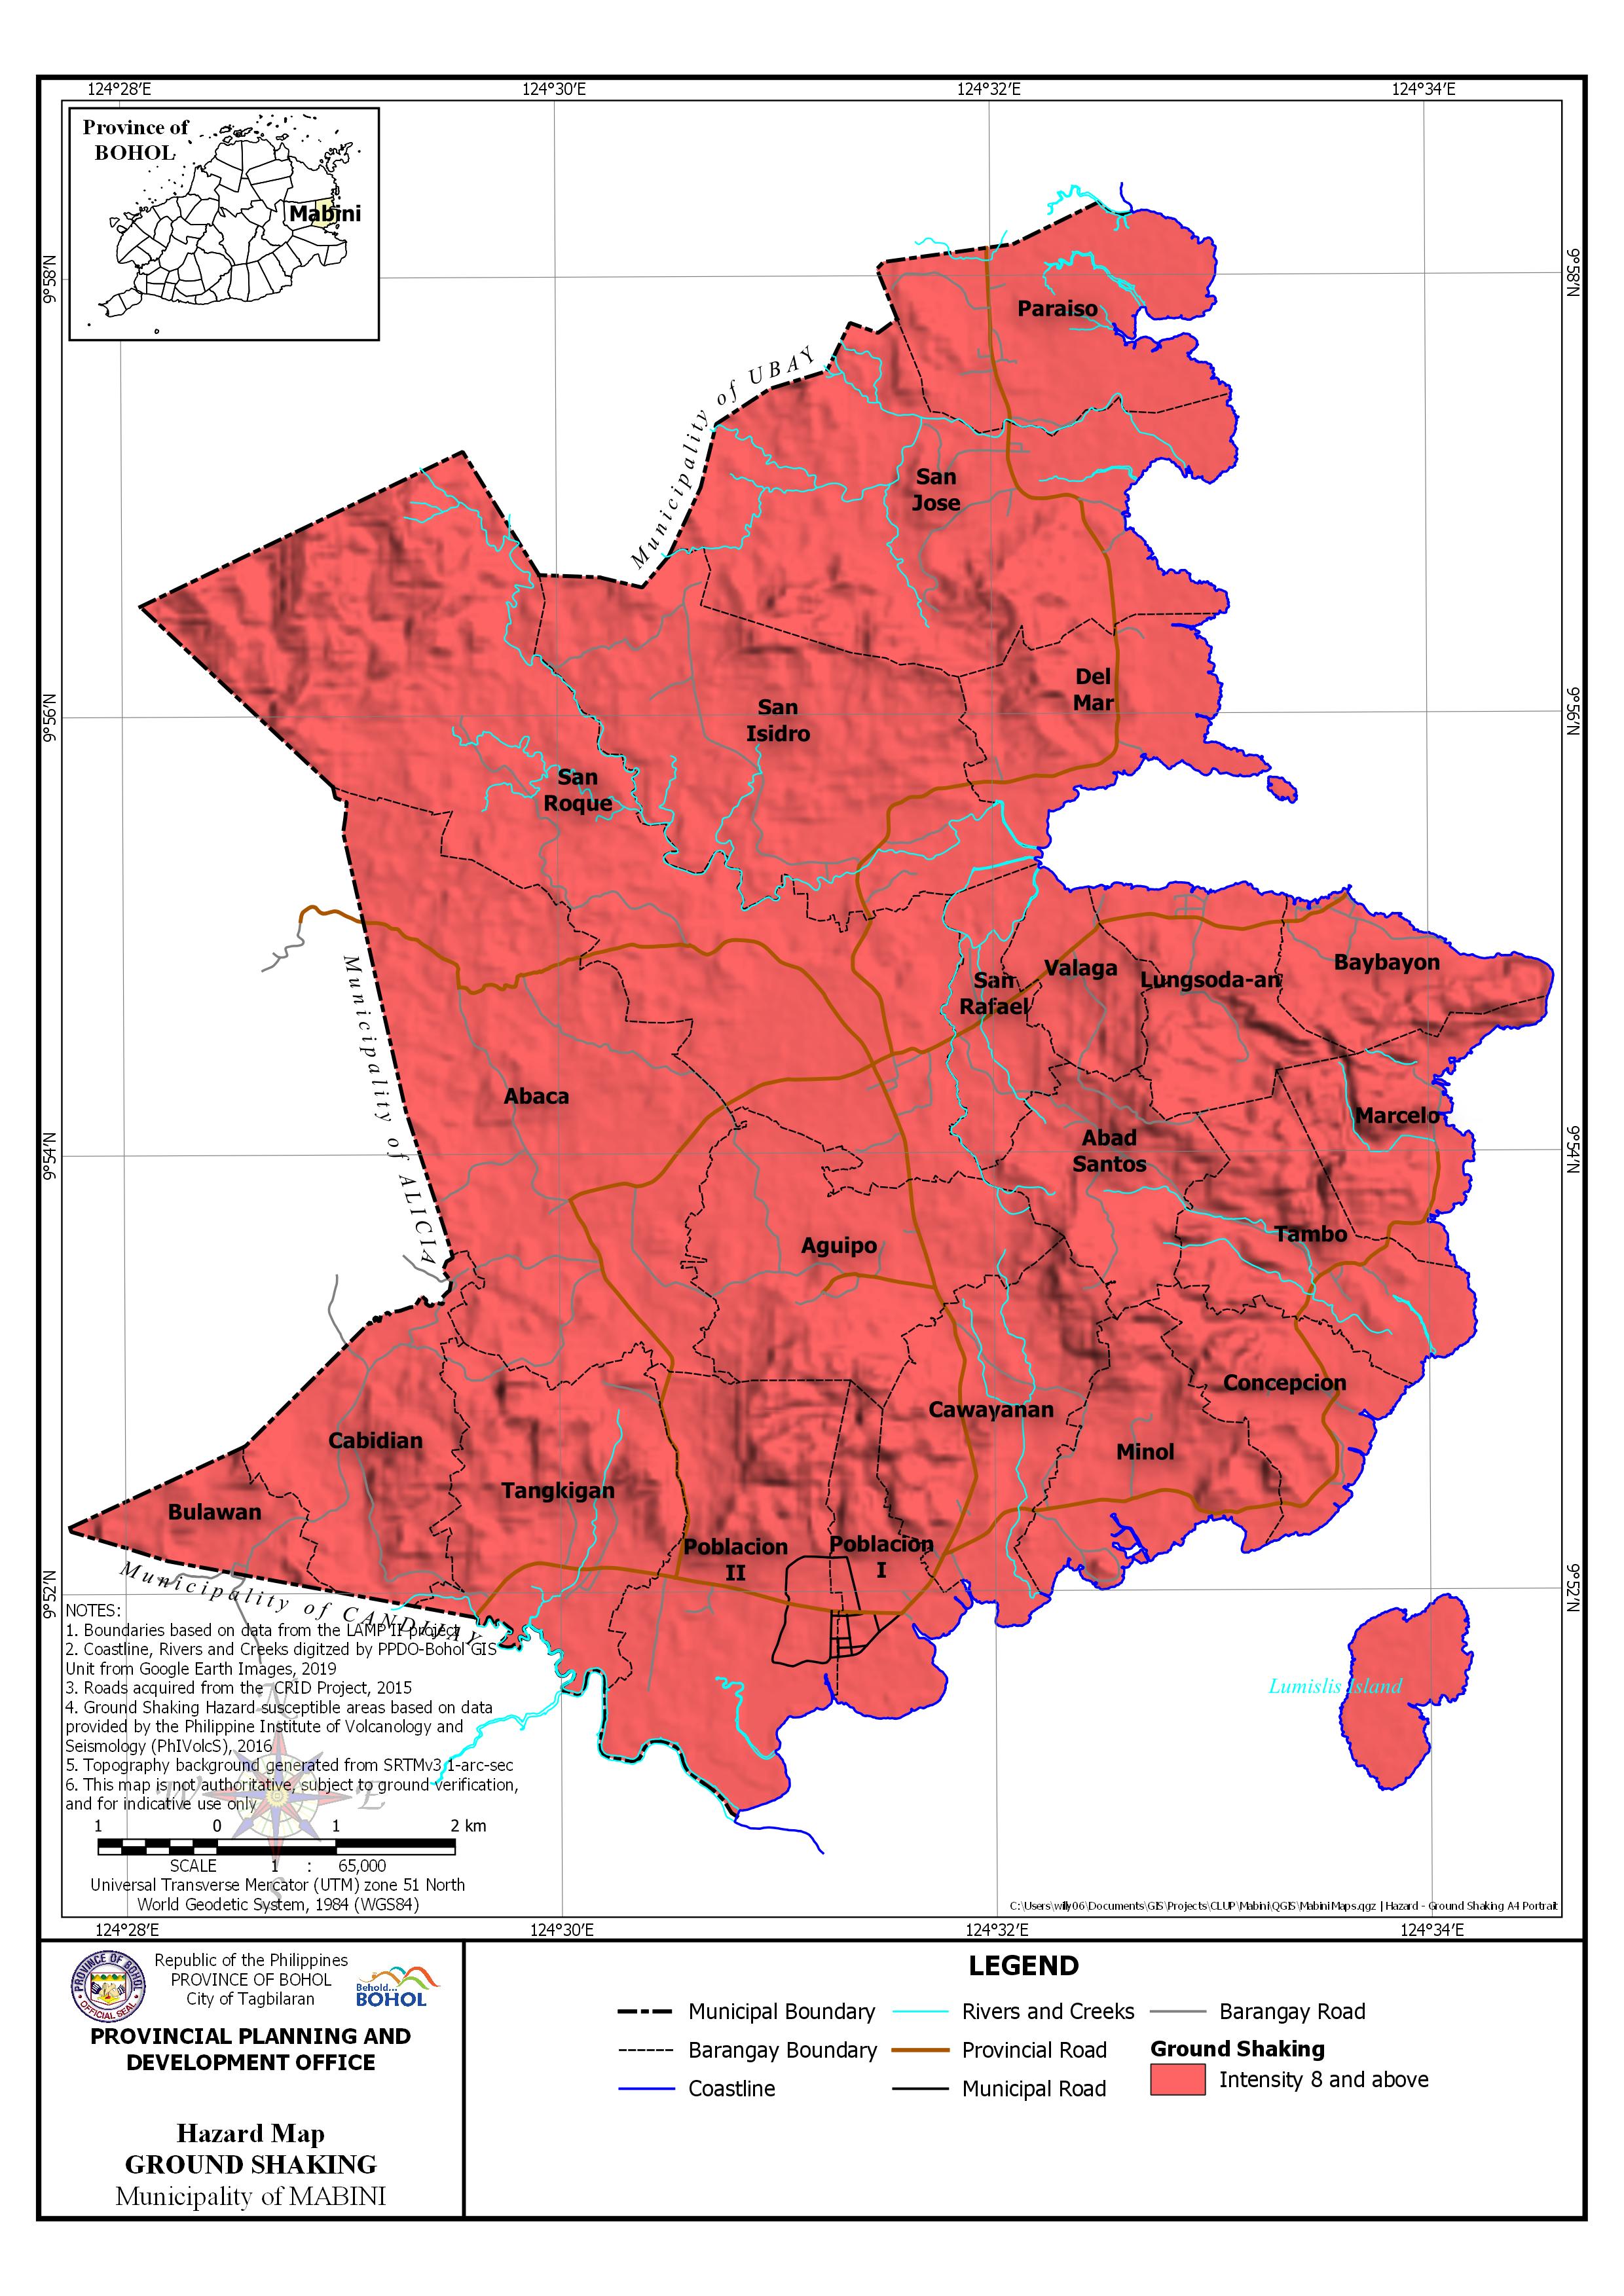
AREA EXPOSED TO GROUND SHAKING HAZARD PER BARANGAY
| Barangay | Area | Barangay Area Exposed to Intensity 8 and above | |
| Hectares | Hectares | Percentage | |
| Abaca | 944.471 | 944.471 | 100.00% |
| Abad Santos | 232.914 | 232.914 | 100.00% |
| Aguipo | 442.045 | 442.045 | 100.00% |
| Baybayon | 185.445 | 185.445 | 100.00% |
| Bulawan | 126.765 | 126.765 | 100.00% |
| Cabidian | 313.637 | 313.637 | 100.00% |
| Cawayanan | 377.966 | 377.966 | 100.00% |
| Concepcion | 219.29 | 219.29 | 100.00% |
| Del Mar | 286.973 | 286.973 | 100.00% |
| Lungsoda-an | 241.967 | 241.967 | 100.00% |
| Marcelo | 218.321 | 218.321 | 100.00% |
| Minol | 284.162 | 284.162 | 100.00% |
| Paraiso | 388.851 | 388.851 | 100.00% |
| Poblacion I | 181.389 | 181.389 | 100.00% |
| Poblacion II | 519.893 | 519.893 | 100.00% |
| San Isidro | 733.392 | 733.392 | 100.00% |
| San Jose | 834.795 | 834.795 | 100.00% |
| San Rafael | 149.486 | 149.486 | 100.00% |
| San Roque | 1,376.05 | 1,376.05 | 100.00% |
| Tambo | 303.148 | 303.148 | 100.00% |
| Tangkigan | 423.821 | 423.821 | 100.00% |
| Valaga | 135.718 | 135.718 | 100.00% |
| Sub-Total | 8,920.49 | 8,920.49 | 100.00% |
| Lumislis Island | 114.701 | 114.701 | 100.00% |
| TOTAL | 9,035.19 | 9,035.19 | 100.00% |