
Download in PDF and JPG format
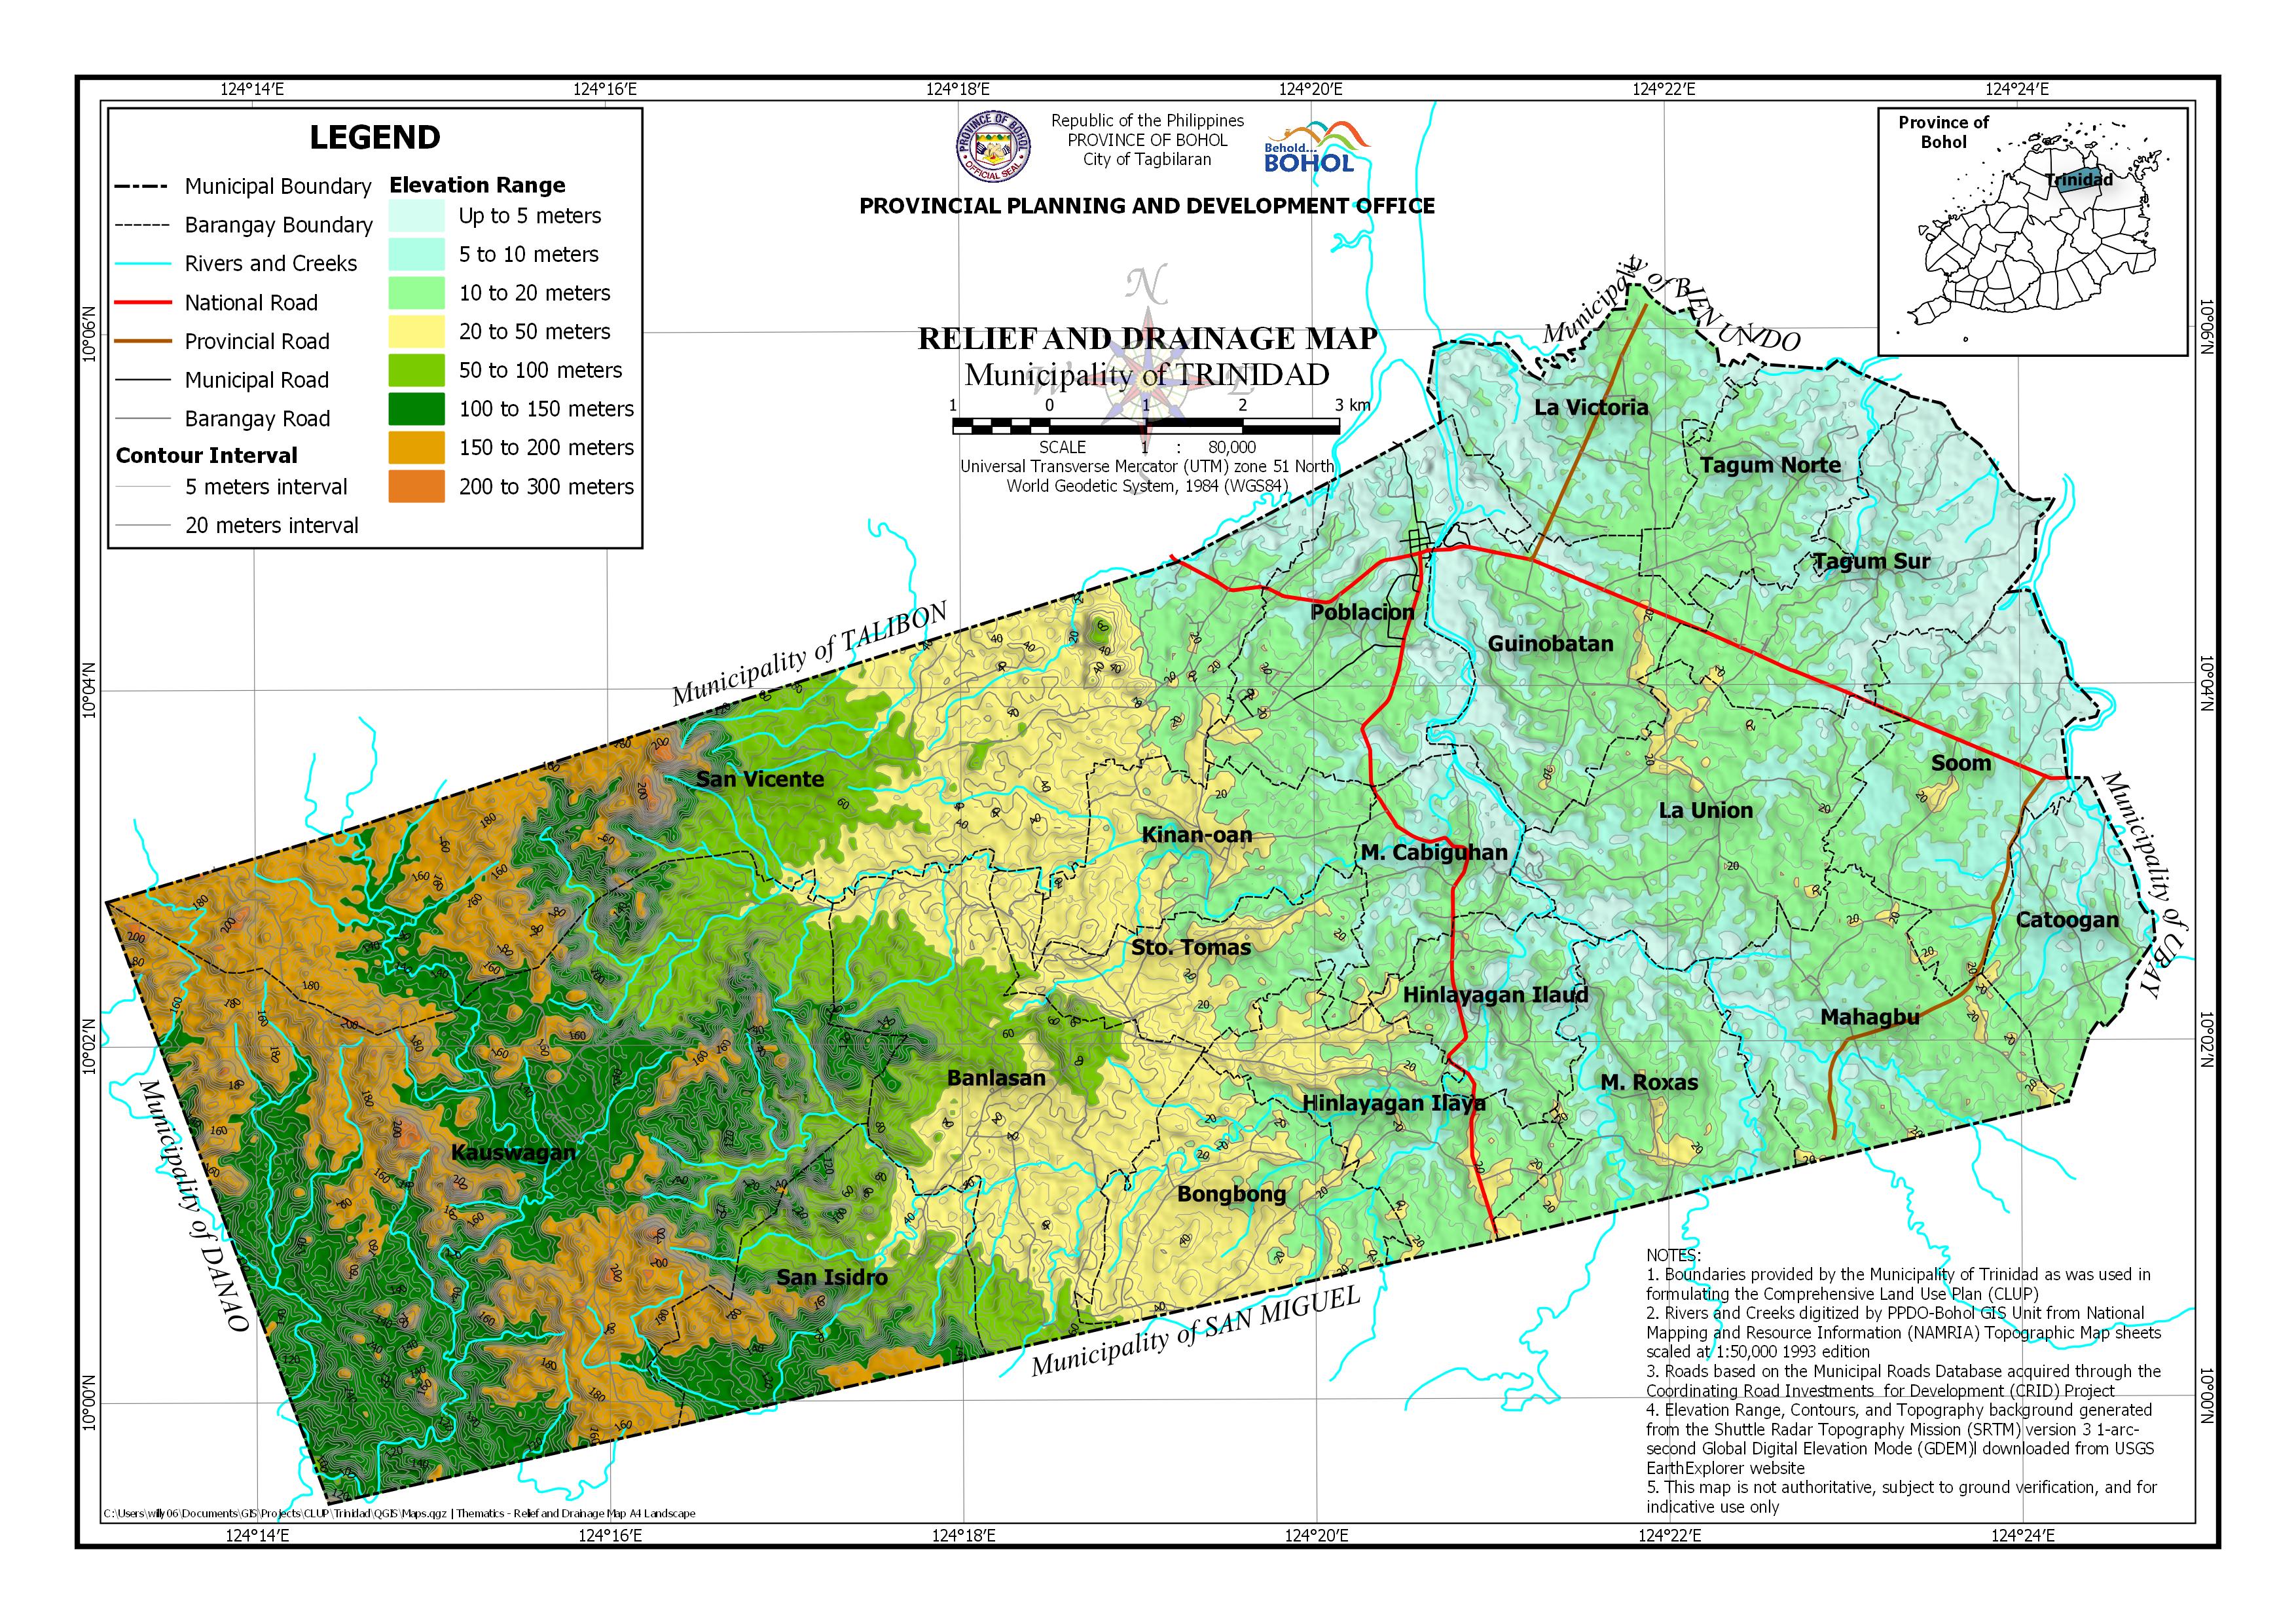
AREA PER ELEVATION RANGE BY BARANGAY
| Barangay | Area | Up to 5 meters | 5 to 10 meters | 10 to 20 meters | 20 to 50 meters | 50 to 100 meters | 100 to 150 meters | 150 to 200 meters | Over 200 meters | ||||||||
| (Hectares) | (Hectares) | (Percentage) | (Hectares) | (Percentage) | (Hectares) | (Percentage) | (Hectares) | (Percentage) | (Hectares) | (Percentage) | (Hectares) | (Percentage) | (Hectares) | (Percentage) | (Hectares) | (Percentage) | |
| Banlasan | 988.739 | 571.285 | 57.78% | 384.939 | 38.93% | 32.488 | 3.29% | 0.026 | 0.00% | ||||||||
| Bongbong | 540.748 | 147.415 | 27.26% | 390.378 | 72.19% | 2.956 | 0.55% | ||||||||||
| Catoogan | 335.1 | 70.355 | 21.00% | 143.282 | 42.76% | 118.015 | 35.22% | 3.448 | 1.03% | ||||||||
| Guinobatan | 563.906 | 112.009 | 19.86% | 134.593 | 23.87% | 303.672 | 53.85% | 13.632 | 2.42% | ||||||||
| Hinlayagan Ilaud | 306.645 | 25.128 | 8.19% | 101.111 | 32.97% | 172.7 | 56.32% | 7.705 | 2.51% | ||||||||
| Hinlayagan Ilaya | 486.672 | 0.165 | 0.03% | 40.009 | 8.22% | 308.811 | 63.45% | 137.686 | 28.29% | ||||||||
| Kauswagan | 3,091.78 | 15.803 | 0.51% | 401.16 | 12.98% | 1,682.04 | 54.40% | 973.905 | 31.50% | 18.873 | 0.61% | ||||||
| Kinan-oan | 439.893 | 14.994 | 3.41% | 193.602 | 44.01% | 231.297 | 52.58% | ||||||||||
| La Union | 724.351 | 54.454 | 7.52% | 188.205 | 25.98% | 452.828 | 62.52% | 28.863 | 3.99% | ||||||||
| La Victoria | 516.037 | 91.525 | 17.74% | 233.171 | 45.19% | 191.33 | 37.08% | 0.011 | 0.00% | ||||||||
| M. Cabiguhan | 306.975 | 58.952 | 19.20% | 117.182 | 38.17% | 128.016 | 41.70% | 2.825 | 0.92% | ||||||||
| M. Roxas | 512.497 | 31.227 | 6.09% | 185.444 | 36.18% | 265.459 | 51.80% | 30.367 | 5.93% | ||||||||
| Mahagbu | 627.355 | 37.204 | 5.93% | 168.956 | 26.93% | 398.664 | 63.55% | 22.532 | 3.59% | ||||||||
| Poblacion | 671.786 | 162.256 | 24.15% | 171.812 | 25.58% | 324.759 | 48.34% | 12.959 | 1.93% | ||||||||
| San Isidro | 620.653 | 63.313 | 10.20% | 237.086 | 38.20% | 229.297 | 36.94% | 90.914 | 14.65% | 0.043 | 0.01% | ||||||
| San Vicente | 2,233.06 | 26.559 | 1.19% | 49.971 | 2.24% | 174.494 | 7.81% | 697.33 | 31.23% | 341.773 | 15.31% | 305.152 | 13.67% | 622.854 | 27.89% | 14.929 | 0.67% |
| Soom | 616.046 | 129.025 | 20.94% | 250.133 | 40.60% | 226.601 | 36.78% | 10.288 | 1.67% | ||||||||
| Sto. Tomas | 401.716 | 0.132 | 0.03% | 17.052 | 4.25% | 129.476 | 32.23% | 240.133 | 59.78% | 14.923 | 3.72% | ||||||
| Tagum Norte | 392.375 | 92.525 | 23.58% | 135.078 | 34.43% | 164.772 | 41.99% | 0.001 | 0.00% | ||||||||
| Tagum Sur | 613.829 | 234.372 | 38.18% | 213.599 | 34.80% | 163.562 | 26.65% | 2.298 | 0.37% | ||||||||
| Total | 14,990.16 | 1,125.89 | 7.51% | 2,164.59 | 14.44% | 3,864.18 | 25.78% | 2,482.15 | 16.56% | 1,382.84 | 9.23% | 2,248.98 | 15.00% | 1,687.70 | 11.26% | 33.845 | 0.23% |