
Download in PDF and JPG format
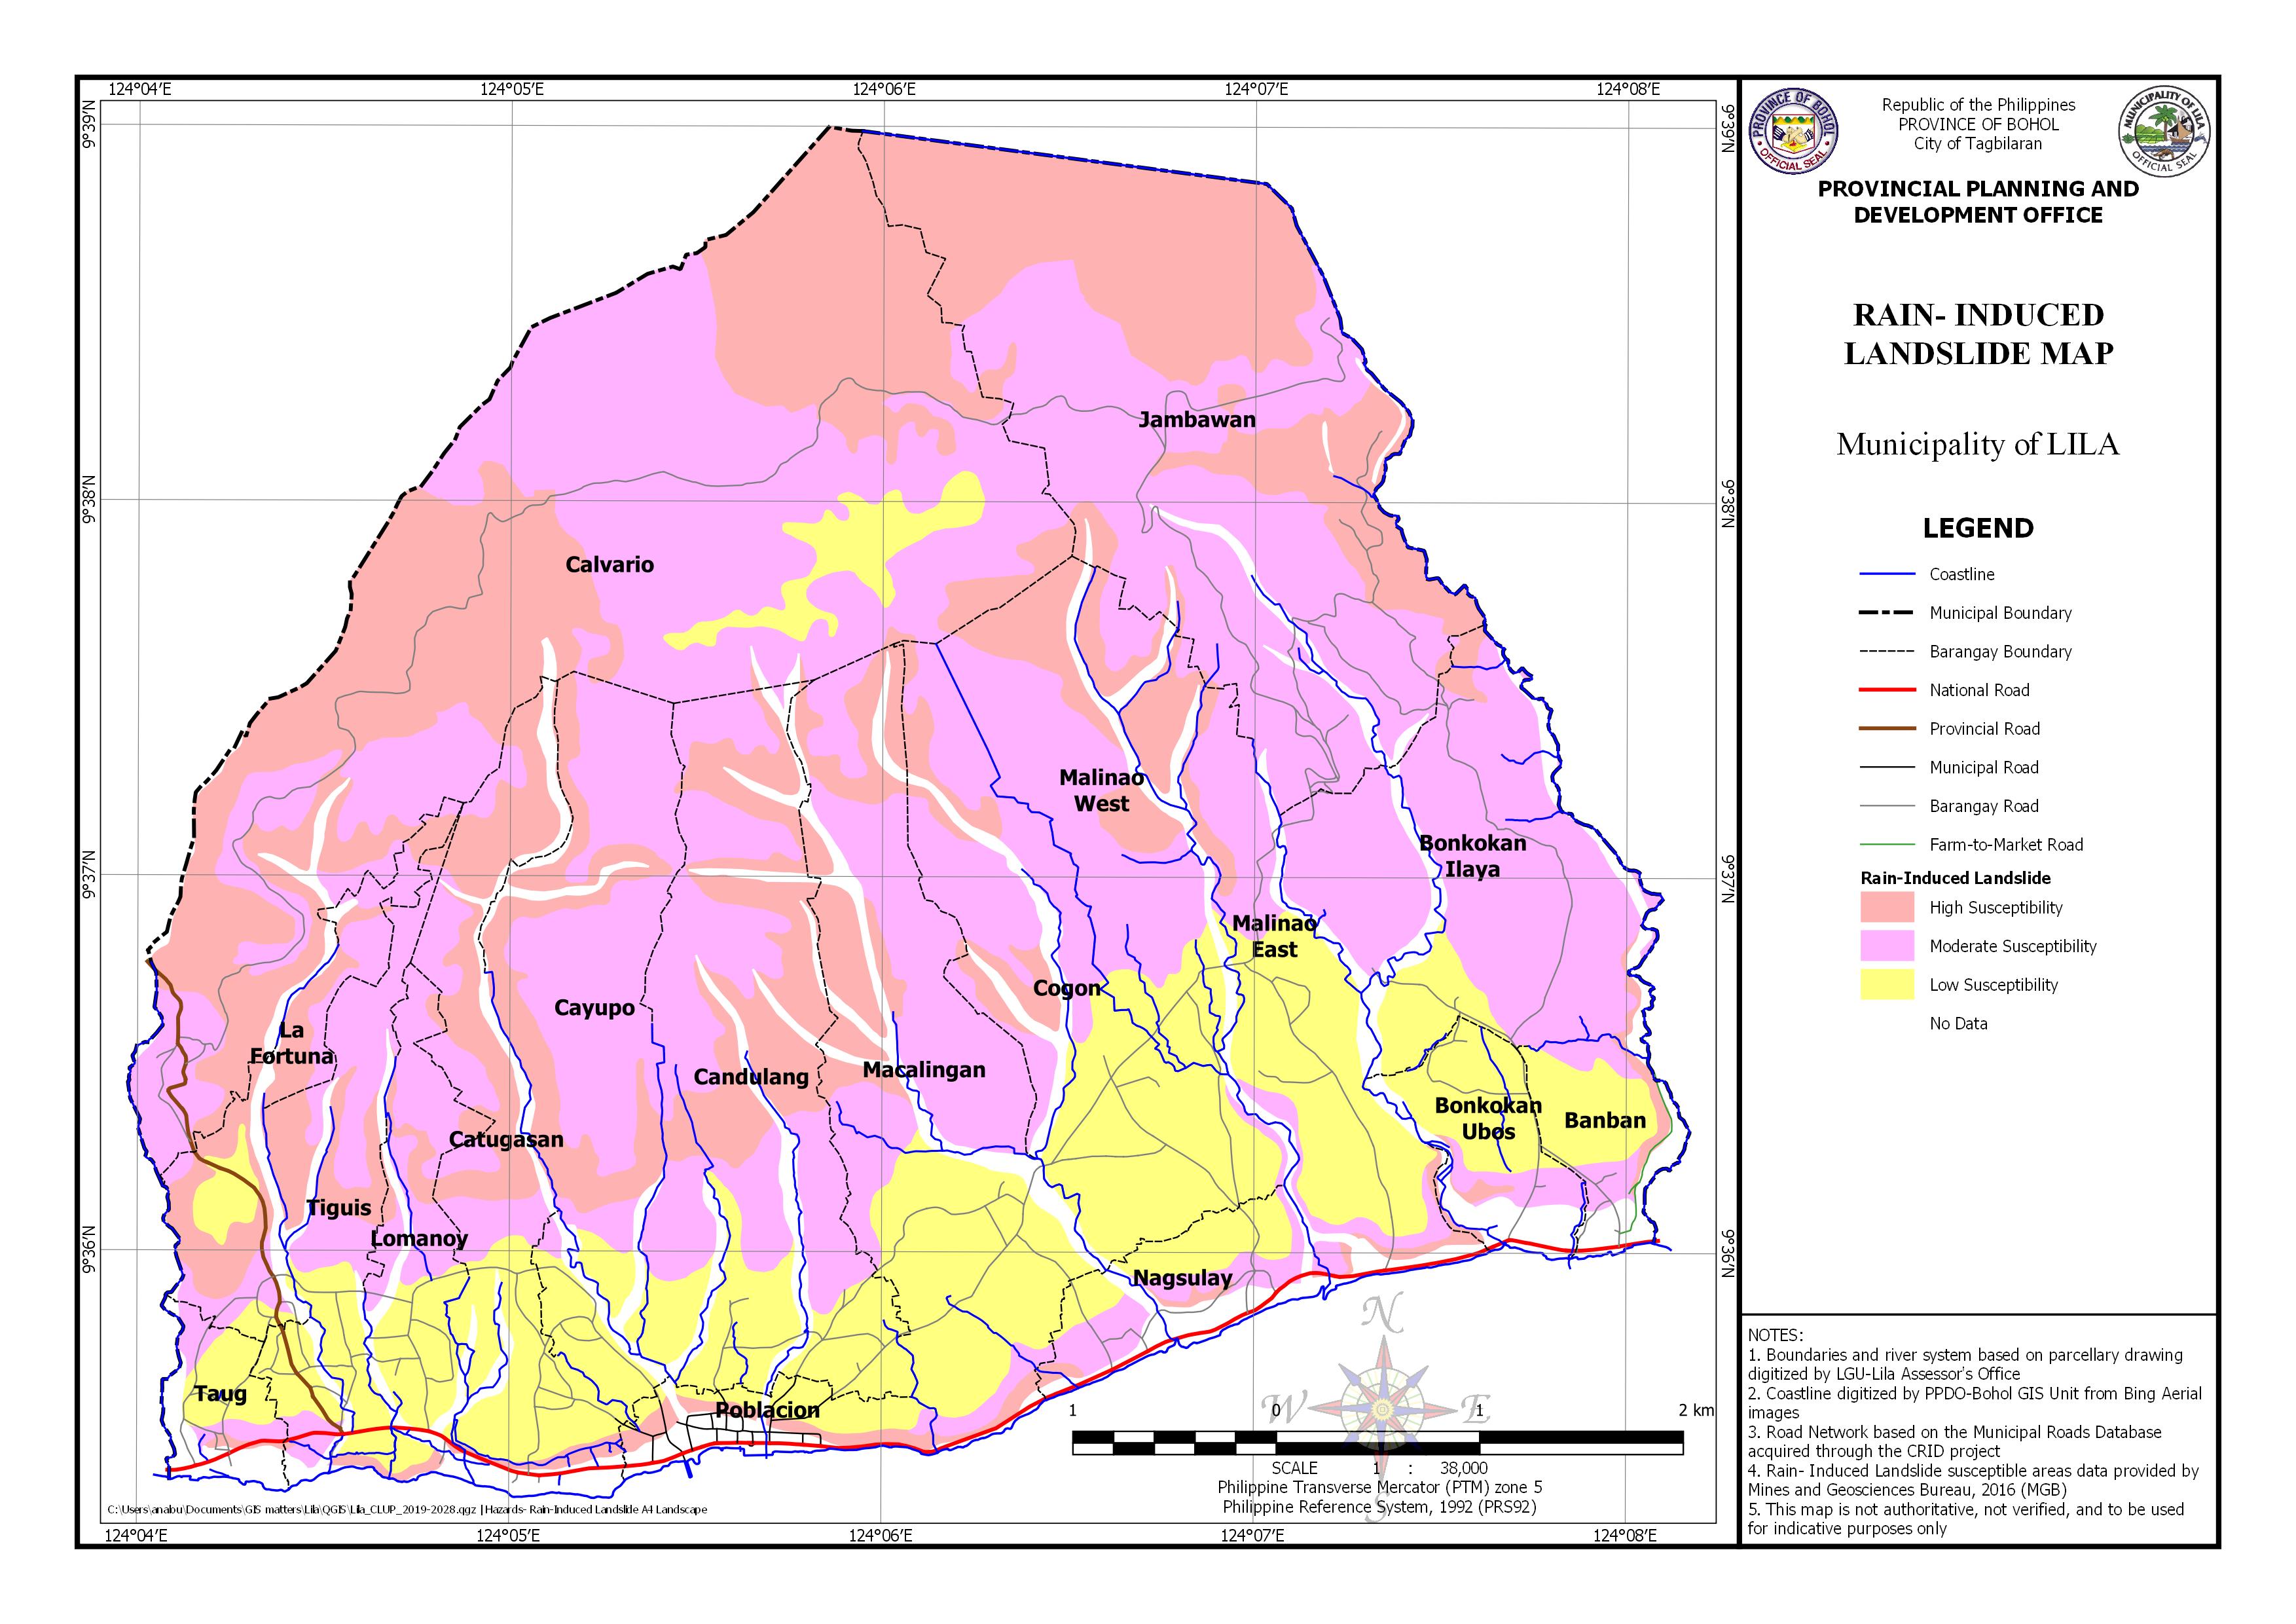
AREA EXPOSED TO RAIN-INDUCED LANDSLIDE BY BARANGAY
| Barangay | Area | Area Exposed to High Susceptibility | Area Exposed to Low Susceptibility | Area Exposed to Moderate Susceptibility | |||
|---|---|---|---|---|---|---|---|
| (Hectares) | (Hectares) | Percentage | (Hectares) | Percentage | (Hectares) | Percentage | |
| Banban | 54.651 | 4.505 | 8.243% | 27.536 | 50.385% | 10.191 | 18.648% |
| Bonkokan Ilaya | 235.481 | 7.658 | 3.252% | 23.376 | 9.927% | 182.510 | 77.505% |
| Bonkokan Ubos | 66.327 | 3.853 | 5.810% | 36.763 | 55.427% | 9.154 | 13.801% |
| Calvario | 806.148 | 369.458 | 45.830% | 37.251 | 4.621% | 389.793 | 48.352% |
| Candulang | 293.490 | 83.978 | 28.614% | 66.391 | 22.621% | 118.878 | 40.505% |
| Catugasan | 171.121 | 60.680 | 35.460% | 51.221 | 29.932% | 34.404 | 20.105% |
| Cayupo | 217.302 | 58.761 | 27.041% | 29.797 | 13.712% | 115.525 | 53.163% |
| Cogon | 207.025 | 25.754 | 12.440% | 89.848 | 43.399% | 75.418 | 36.429% |
| Jambawan | 499.561 | 231.861 | 46.413% | 17.221% | 255.184 | 51.082% | |
| La Fortuna | 90.095 | 40.057 | 44.461% | 15.515 | 26.468 | 29.378% | |
| Lomanoy | 85.477 | 11.983 | 14.019% | 29.282 | 34.258% | 34.200 | 40.011% |
| Macalingan | 283.497 | 57.486 | 20.278% | 92.819 | 32.741% | 108.167 | 38.154% |
| Malinao East | 194.783 | 38.154 | 19.588% | 84.448 | 43.355% | 49.189 | 25.253% |
| Malinao West | 150.937 | 33.707 | 22.332% | 25.408 | 16.833% | 82.260 | 54.500% |
| Nagsulay | 70.907 | 4.599 | 6.486% | 25.986 | 36.649% | 21.248 | 29.966% |
| Poblacion | 47.646 | 11.275 | 23.664% | 19.218 | 40.336% | 0.829 | 1.739% |
| Taug | 39.564 | 2.053 | 5.190% | 16.107 | 40.712% | 7.718 | 19.508% |
| Tiguis | 119.020 | 28.208 | 23.700% | 35.246 | 29.613% | 44.795 | 37.637% |
| Total | 3633.033 | 1074.031 | 392.821% | 706.211 | 521.742% | 1565.931 | 635.738% |