
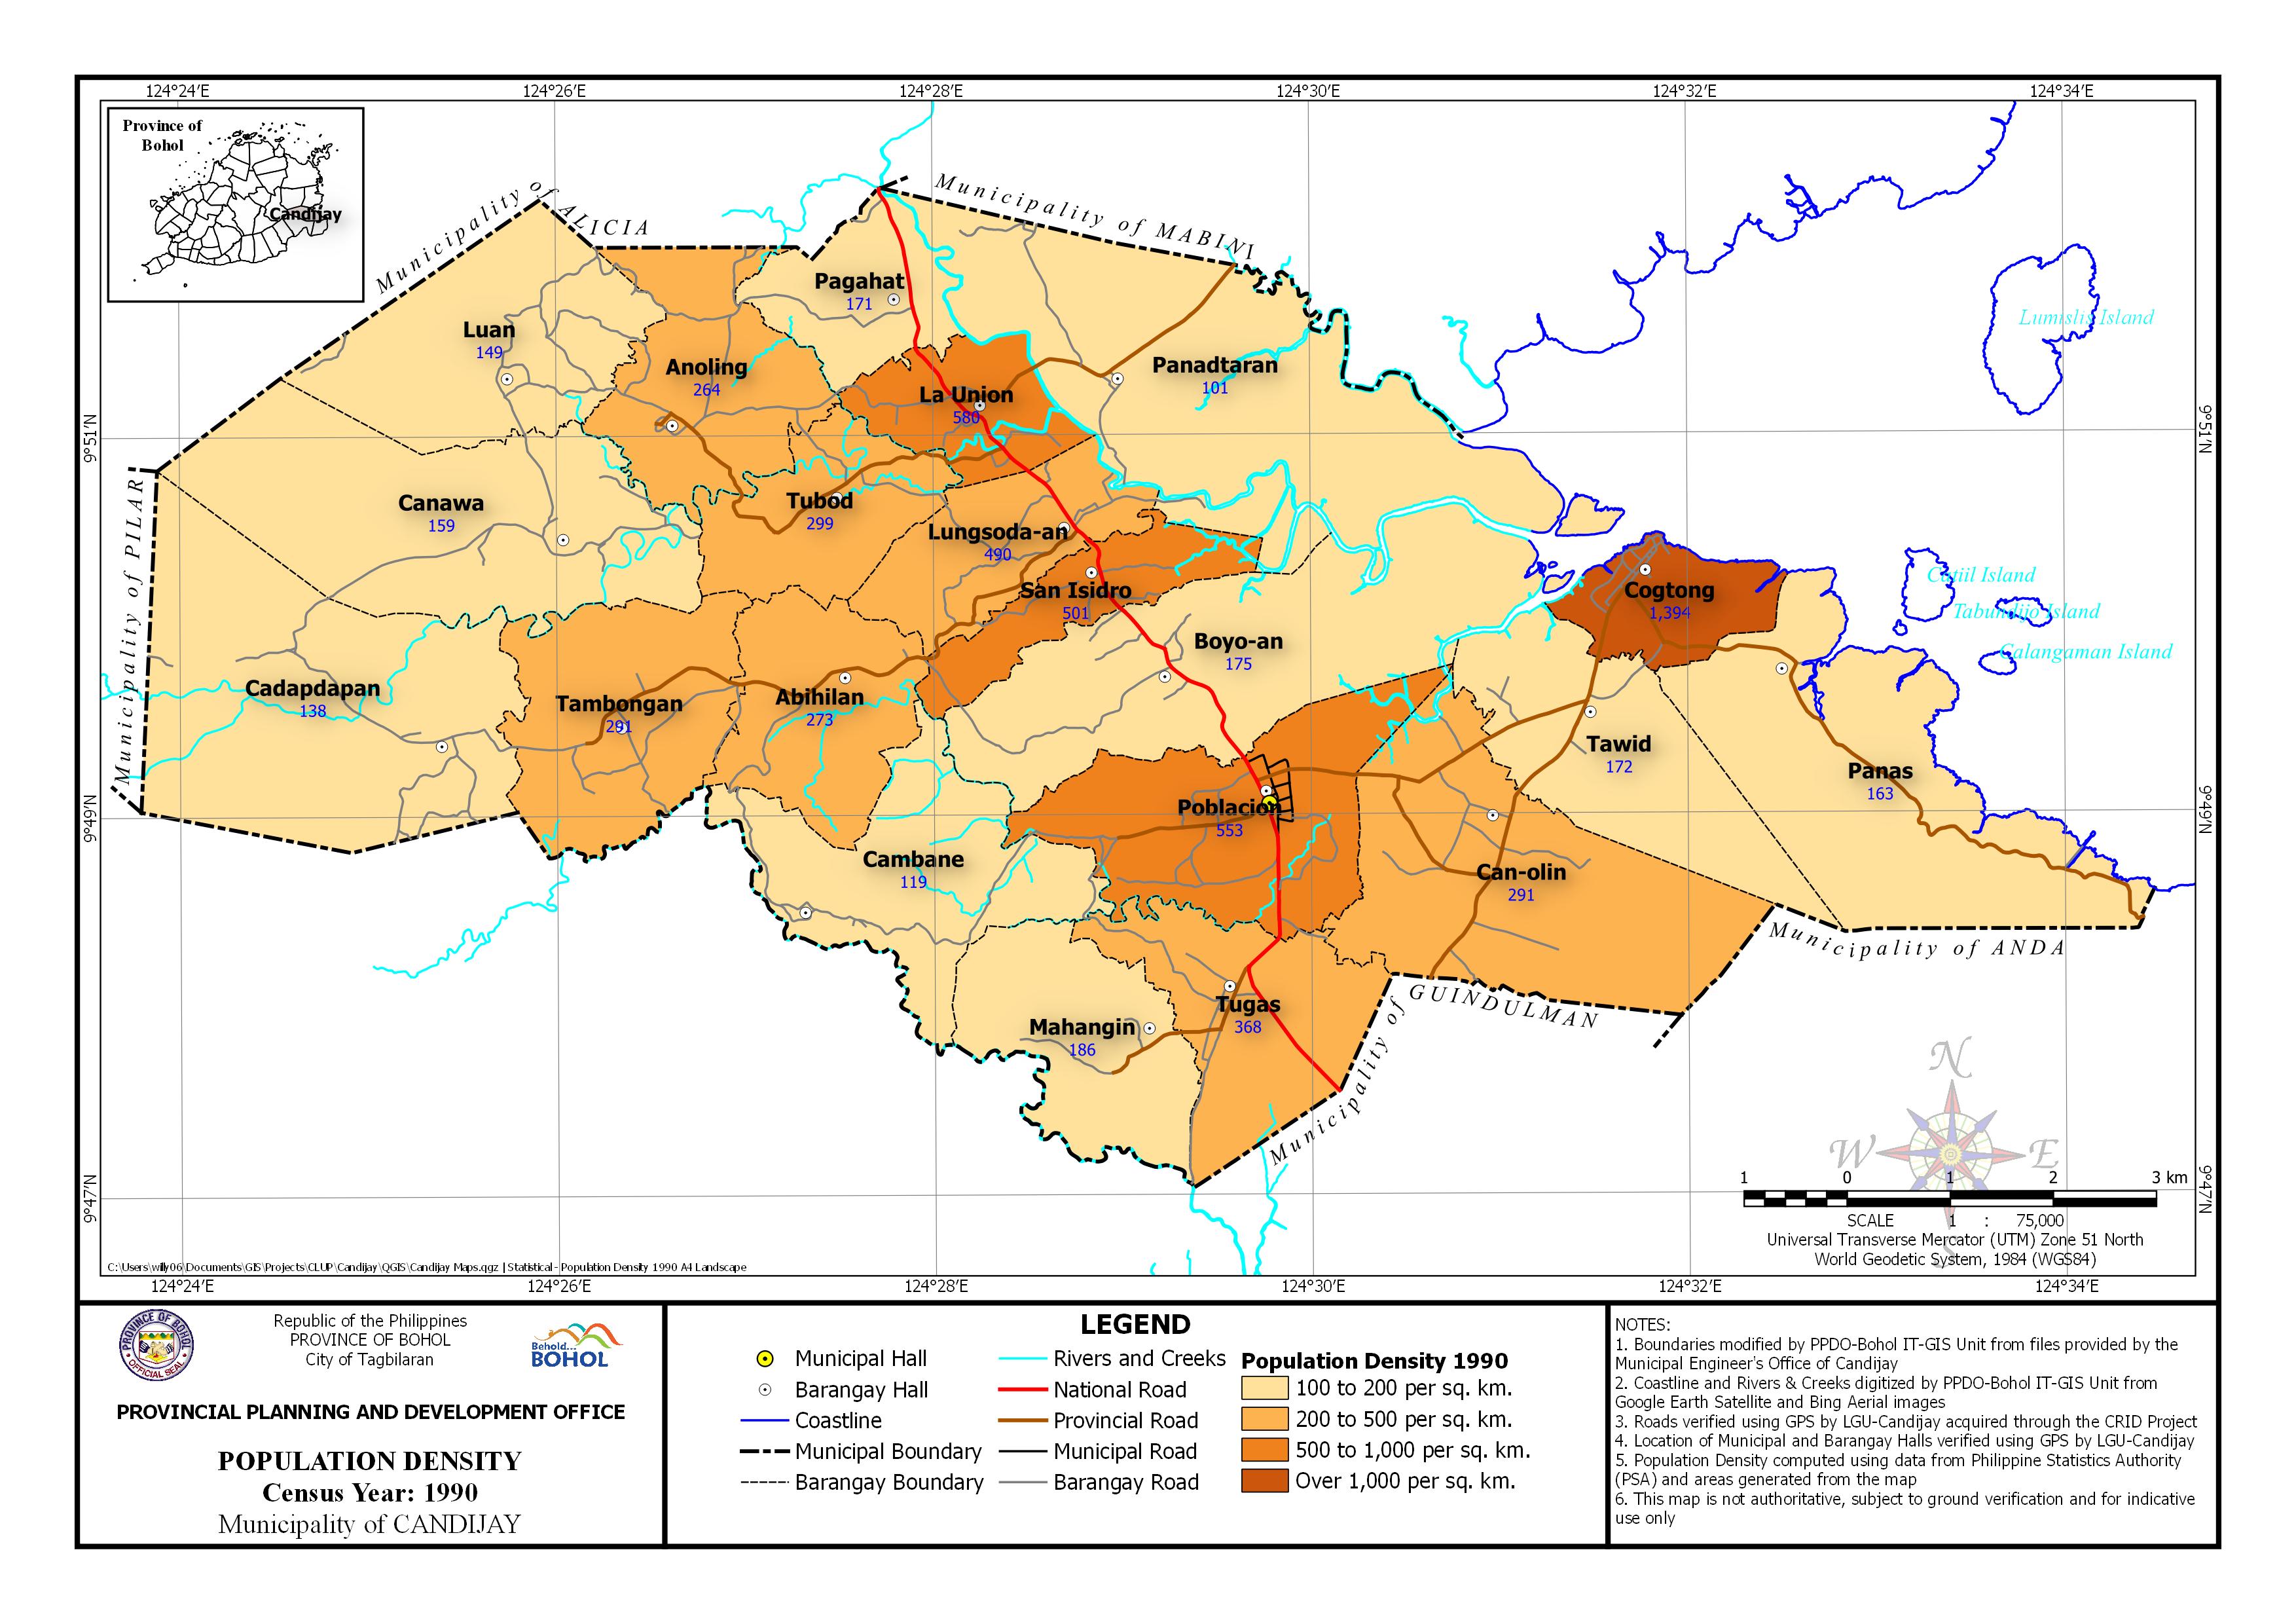
 | Census Year: 1990 Download in PDF and JPG format |
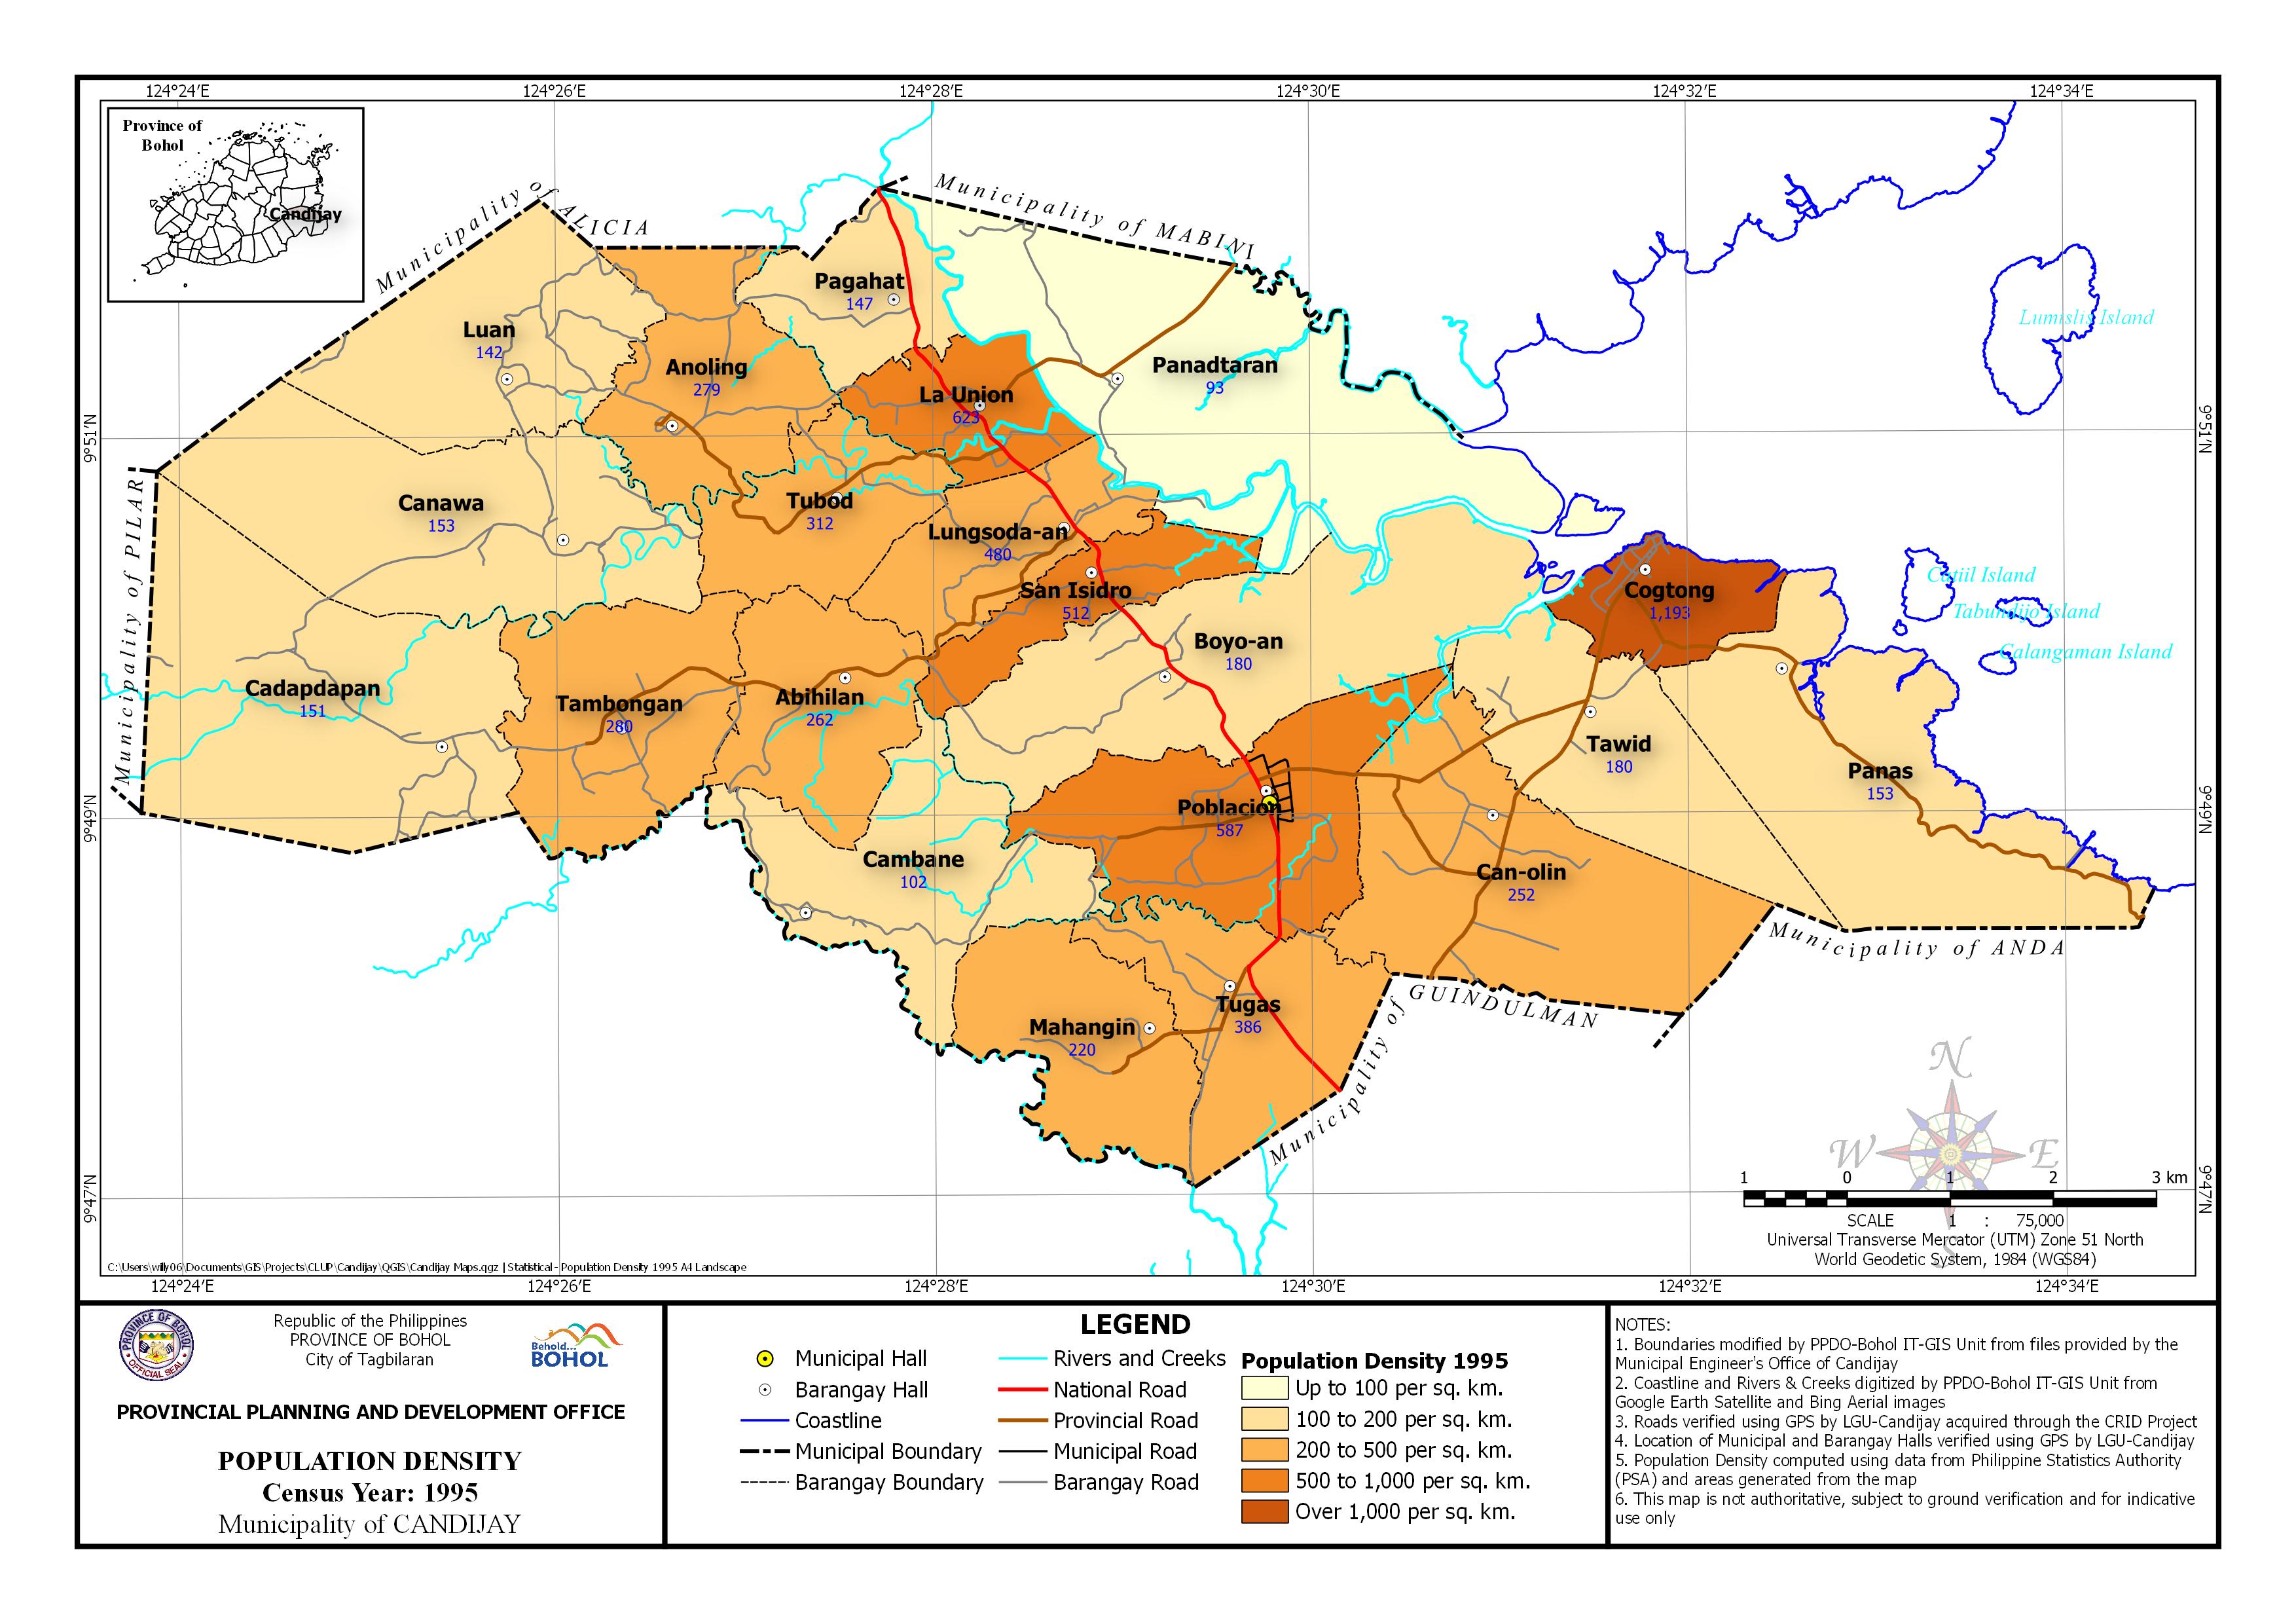 | Census Year: 1995 Download in PDF and JPG format |
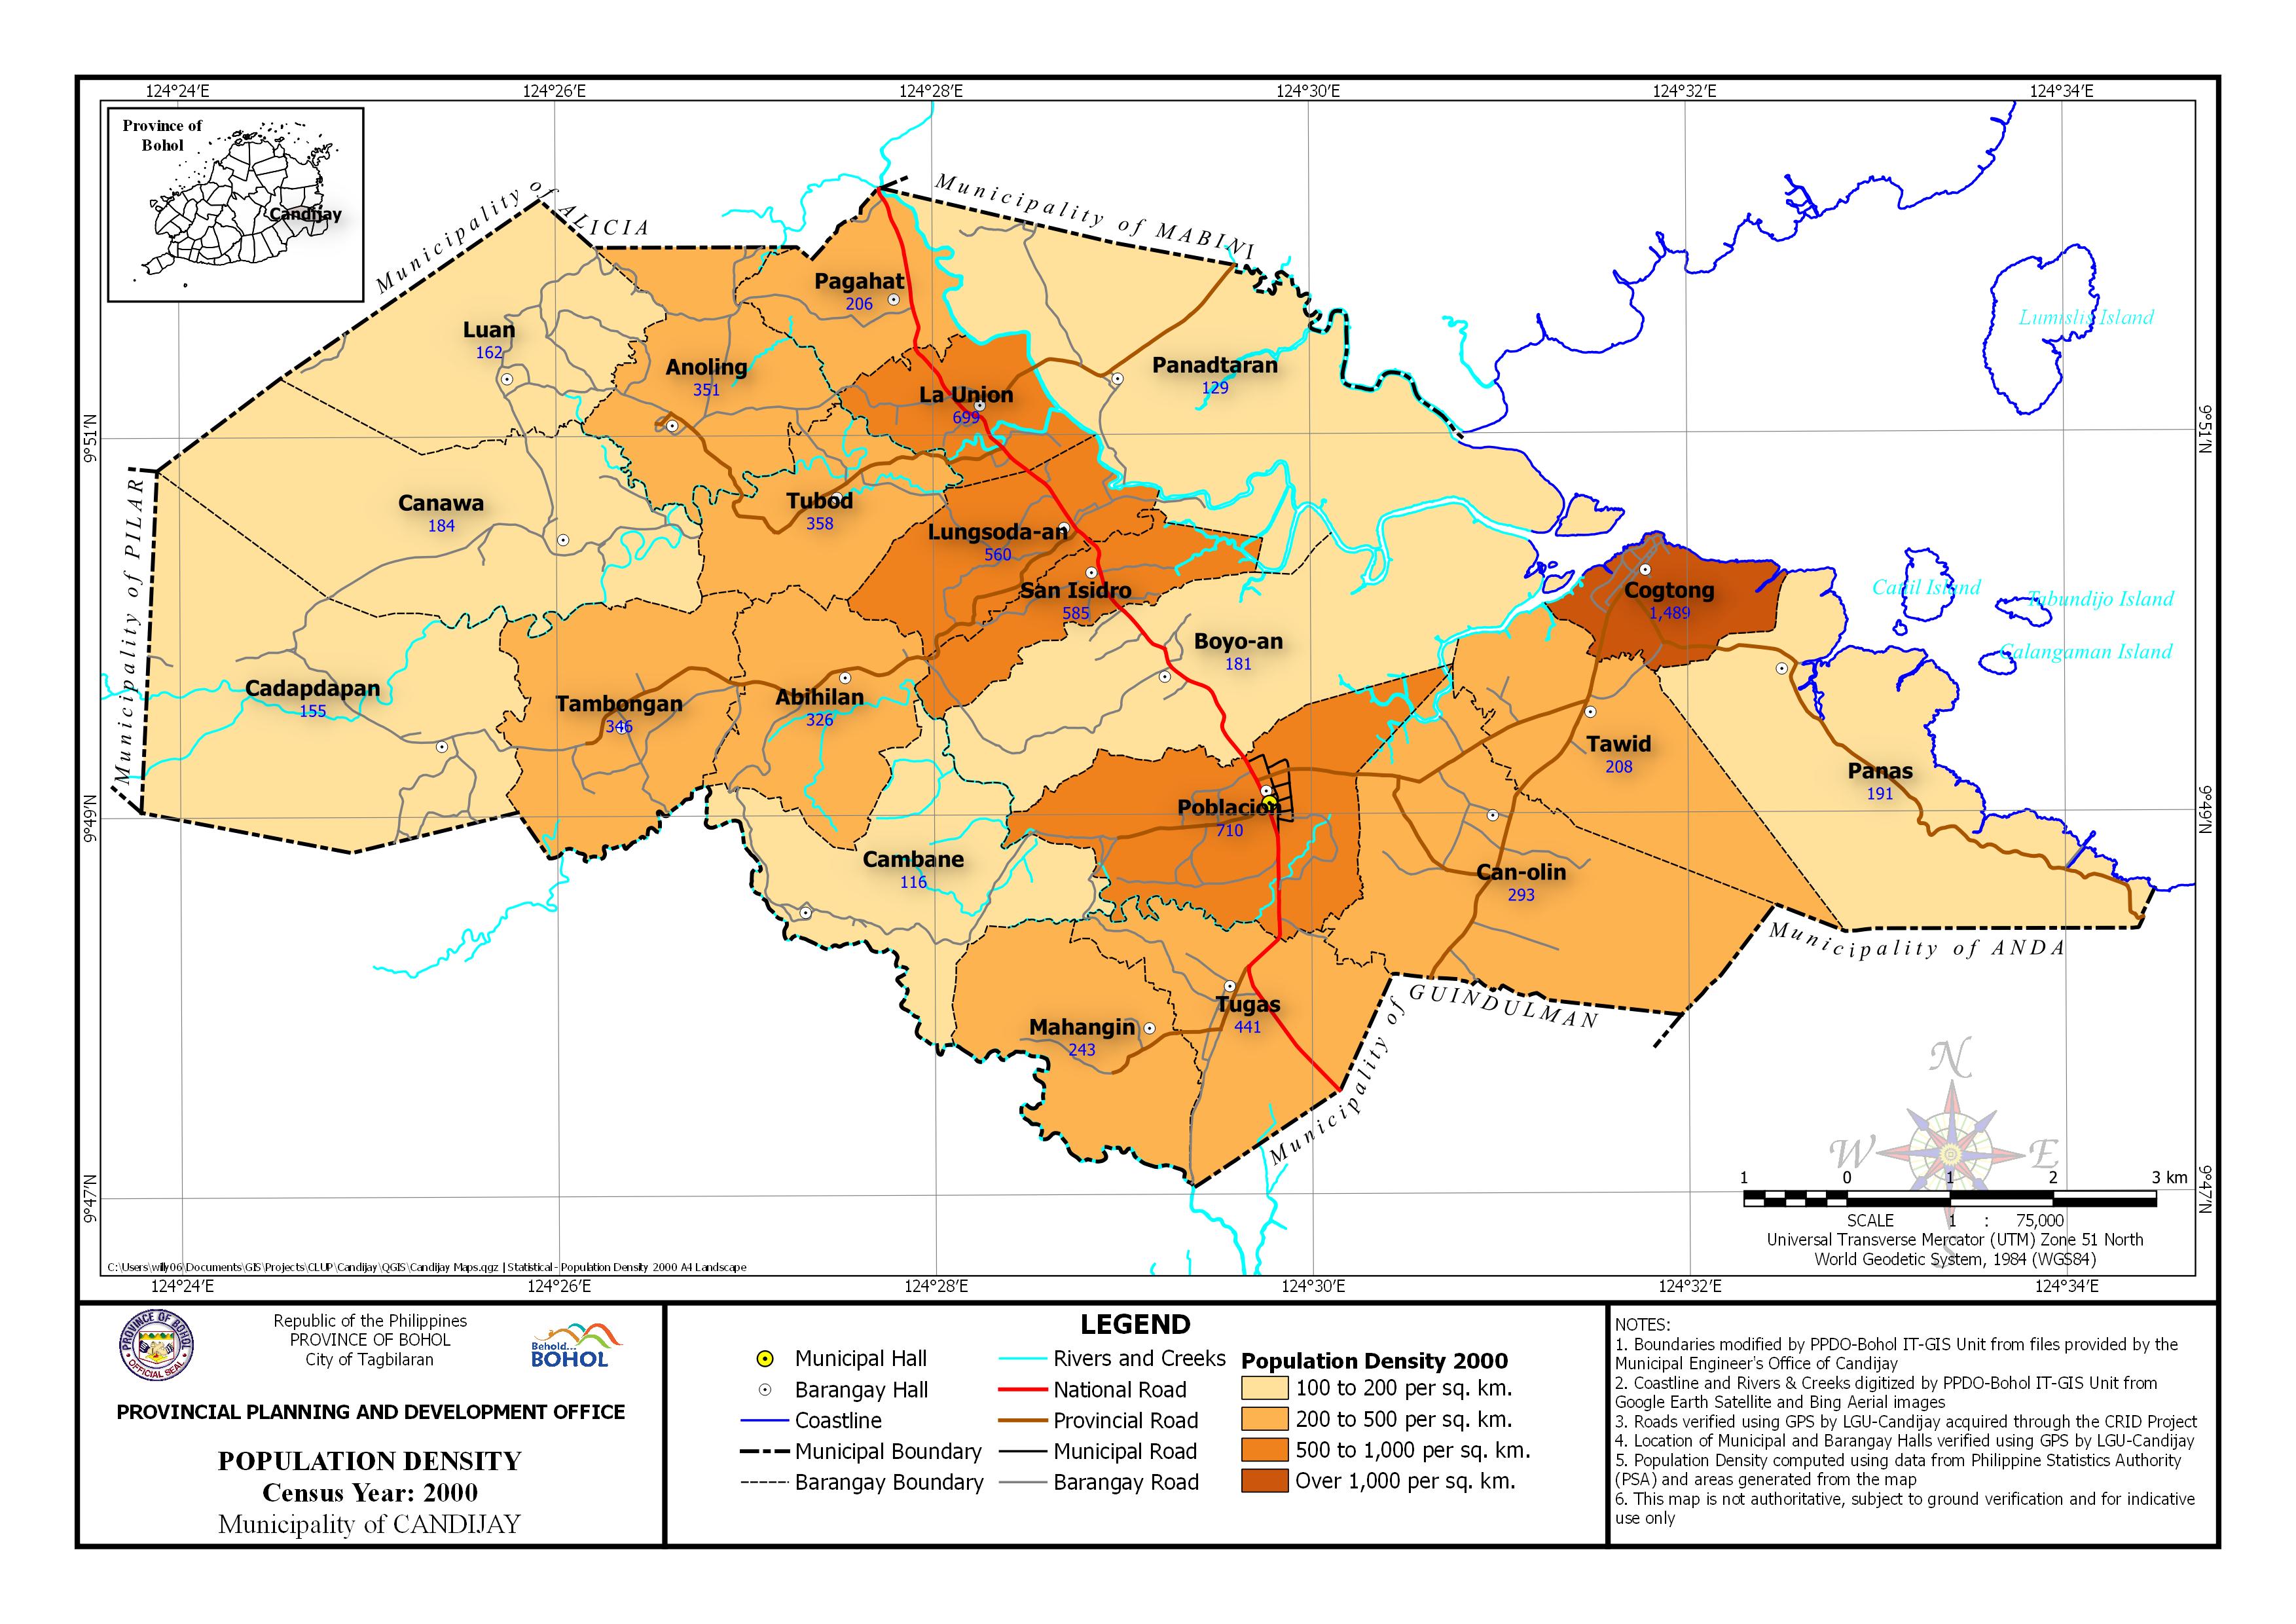 | Census Year: 2000 Download in PDF and JPG format |
 | Census Year: 2007 Download in PDF and JPG format |
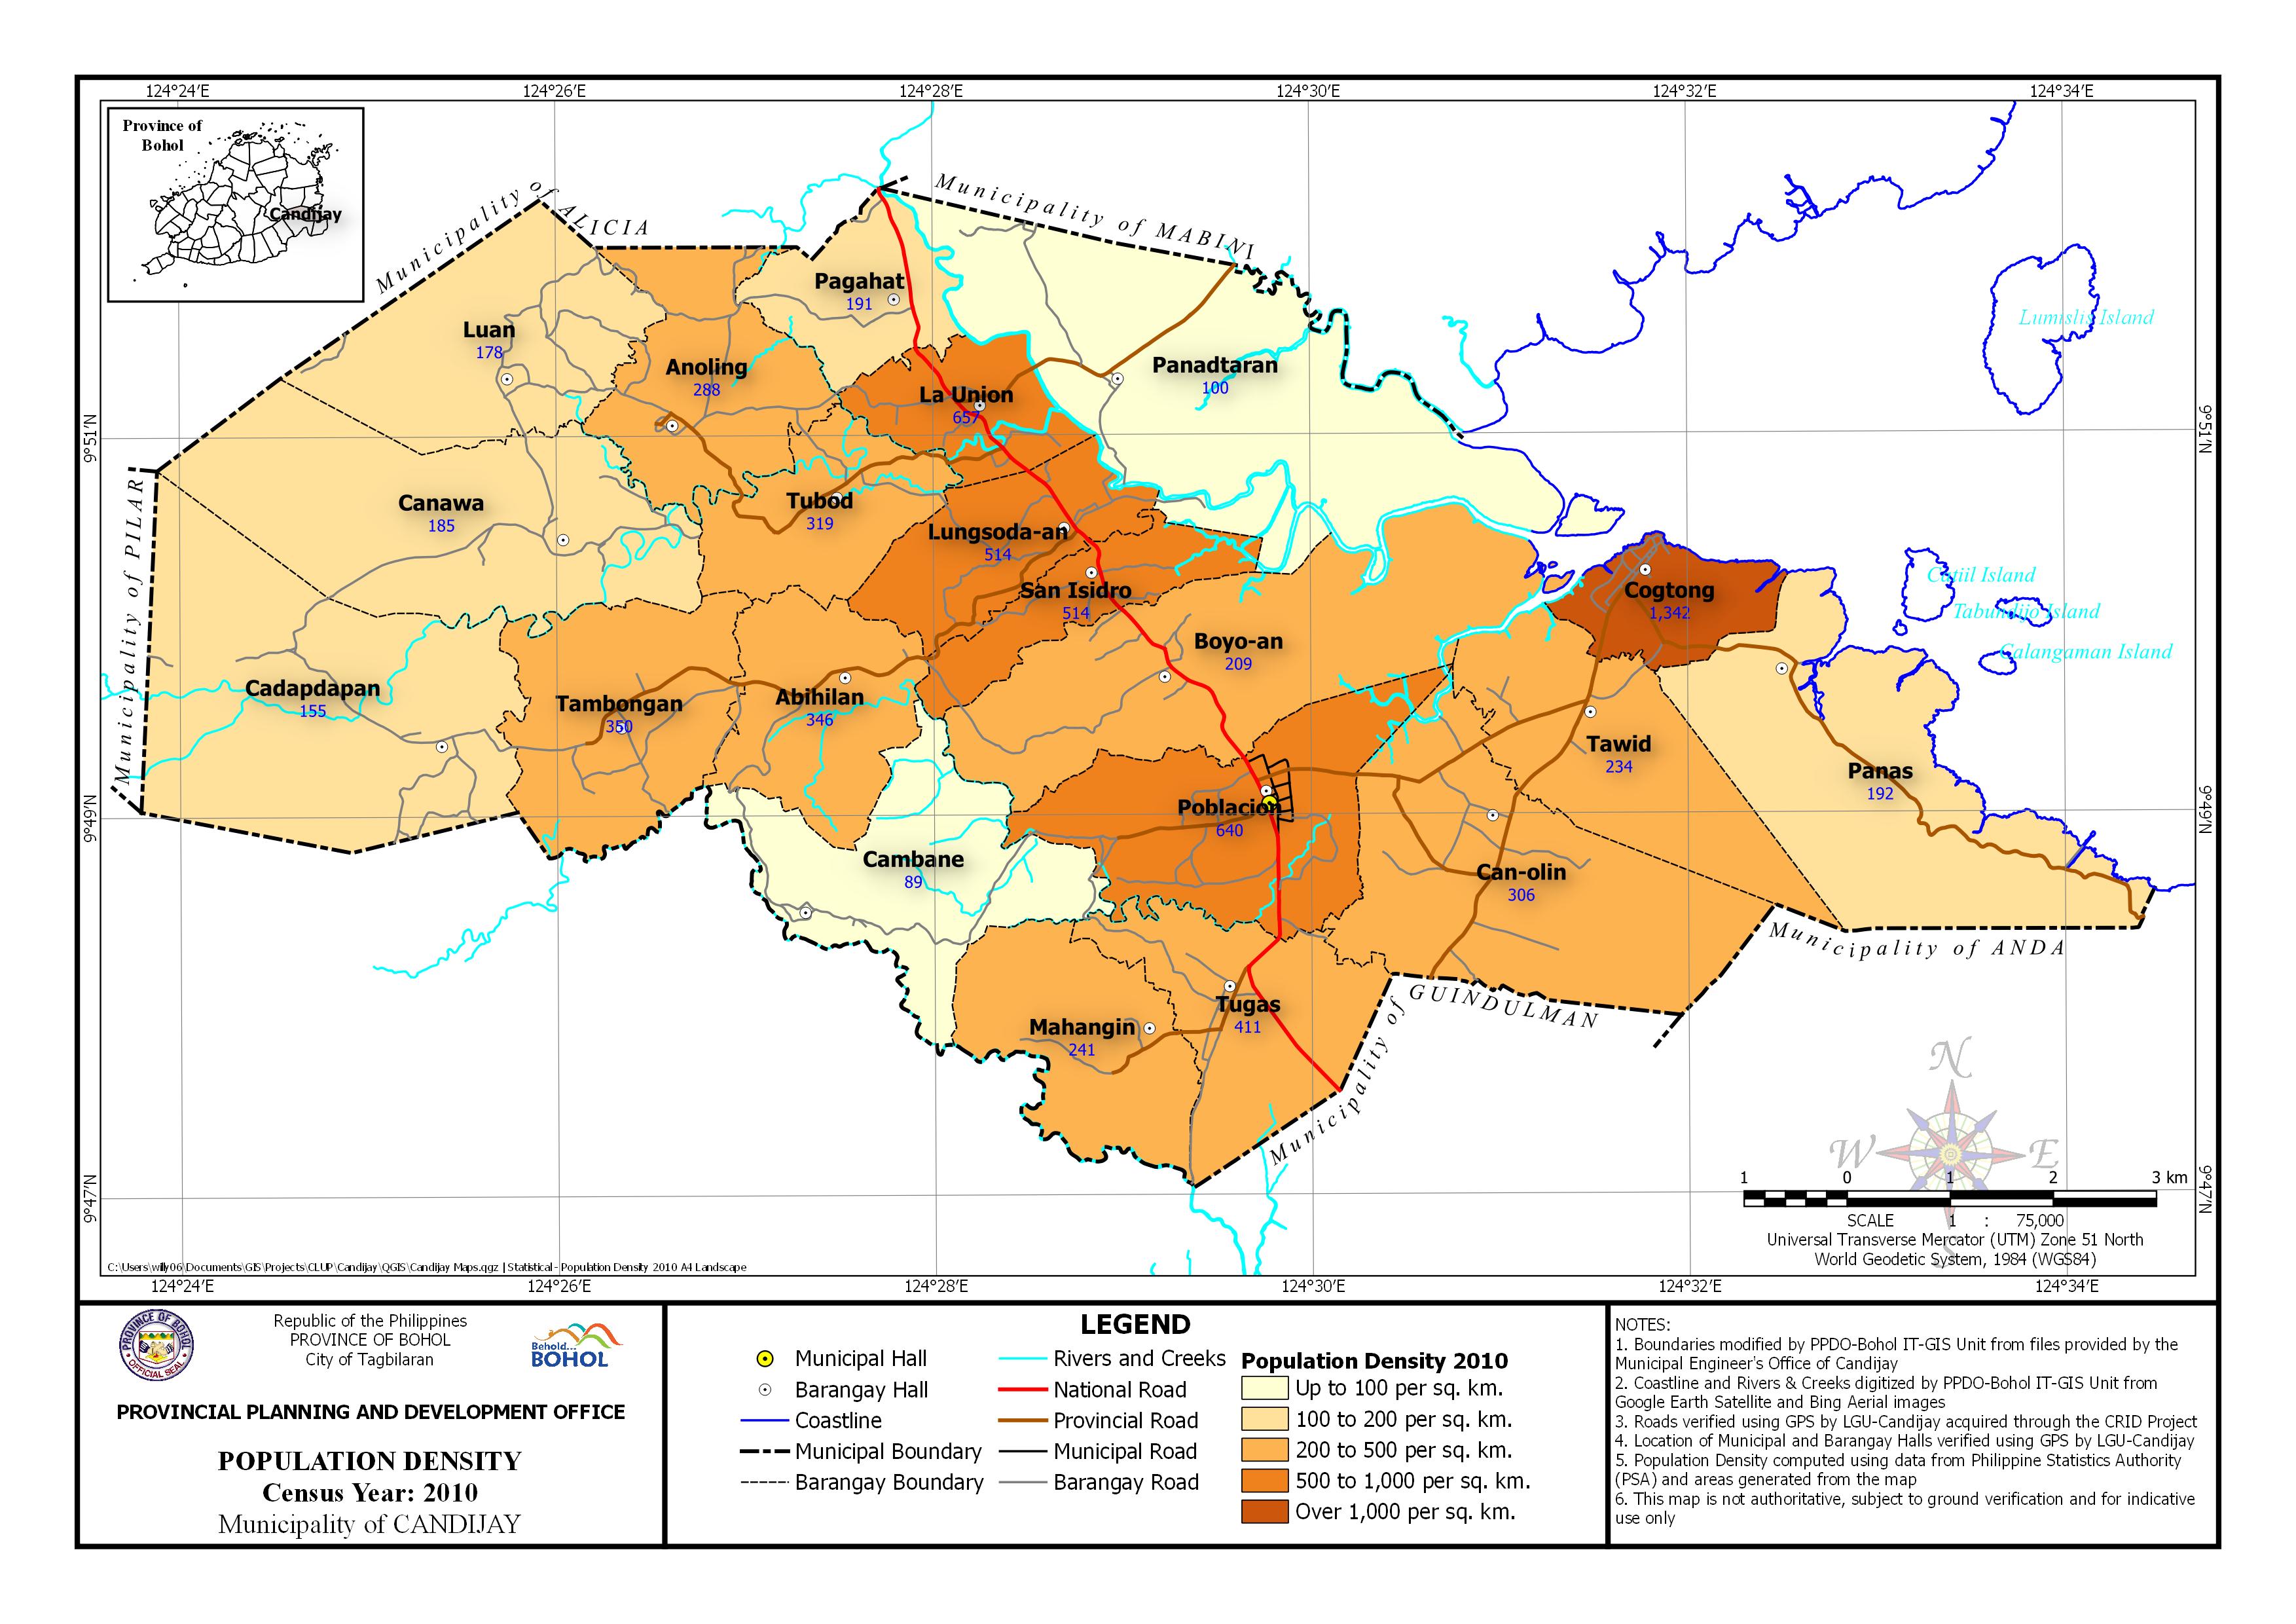
| Census Year: 2010 Download in PDF and JPG format |
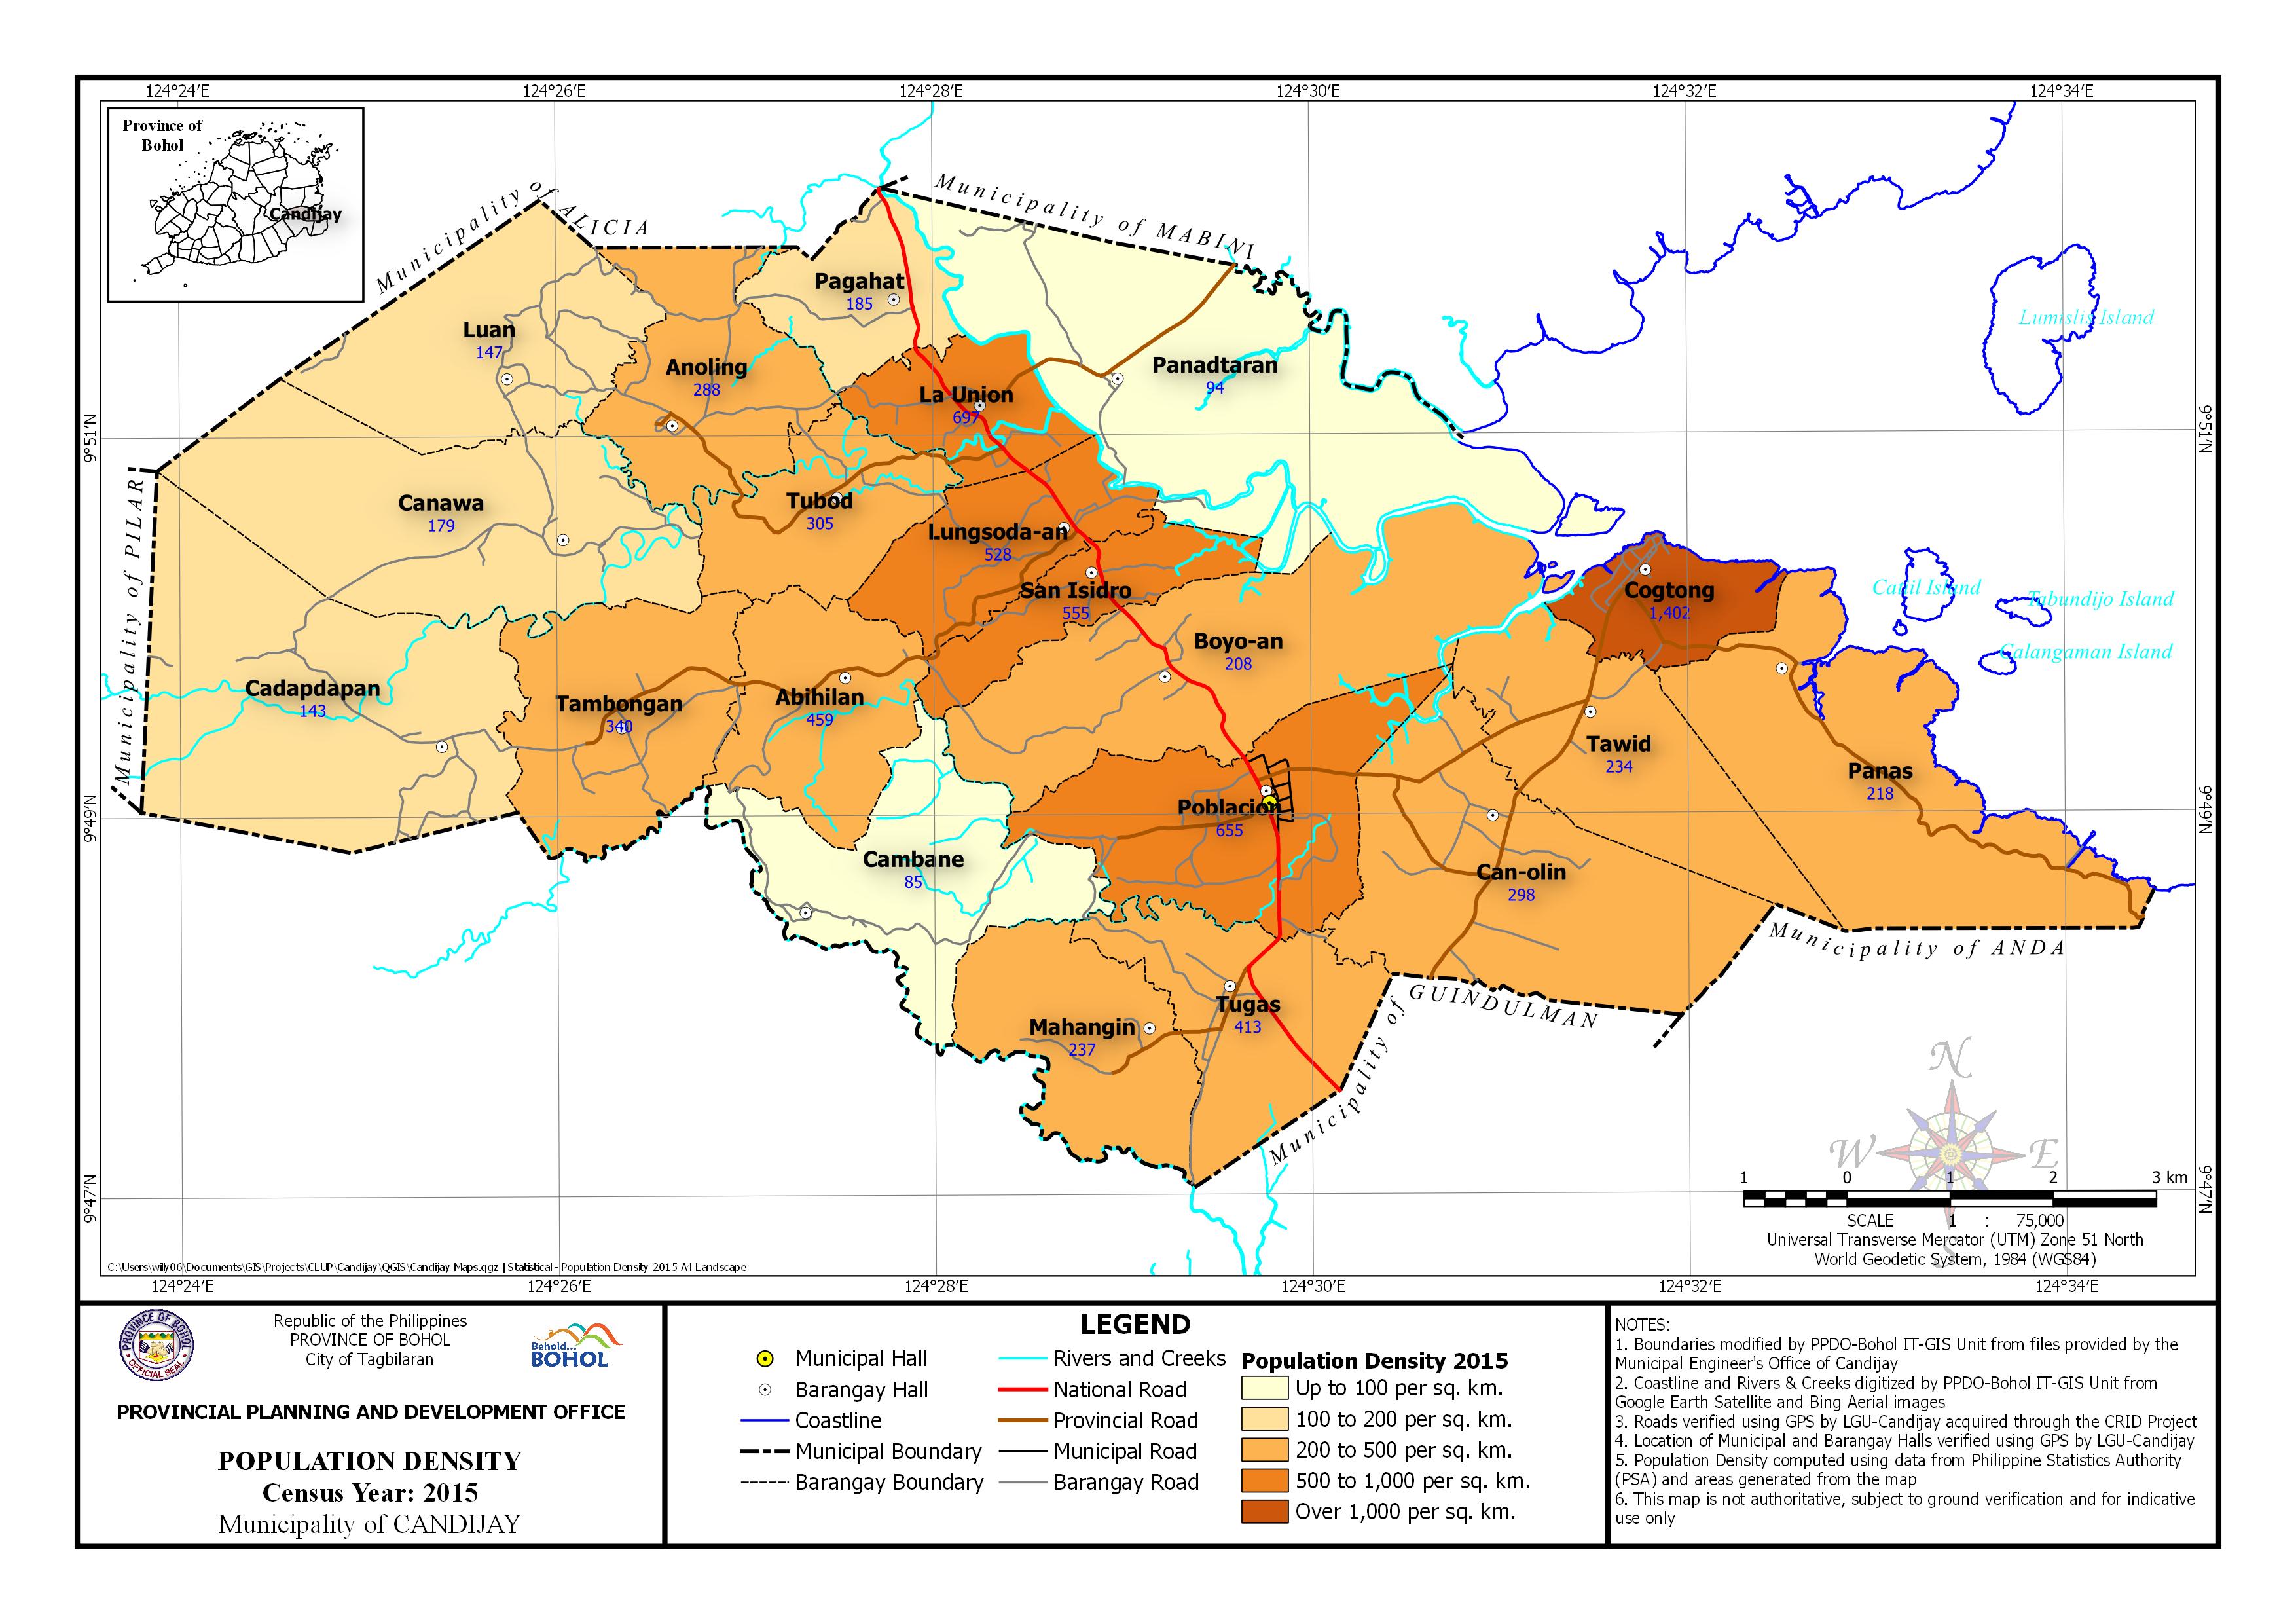 | Census Year: 2015 Download in PDF and JPG format |
| Barangay | Area | Census Year | |||||
| (Hectares) | 1990 | 1995 | 2000 | 2007 | 2010 | 2015 | |
| Abihilan | 349.259 | 273 | 262 | 326 | 317 | 346 | 459 |
| Anoling | 386.931 | 264 | 279 | 351 | 338 | 288 | 288 |
| Boyo-an | 772.874 | 175 | 180 | 181 | 208 | 209 | 208 |
| Cadapdapan | 888.484 | 138 | 151 | 155 | 163 | 155 | 143 |
| Cambane | 491.001 | 119 | 102 | 116 | 125 | 89 | 85 |
| Can-olin | 722.689 | 291 | 252 | 293 | 300 | 306 | 298 |
| Canawa | 763.727 | 159 | 153 | 184 | 199 | 185 | 179 |
| Cogtong | 185.749 | 1,394 | 1,193 | 1,489 | 1,449 | 1,342 | 1,402 |
| La Union | 207.807 | 580 | 623 | 699 | 751 | 657 | 697 |
| Luan | 496.681 | 149 | 142 | 162 | 176 | 178 | 147 |
| Lungsoda-an | 284.118 | 490 | 480 | 560 | 581 | 514 | 528 |
| Mahangin | 375.233 | 186 | 220 | 243 | 240 | 241 | 237 |
| Pagahat | 232.154 | 171 | 147 | 206 | 174 | 191 | 185 |
| Panadtaran | 1,003.93 | 101 | 93 | 129 | 138 | 100 | 94 |
| Panas | 768.855 | 163 | 153 | 191 | 191 | 192 | 218 |
| Poblacion | 522.393 | 553 | 587 | 710 | 747 | 640 | 655 |
| San Isidro | 202.583 | 501 | 512 | 585 | 584 | 514 | 555 |
| Tambongan | 454.057 | 291 | 280 | 346 | 346 | 350 | 340 |
| Tawid | 465.637 | 172 | 180 | 208 | 230 | 234 | 234 |
| Tubod | 291.064 | 299 | 312 | 358 | 338 | 319 | 305 |
| Tugas | 399.458 | 368 | 386 | 441 | 443 | 411 | 413 |
| Municipal | 10,453.15 | 250 | 246 | 291 | 298 | 278 | 282 |