
Download in PDF and JPG format
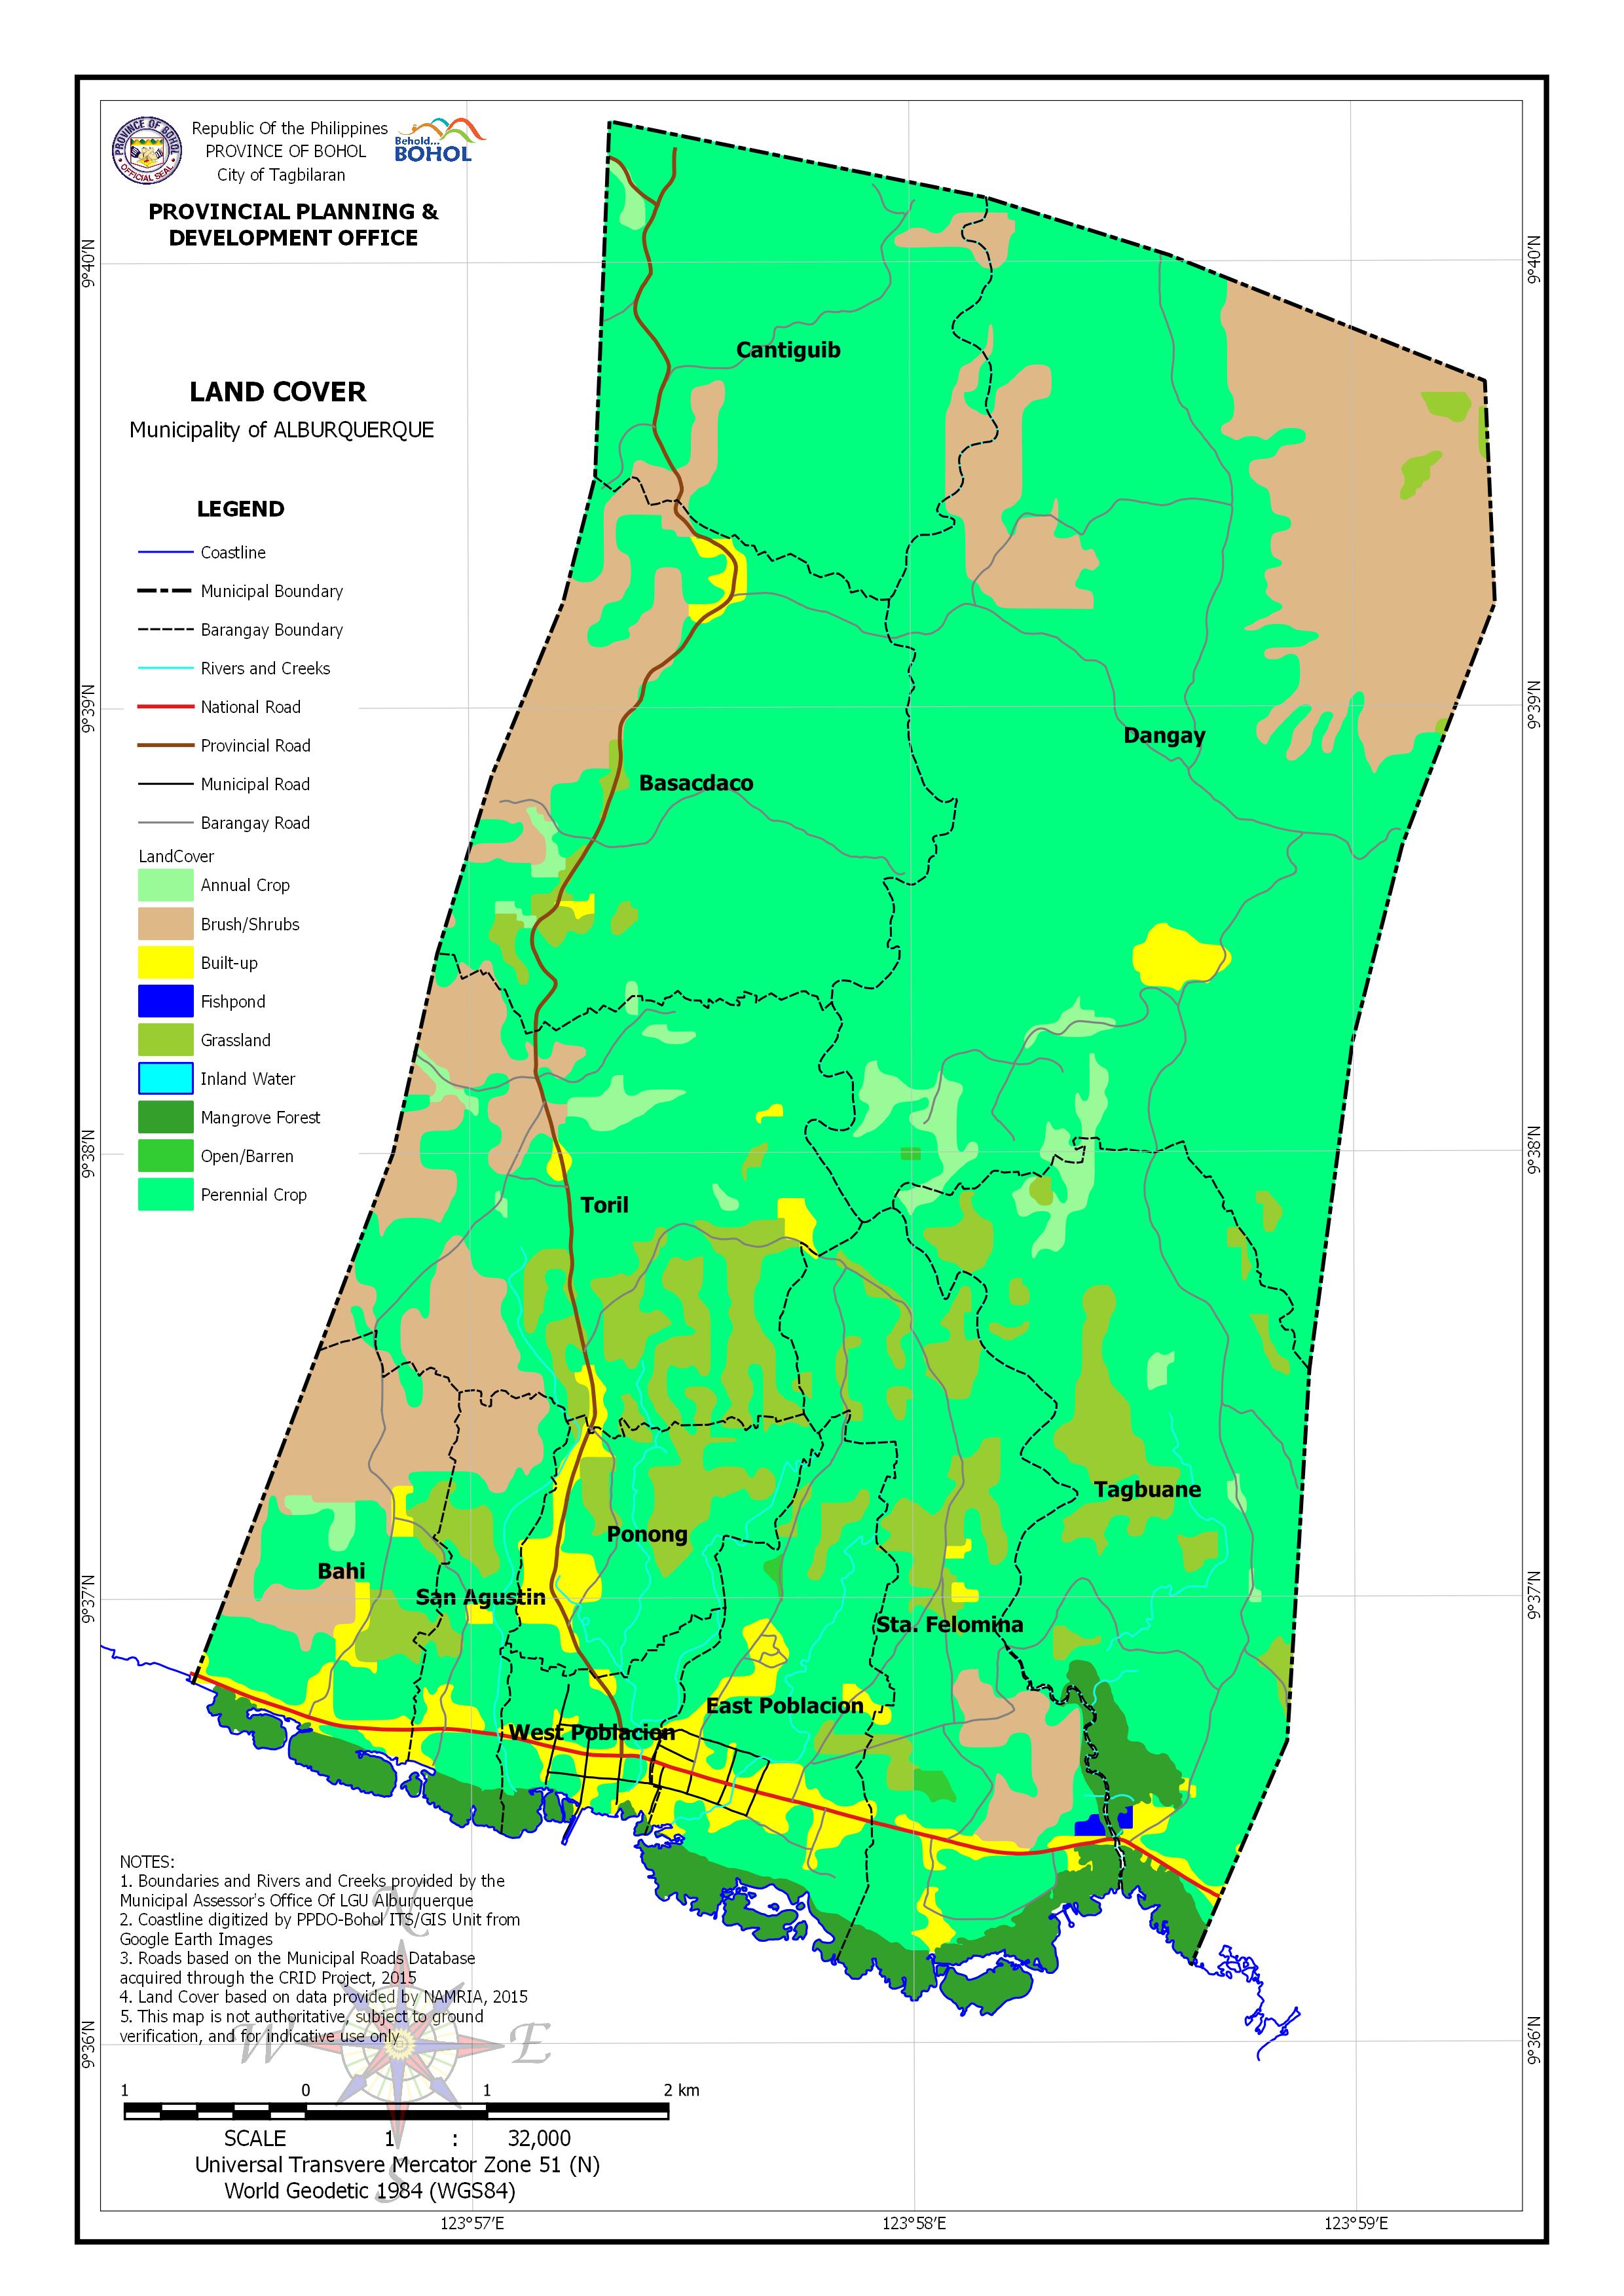
AREA EXPOSED TO LAND COVER BY BARANGAY
| Barangay | Area | Annual Crop | Brush/Shrubs | Built-up | Fishpond | Grassland | Inland Water | Mangrove Forest | Open/Barren | Perennial Crop | No Data | ||||||||||
| (Hectares) | (Hectares) | (Percentage) | (Hectares) | (Percentage) | (Hectares) | (Percentage) | (Hectares) | (Percentage) | (Hectares) | (Percentage) | (Hectares) | (Percentage) | (Hectares) | (Percentage) | (Hectares) | (Percentage) | (Hectares) | (Percentage) | (Hectares) | (Percentage) | |
| Bahi | 131.978 | 3.407 | 2.58% | 50.33 | 38.14% | 14.106 | 10.69% | 9.523 | 7.22% | 10.502 | 7.96% | 43.496 | 32.96% | 0.613 | 0.46% | ||||||
| Basacdaco | 320.521 | 4.023 | 1.26% | 53.311 | 16.63% | 5.835 | 1.82% | 10.501 | 3.28% | 246.851 | 77.02% | ||||||||||
| Cantiguib | 244.97 | 2.421 | 0.99% | 18.553 | 7.57% | 0 | 0.00% | 223.997 | 91.44% | ||||||||||||
| Dangay | 815.135 | 18.937 | 2.32% | 185.159 | 22.72% | 7.798 | 0.96% | 5.52 | 0.68% | 0.541 | 0.07% | 597.179 | 73.26% | ||||||||
| East Poblacion | 141.696 | 31.419 | 22.17% | 7.726 | 5.45% | 0.06 | 0.04% | 13.731 | 9.69% | 1.039 | 0.73% | 87.461 | 61.72% | 0.26 | 0.18% | ||||||
| Ponong | 89.032 | 15.191 | 17.06% | 21.383 | 24.02% | 52.458 | 58.92% | ||||||||||||||
| San Agustin | 65.521 | 12.596 | 19.23% | 6.434 | 9.82% | 7.459 | 11.39% | 5.214 | 7.96% | 33.662 | 51.38% | 0.155 | 0.24% | ||||||||
| Sta. Felomina | 242.704 | 21.559 | 8.88% | 11.959 | 4.93% | 0.915 | 0.38% | 35.902 | 14.79% | 0.068 | 0.03% | 25.723 | 10.60% | 1.831 | 0.75% | 144.024 | 59.34% | 0.724 | 0.30% | ||
| Tagbuane | 319.398 | 11.085 | 3.47% | 5.766 | 1.81% | 0.467 | 0.15% | 41.918 | 13.12% | 19.742 | 6.18% | 240.366 | 75.26% | 0.054 | 0.02% | ||||||
| Toril | 308.17 | 11.104 | 3.60% | 64.405 | 20.90% | 6.769 | 2.20% | 48.002 | 15.58% | 177.89 | 57.73% | ||||||||||
| West Poblacion | 47.003 | 11.825 | 25.16% | 4.295 | 9.14% | 30.45 | 64.78% | 0.434 | 0.92% | ||||||||||||
| Total | 2,726.13 | 50.977 | 1.87% | 405.912 | 14.89% | 117.101 | 4.30% | 1.382 | 0.05% | 187.935 | 6.89% | 0.128 | 0.01% | 79.206 | 2.91% | 3.412 | 0.13% | 1,877.84 | 68.88% | 2.239 | 0.08% |