
Download in PDF and JPG format
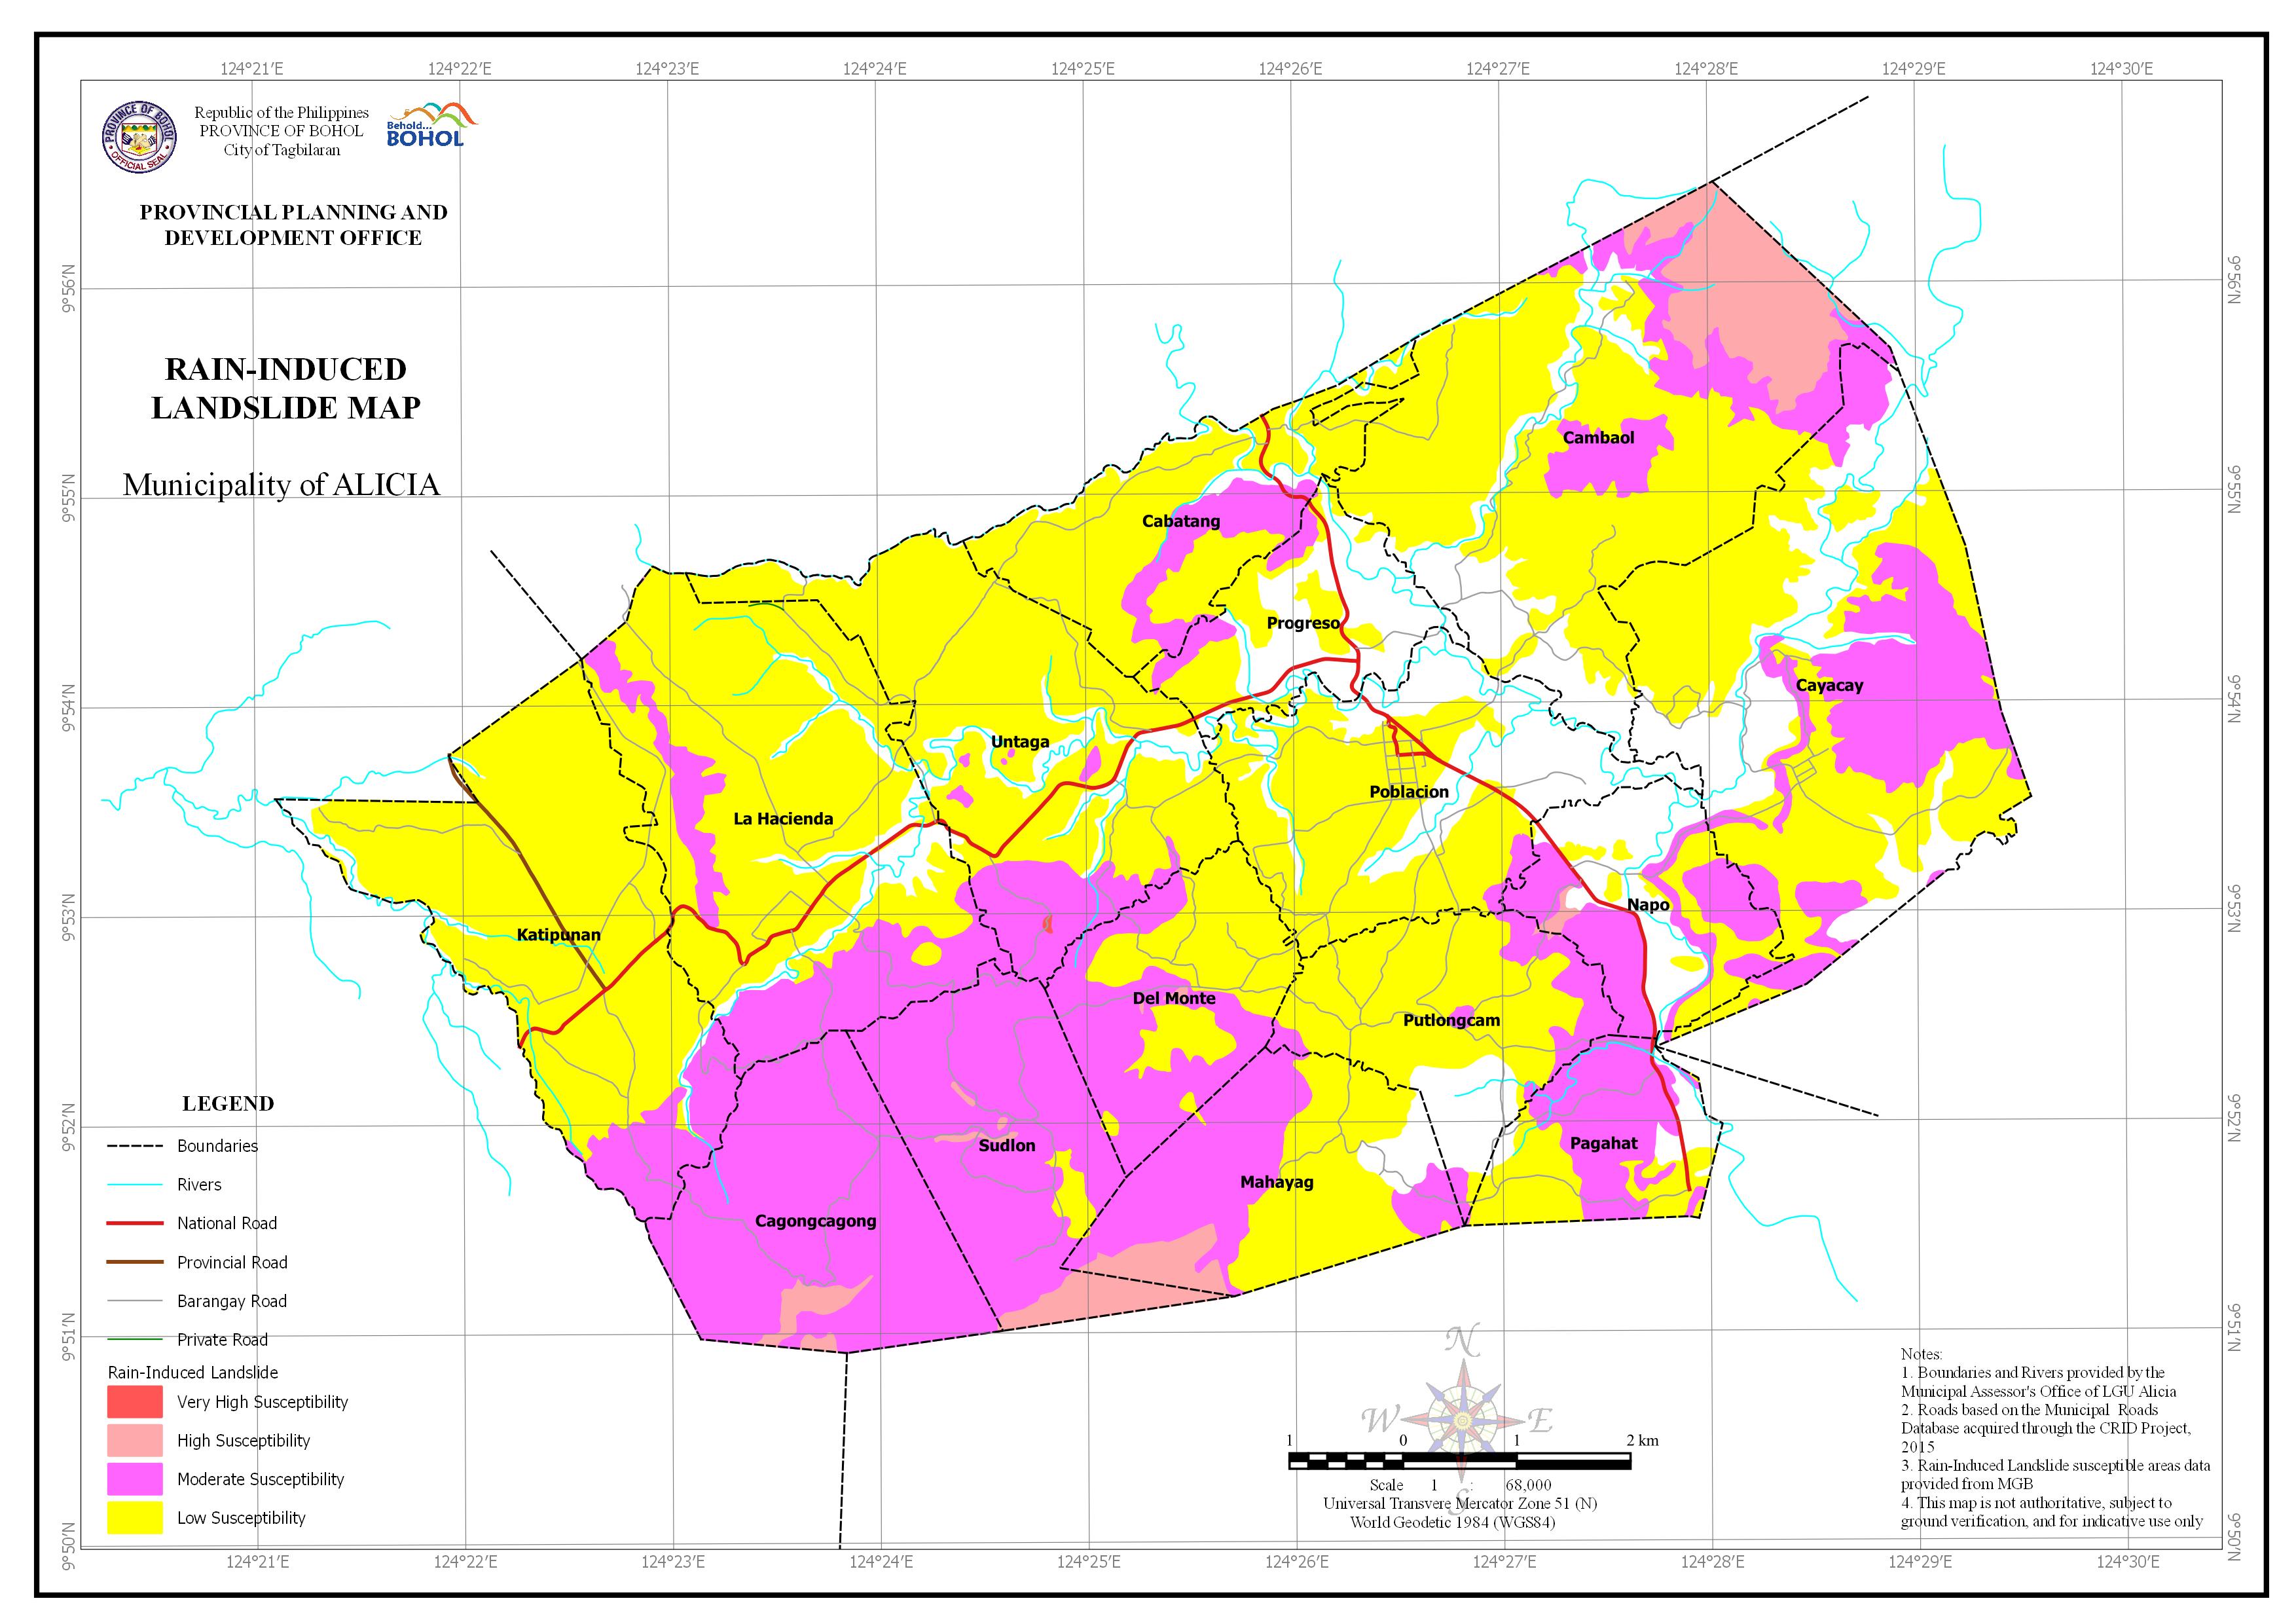
AREA EXPOSED TO RAIN-INDUCED LANDSLIDE BY BARANGAY
| Barangay | Area | Area Exposed to Very High Susceptibility | Area Exposed to High Susceptibility | Area Exposed to Low Susceptibility | Area Expopsed to Moderate Susceptibility | Area Not Exposed | |||||
| (Hectares) | (Hectares) | Percentage | (Hectares) | Percentage | (Hectares) | Percentage | (Hectares) | Percentage | (Hectares) | Percentage | |
| Cabatang | 425.212 | 0.011 | 0.00% | 308.899 | 72.65% | 72.34 | 17.01% | 43.963 | 10.34% | ||
| Cagongcagong | 539.183 | 26.999 | 5.01% | 512.184 | 94.99% | ||||||
| Cambaol | 1,212.39 | 196.304 | 16.19% | 658.464 | 54.31% | 148.541 | 12.25% | 209.091 | 17.25% | ||
| Cayacay | 1,146.16 | 527.376 | 46.01% | 311.099 | 27.14% | 307.685 | 26.85% | ||||
| Del Monte | 372.367 | 3.026 | 0.81% | 186.552 | 50.10% | 182.788 | 49.09% | ||||
| Katipunan | 823.27 | 687.608 | 83.52% | 100.51 | 12.21% | 35.154 | 4.27% | ||||
| La Hacienda | 967.4 | 671.892 | 69.45% | 204.933 | 21.18% | 90.575 | 9.36% | ||||
| Mahayag | 479.164 | 42.177 | 8.80% | 197.793 | 41.28% | 204.754 | 42.73% | 34.44 | 7.19% | ||
| Napo | 335.262 | 5.635 | 1.68% | 63.076 | 18.81% | 130.256 | 38.85% | 136.295 | 40.65% | ||
| Pagahat | 260.509 | 92.928 | 35.67% | 132.266 | 50.77% | 35.313 | 13.56% | ||||
| Poblacion | 626.04 | 357.159 | 57.05% | 10.78 | 1.72% | 258.1 | 41.23% | ||||
| Progreso | 295.251 | 91.43 | 30.97% | 22.959 | 7.78% | 180.862 | 61.26% | ||||
| Putlongcam | 415.066 | 1.15 | 0.28% | 285.151 | 68.70% | 61.998 | 14.94% | 66.767 | 16.09% | ||
| Sudlon | 468.629 | 55.691 | 11.88% | 19.211 | 4.10% | 393.727 | 84.02% | ||||
| Untaga | 763.01 | 0.727 | 0.10% | 564.43 | 73.97% | 105.22 | 13.79% | 92.633 | 12.14% | ||
| Total | 9,128.92 | 0.727 | 0.01% | 330.994 | 3.63% | 4,711.97 | 51.62% | 2,594.35 | 28.42% | 1,490.88 | 16.33% |