
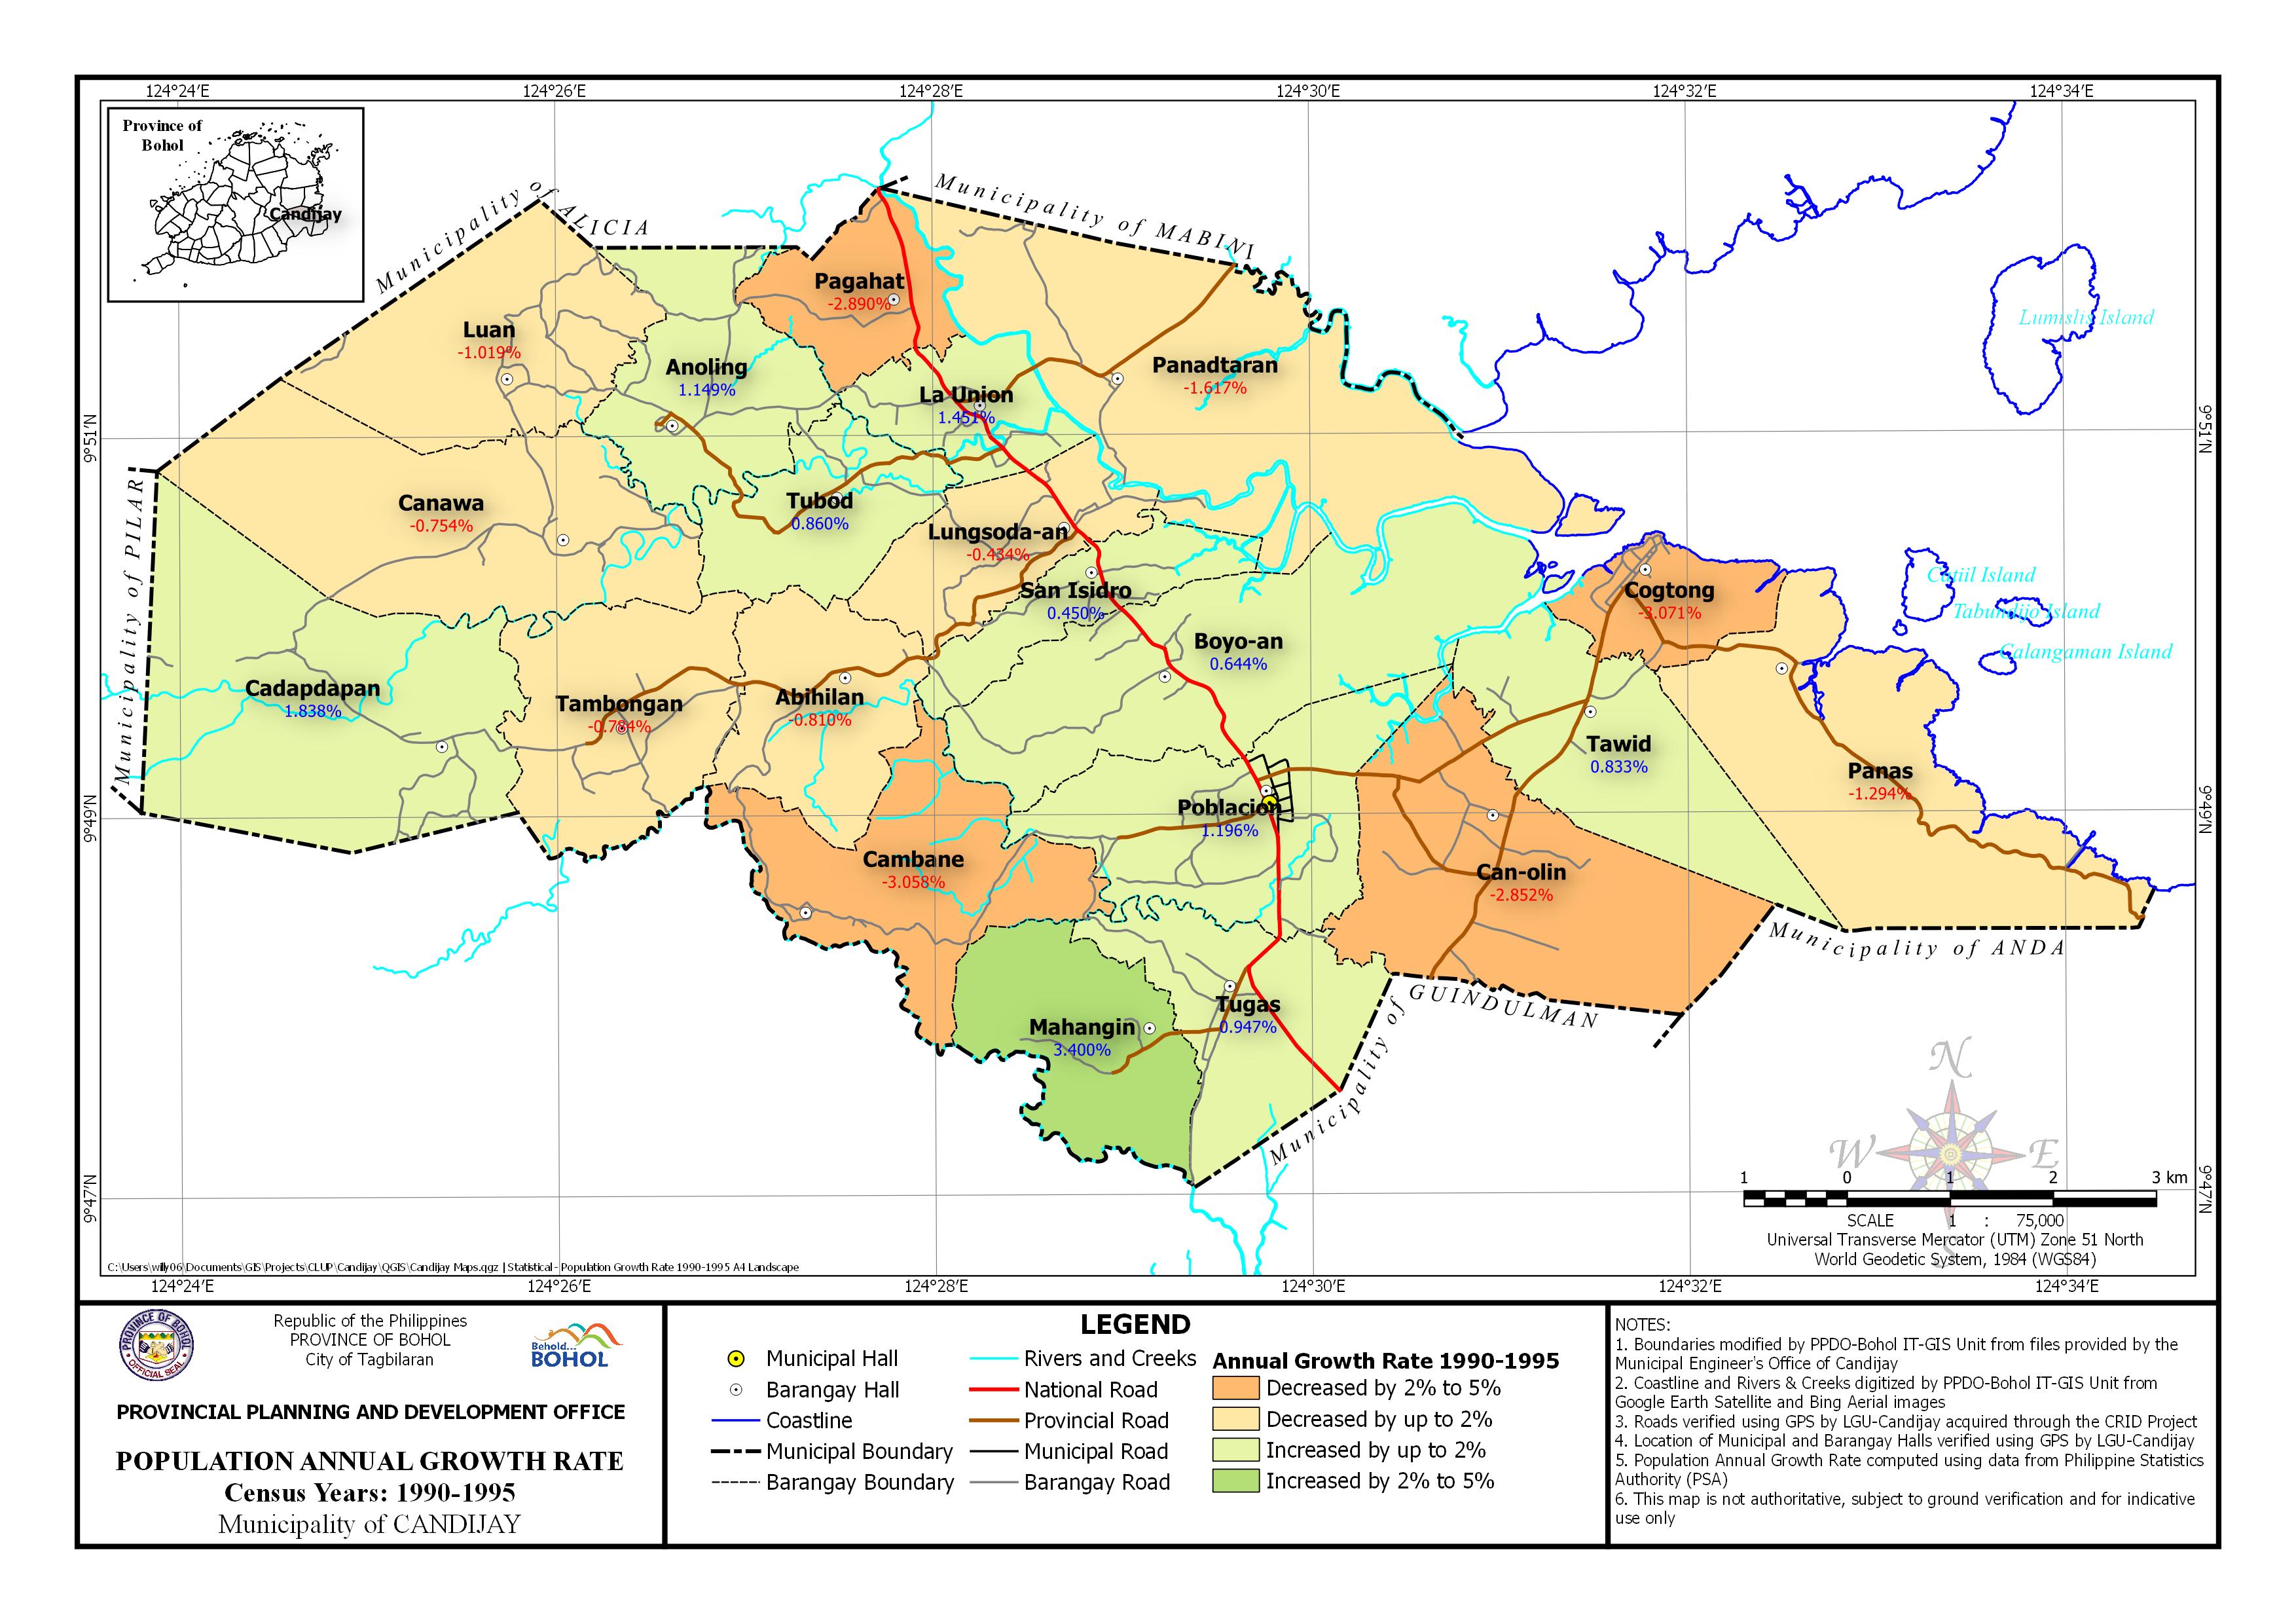
 | Census Year: 1990 – 1995 Download in PDF and JPG format |
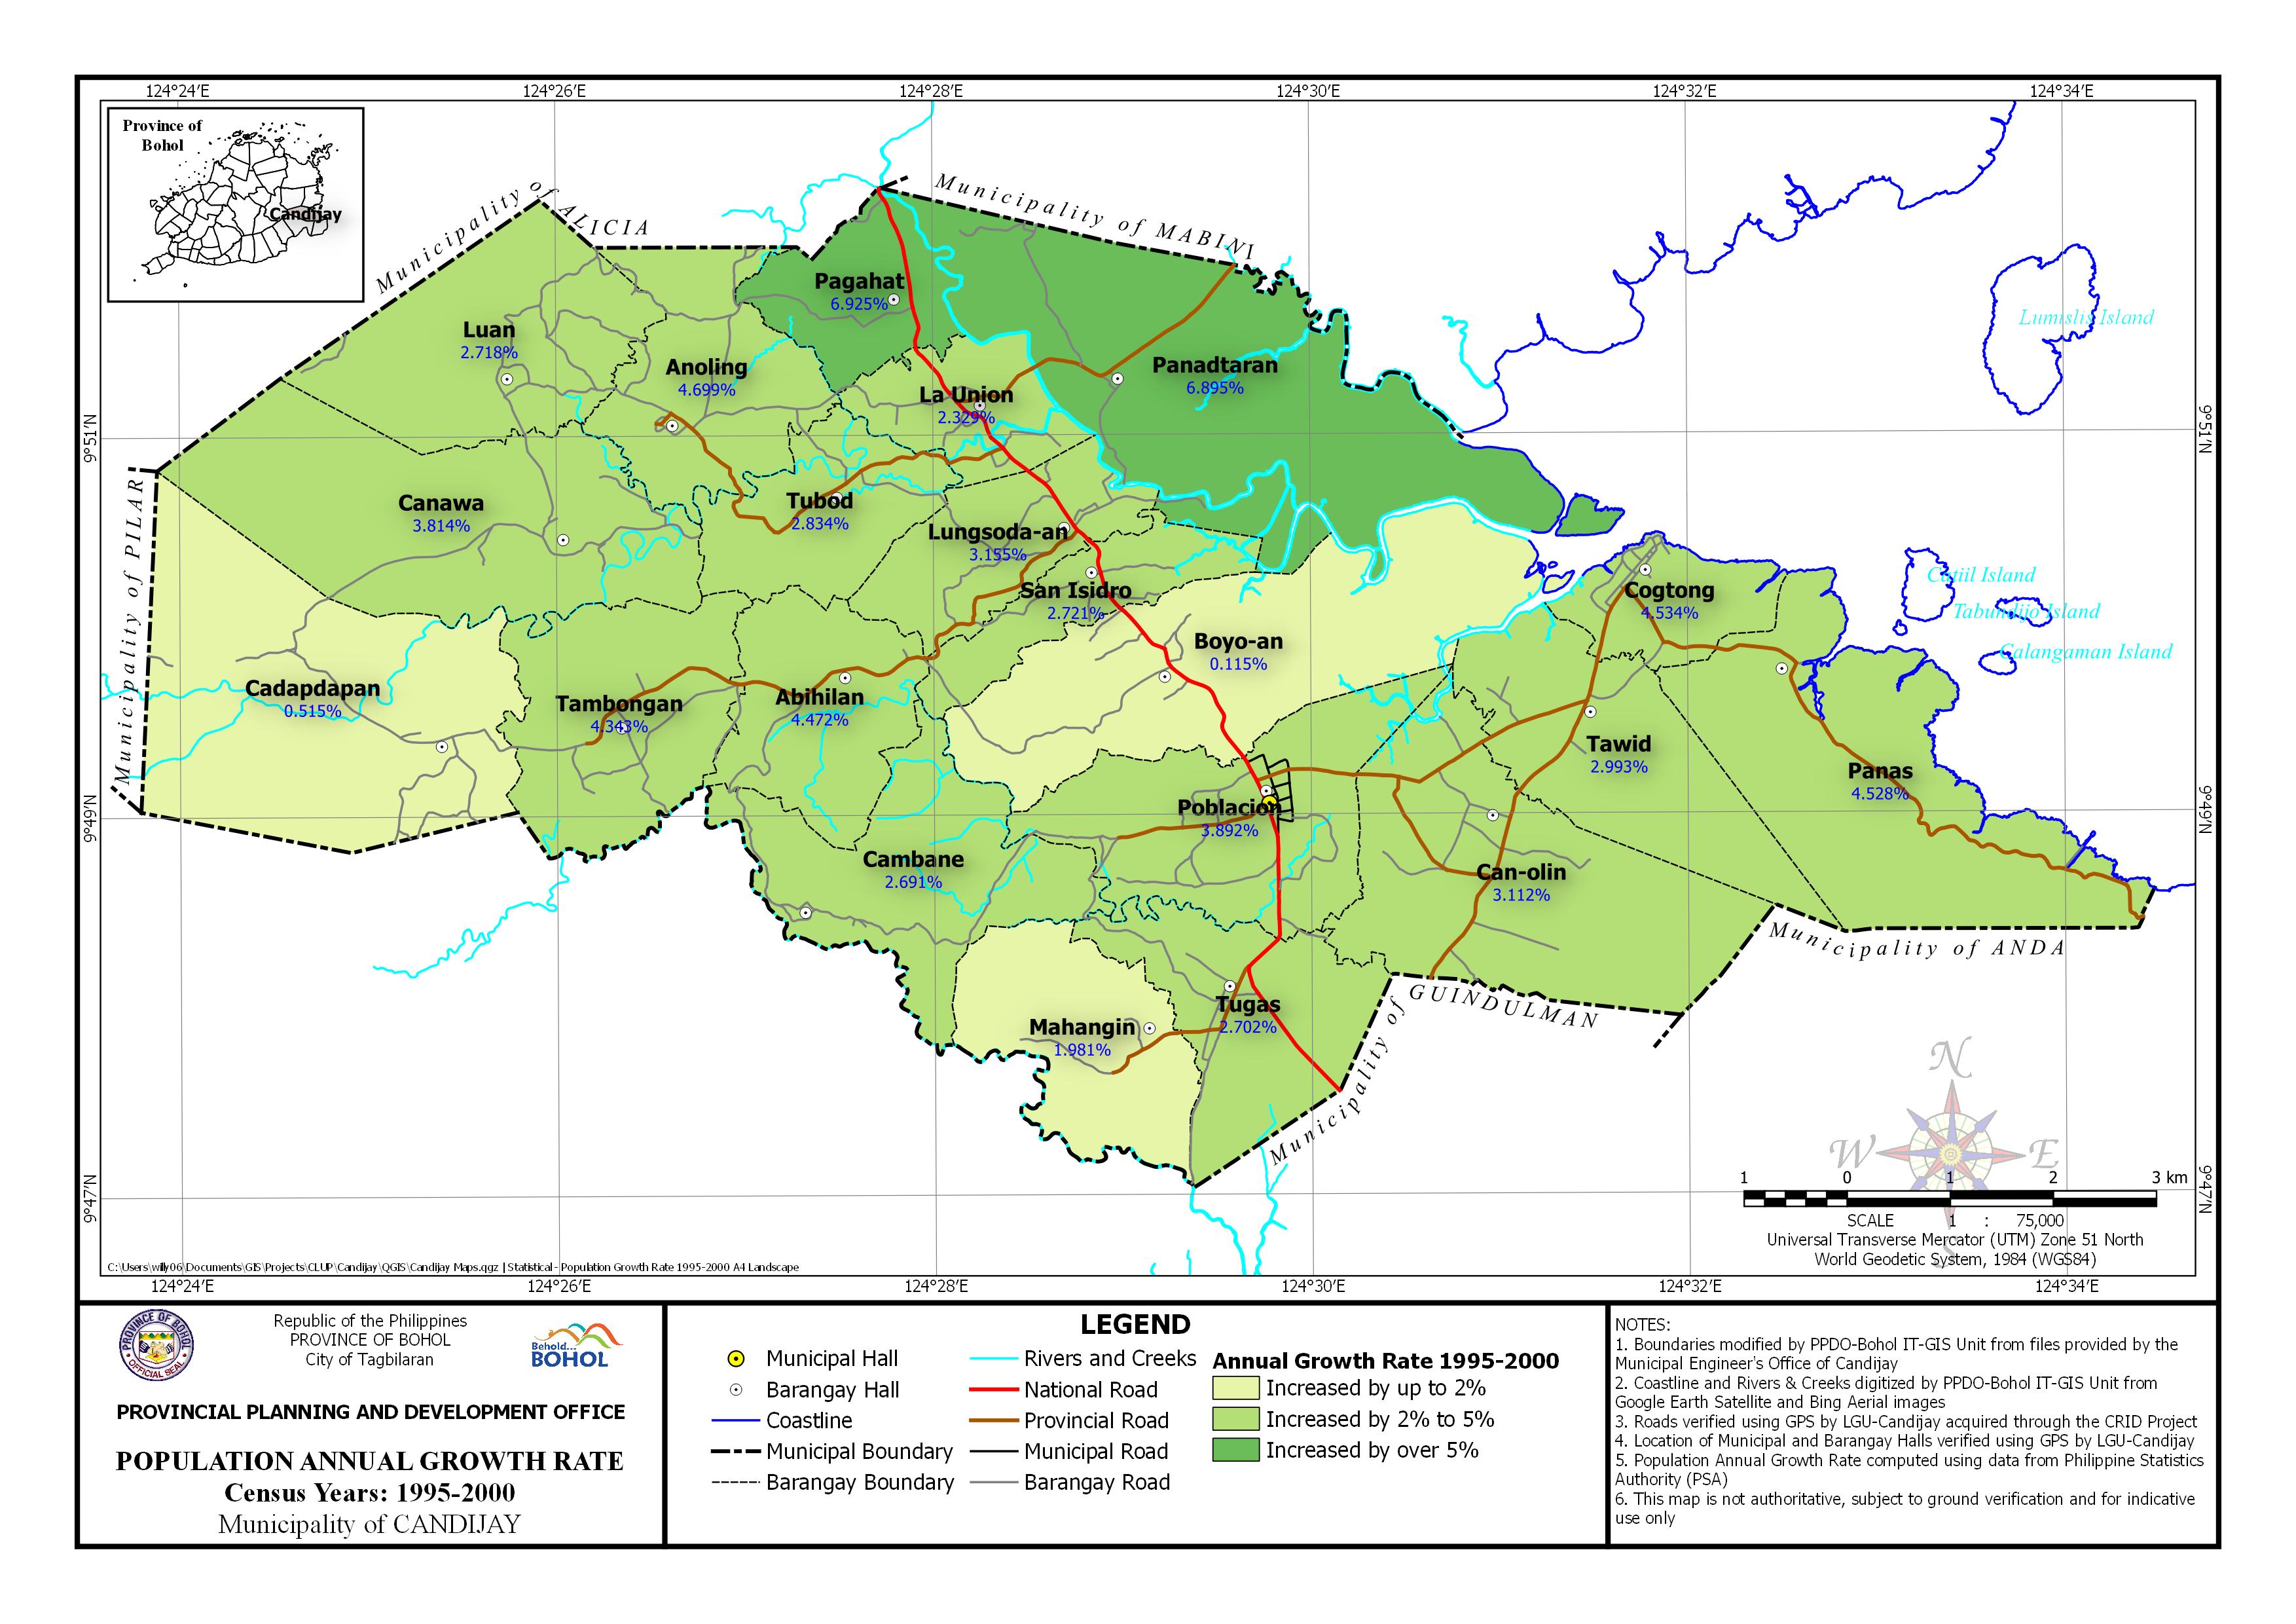 | Census Year: 1995 – 2000 Download in PDF and JPG format |
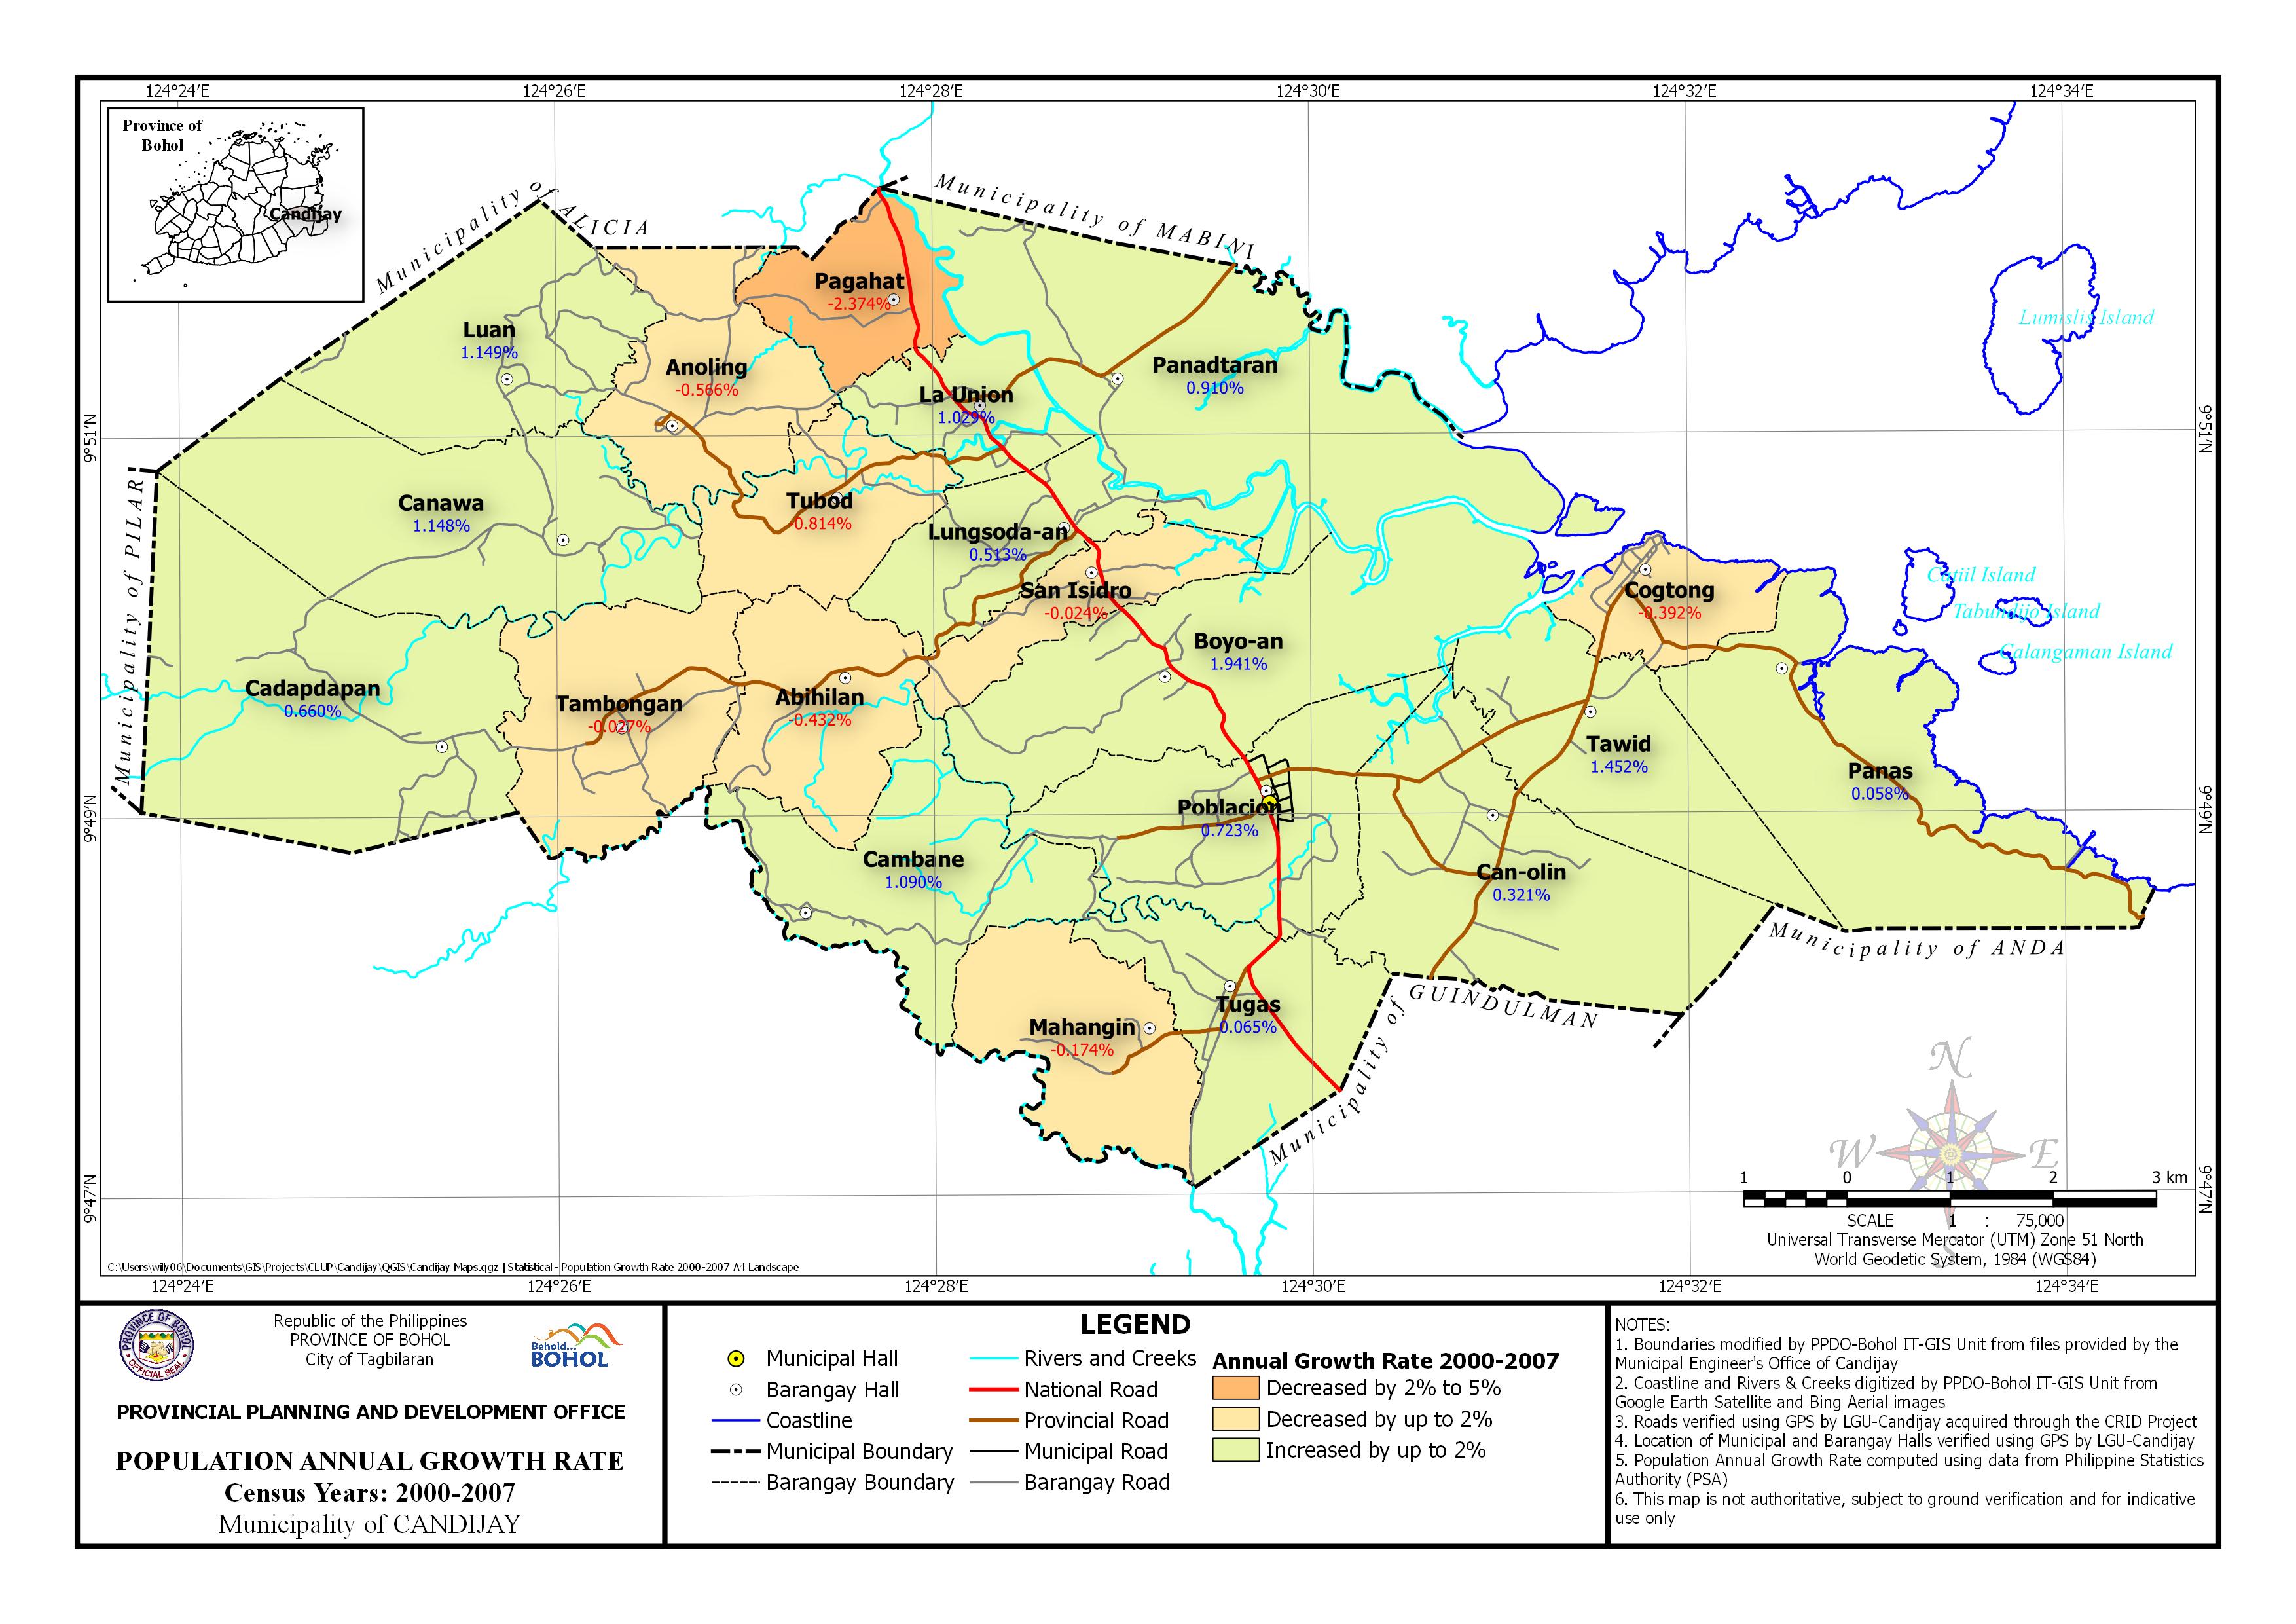 | Census Year: 2000 – 2007 Download in PDF and JPG format |
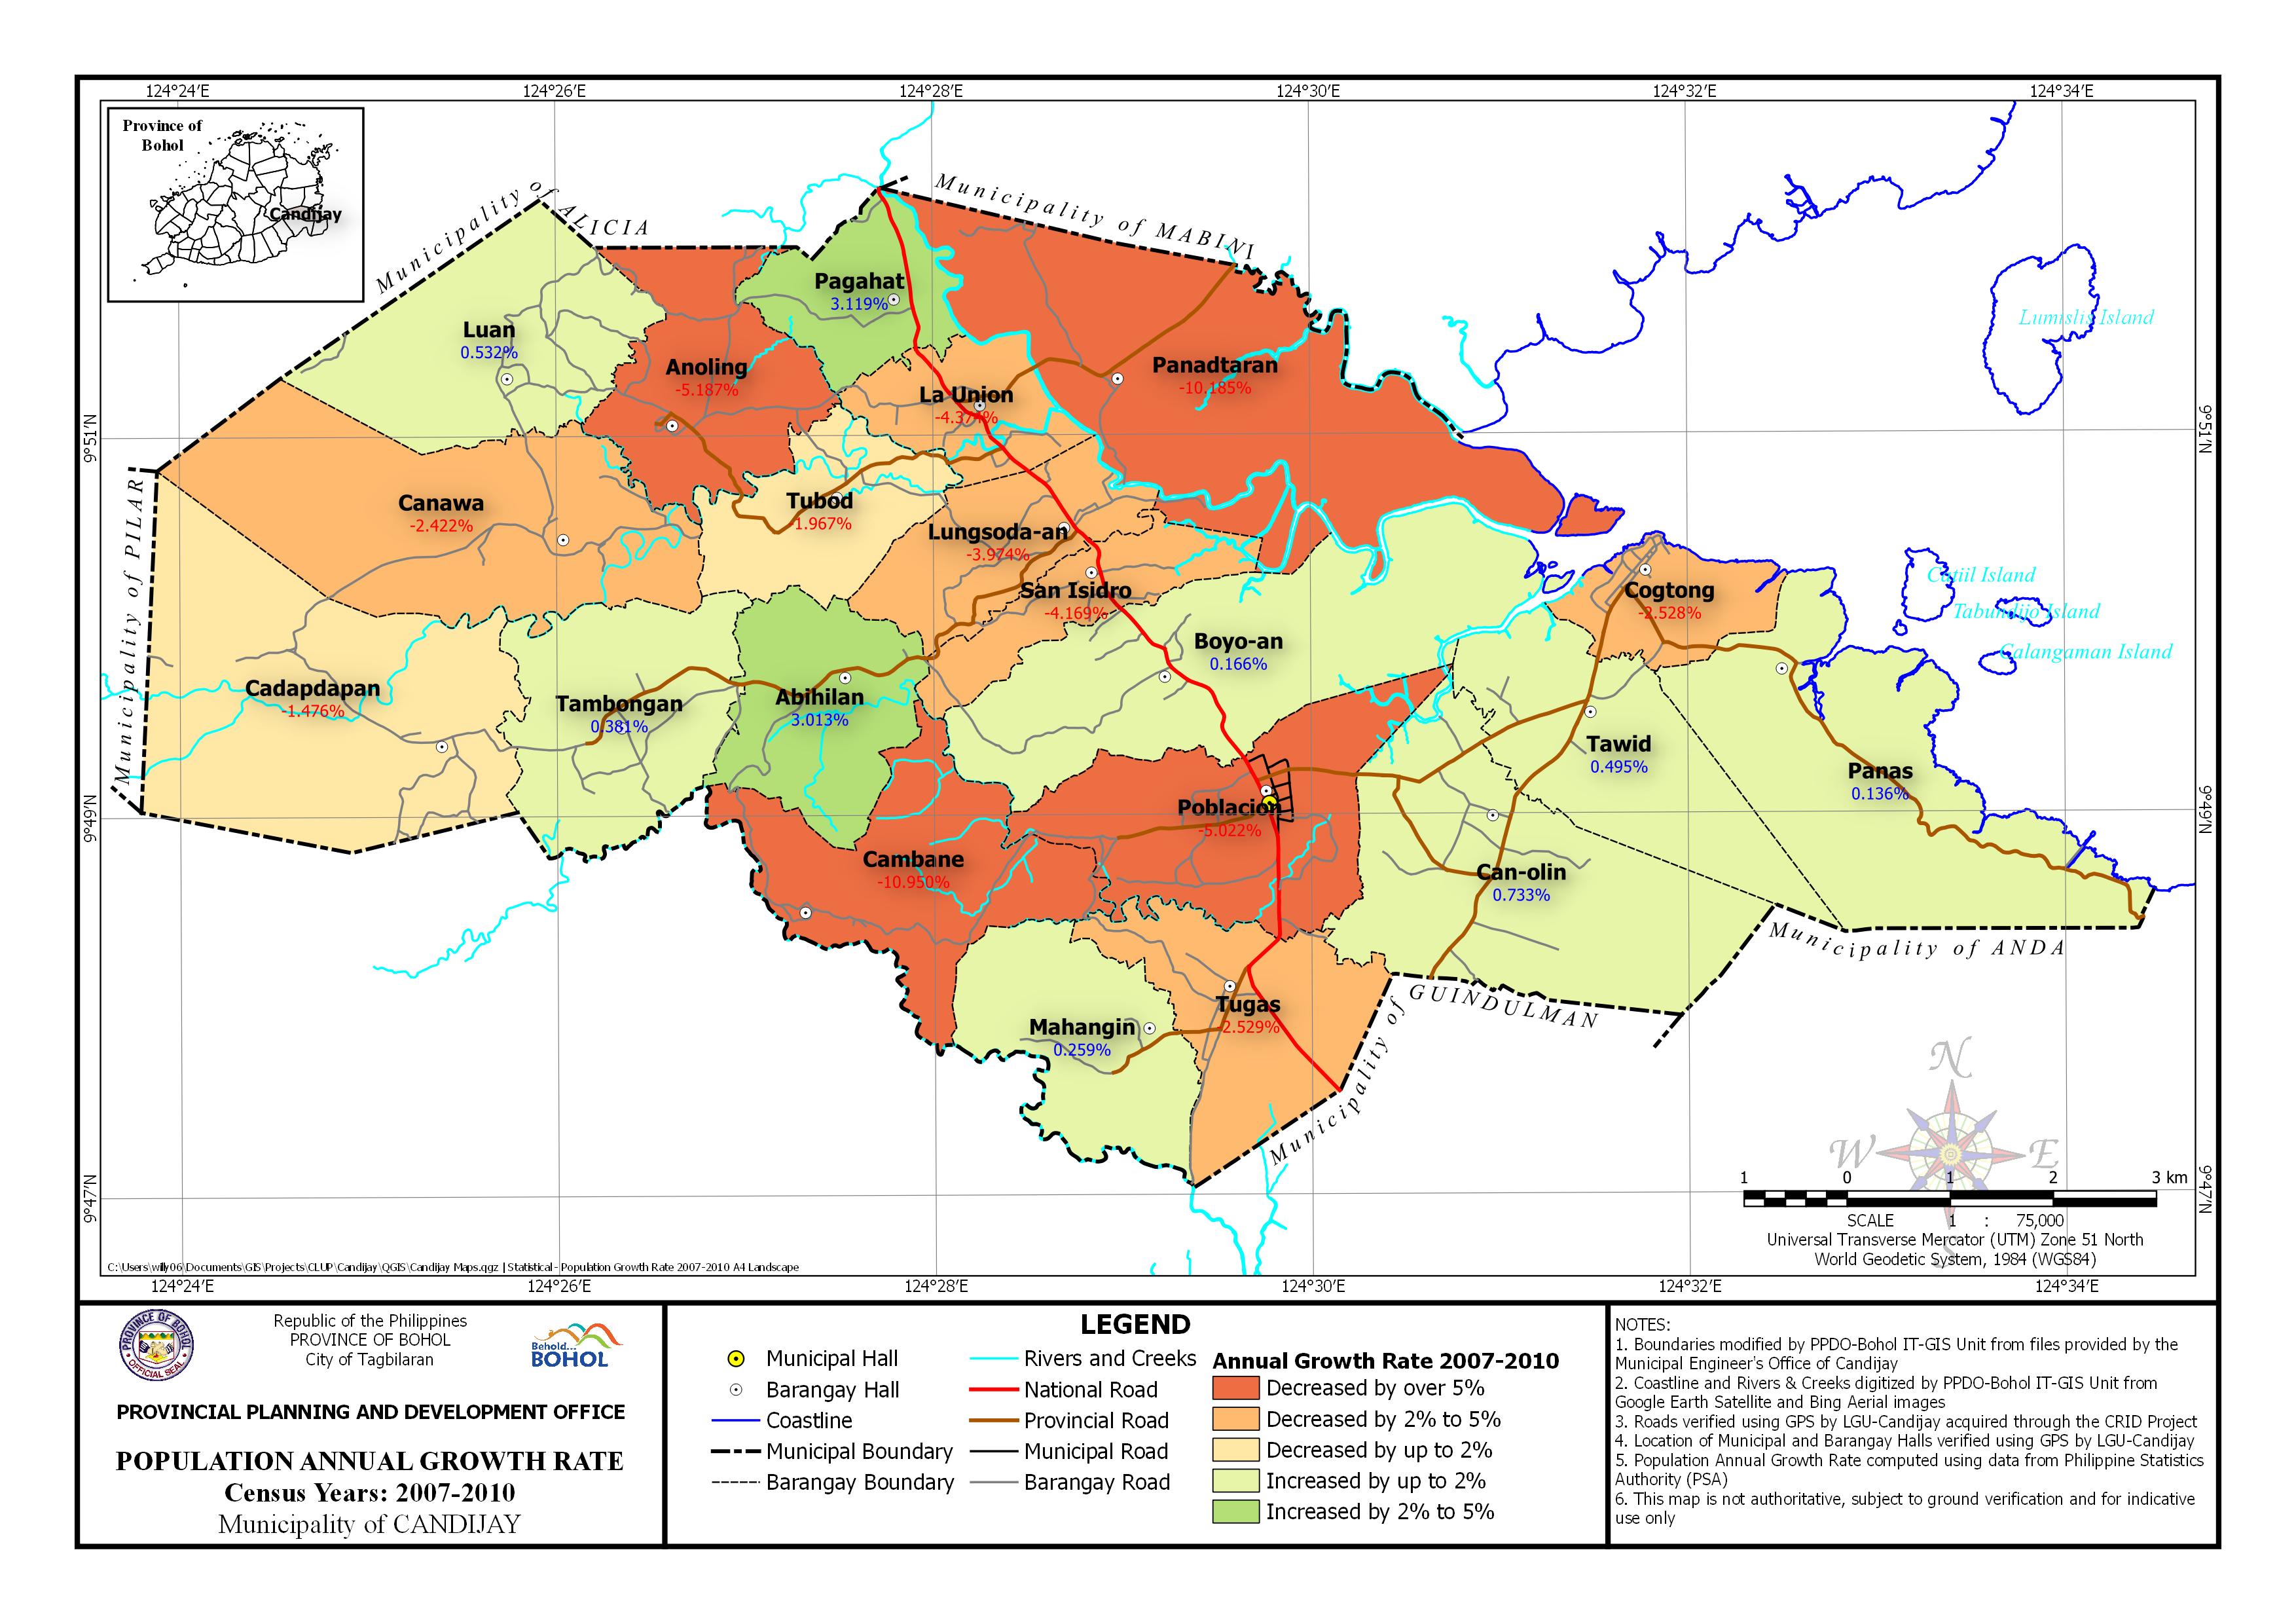 | Census Year: 2007 – 2010 Download in PDF and JPG format |
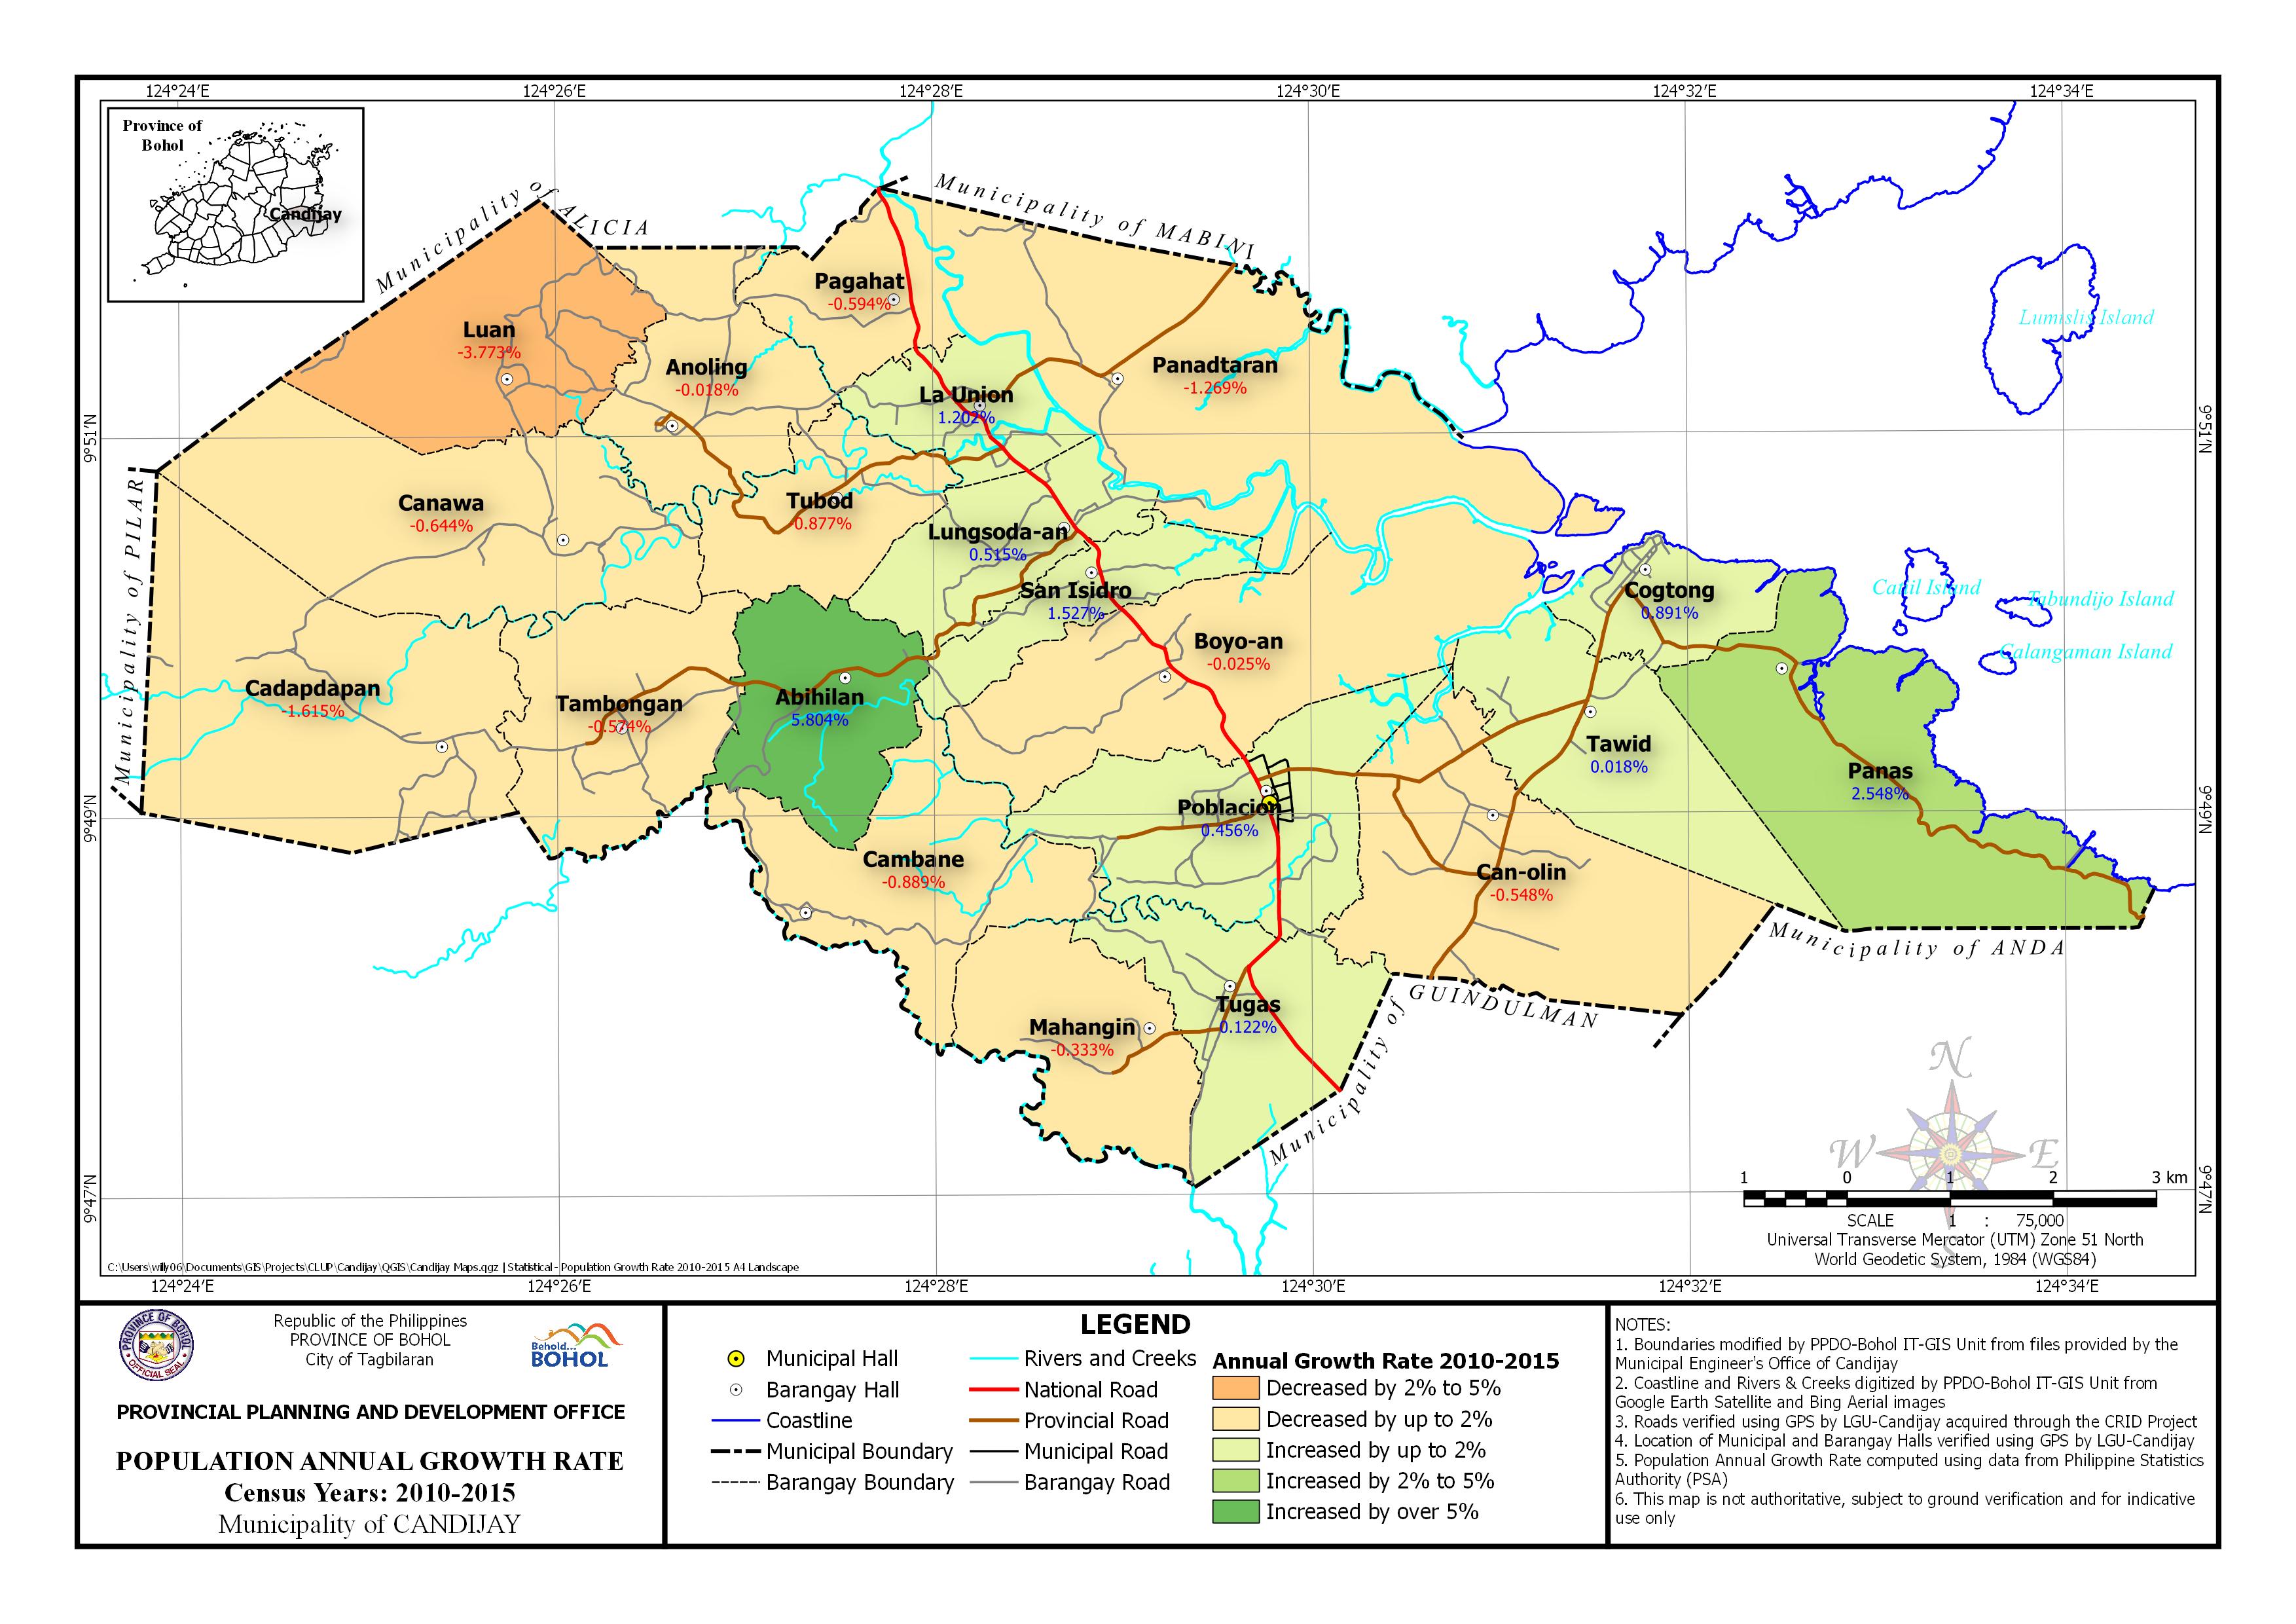 | Census Year: 2010 – 2015 Download in PDF and JPG format |
| Barangay | Census Years | ||||
| 1990-1995 | 1995-2000 | 2000-2007 | 2007-2010 | 2010-2015 | |
| Abihilan | -0.81% | 4.47% | -0.43% | 3.01% | 5.80% |
| Anoling | 1.15% | 4.70% | -0.57% | -5.19% | -0.02% |
| Boyo-an | 0.64% | 0.12% | 1.94% | 0.17% | -0.03% |
| Cadapdapan | 1.84% | 0.52% | 0.66% | -1.48% | -1.62% |
| Cambane | -3.06% | 2.69% | 1.09% | -10.95% | -0.89% |
| Can-olin | -2.85% | 3.11% | 0.32% | 0.73% | -0.55% |
| Canawa | -0.75% | 3.81% | 1.15% | -2.42% | -0.64% |
| Cogtong | -3.07% | 4.53% | -0.39% | -2.53% | 0.89% |
| La Union | 1.45% | 2.33% | 1.03% | -4.37% | 1.20% |
| Luan | -1.02% | 2.72% | 1.15% | 0.53% | -3.77% |
| Lungsoda-an | -0.43% | 3.16% | 0.51% | -3.97% | 0.52% |
| Mahangin | 3.40% | 1.98% | -0.17% | 0.26% | -0.33% |
| Pagahat | -2.89% | 6.93% | -2.37% | 3.12% | -0.59% |
| Panadtaran | -1.62% | 6.90% | 0.91% | -10.19% | -1.27% |
| Panas | -1.29% | 4.53% | 0.06% | 0.14% | 2.55% |
| Poblacion | 1.20% | 3.89% | 0.72% | -5.02% | 0.46% |
| San Isidro | 0.45% | 2.72% | -0.02% | -4.17% | 1.53% |
| Tambongan | -0.78% | 4.34% | -0.03% | 0.38% | -0.57% |
| Tawid | 0.83% | 2.99% | 1.45% | 0.50% | 0.02% |
| Tubod | 0.86% | 2.83% | -0.81% | -1.97% | -0.88% |
| Tugas | 0.95% | 2.70% | 0.07% | -2.53% | 0.12% |
| Municipal | -0.29% | 3.39% | 0.37% | -2.34% | 0.30% |