
Download in PDF and JPG format
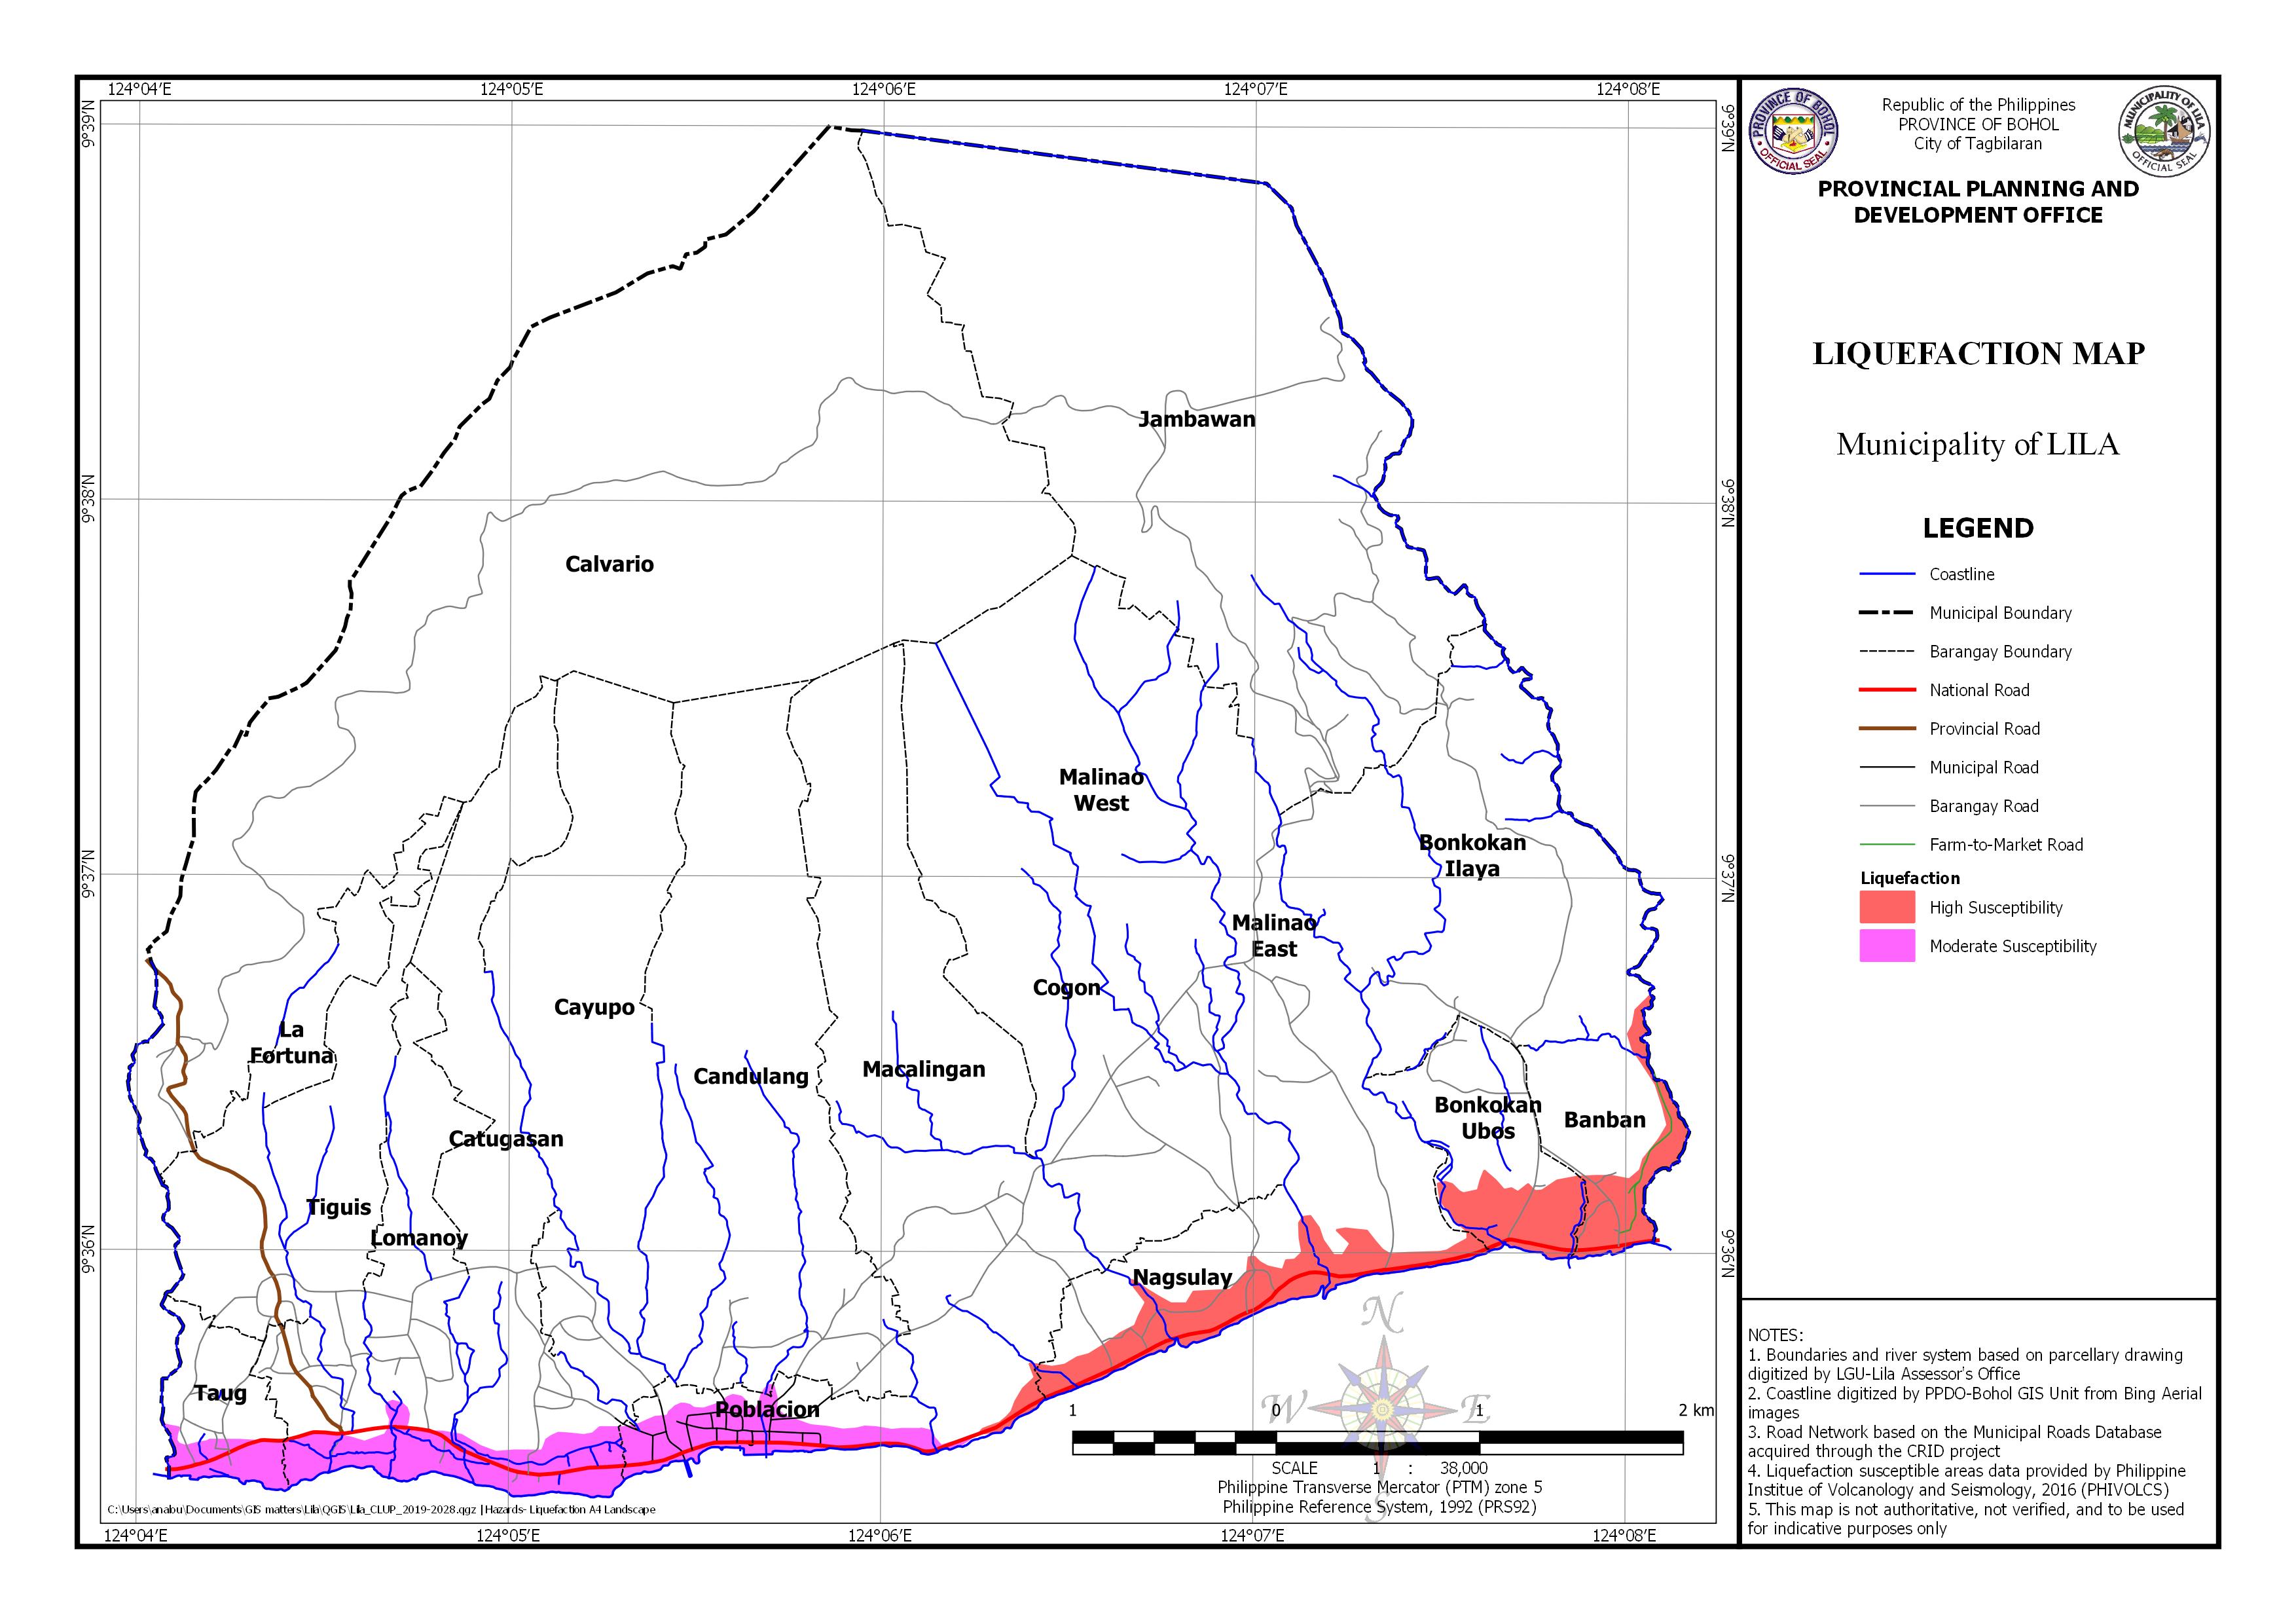
AREA EXPOSED TO LIQUEFACTION BY BARANGAY
| Barangay | Area | Area Exposed to High Susceptibilty | Area Exposed to Moderate Susceptibilty | ||
| (Hectares) | (Hectares) | Percentage | (Hectares) | Percentage | |
| Banban | 54.651 | 17.353 | 31.75% | ||
| Bonkokan Ilaya | 235.481 | 1.824 | 0.78% | ||
| Bonkokan Ubos | 66.327 | 20.245 | 30.52% | ||
| Candulang | 293.490 | 0.155 | 0.05% | ||
| Catugasan | 171.121 | 19.803 | 11.57% | ||
| Lomanoy | 85.477 | 8.711 | 10.19% | ||
| Macalingan | 283.497 | 2.626 | 0.93% | 0.508 | 0.18% |
| Malinao East | 194.783 | 11.082 | 5.69% | ||
| Nagsulay | 70.907 | 29.039 | 40.95% | ||
| Poblacion | 47.646 | 27.946 | 58.65% | ||
| Taug | 39.564 | 11.140 | 28.16% | ||
| Tiguis | 119.020 | 9.983 | 8.39% | ||
| Total | 3633.033 | 82.168 | 110.62% | 78.246 | 117.19% |