
Download in PDF and JPG format
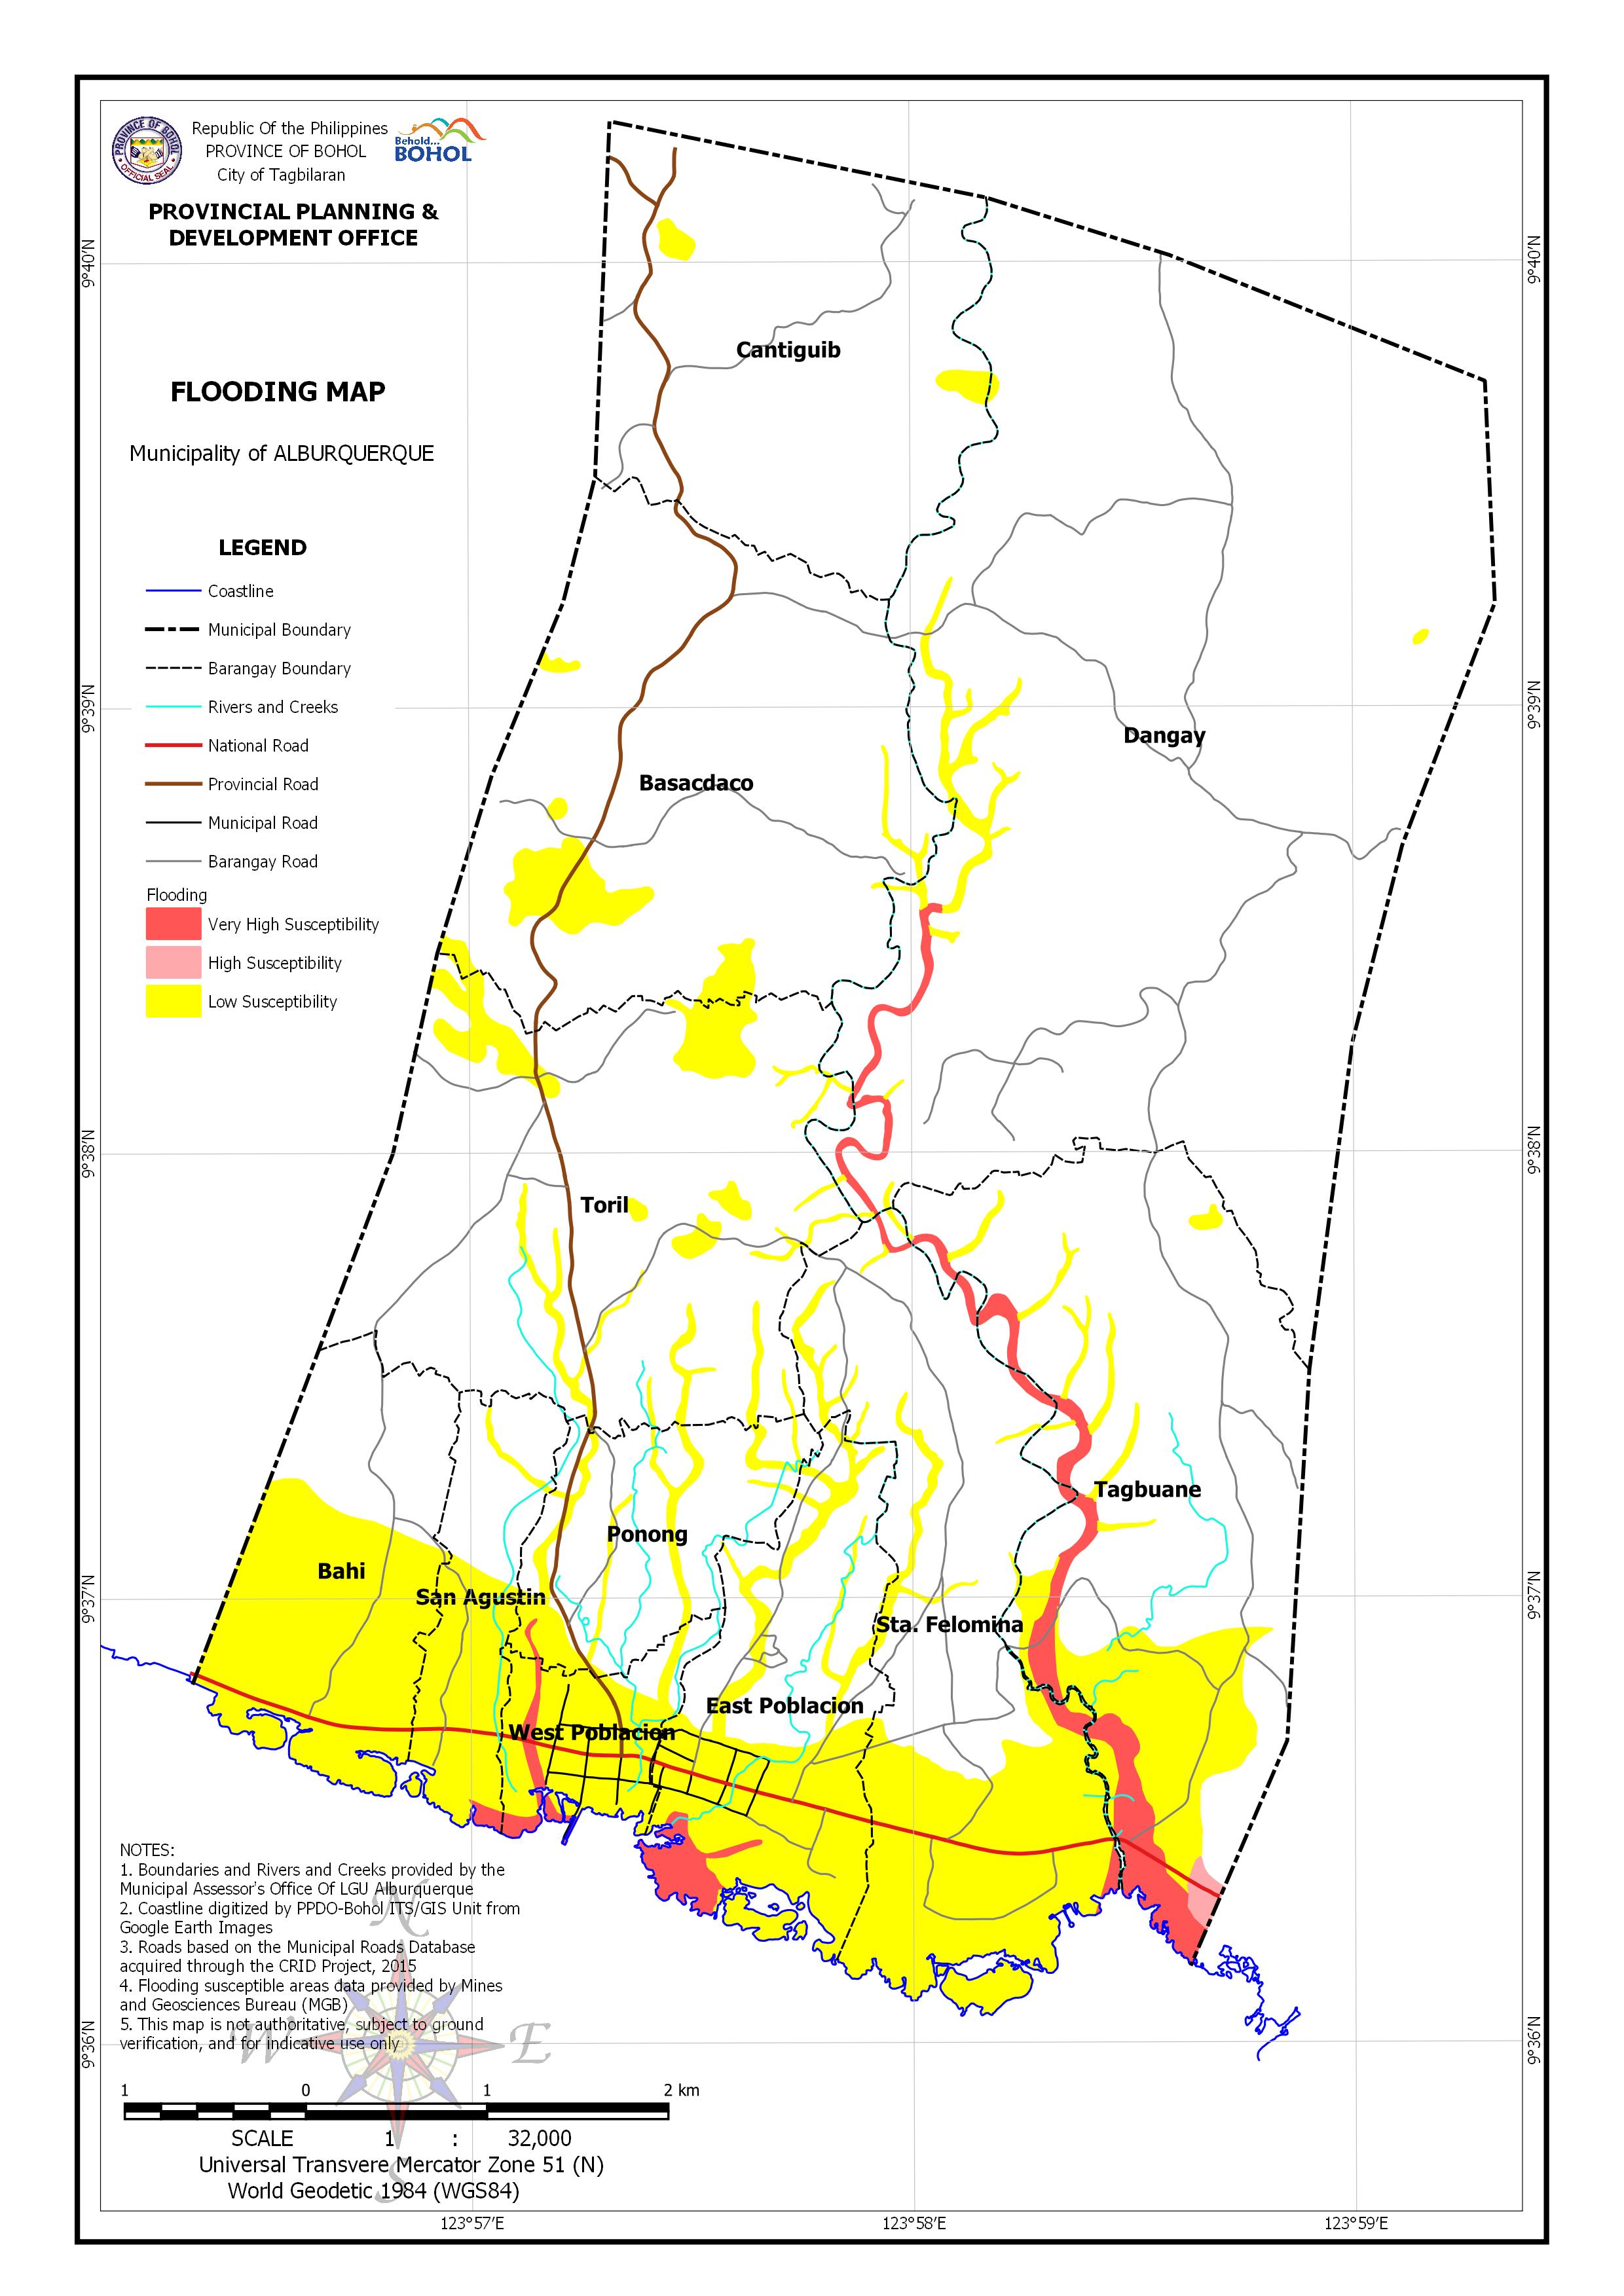
AREA EXPOSED TO FLOODING BY BARANGAY
| Barangay | Area | Area Exposed to Very High Susceptibility | Area Exposed to High Susceptibility | Area Exposed to Low Susceptibility | |||
| (Hectares) | (Hectares) | (Percentage) | (Hectares) | (Percentage) | (Hectares) | (Percentage) | |
| Bahi | 131.978 | 87.554 | 66.34% | ||||
| Basacdaco | 320.521 | 20.747 | 6.47% | ||||
| Cantiguib | 244.97 | 3.695 | 1.51% | ||||
| Dangay | 815.135 | 4.506 | 0.55% | 8.554 | 1.05% | ||
| East Poblacion | 141.696 | 8.541 | 6.03% | 68.083 | 48.05% | ||
| Ponong | 89.032 | 0.507 | 0.57% | 13.3 | 14.94% | ||
| San Agustin | 65.521 | 1.191 | 1.82% | 35.612 | 54.35% | ||
| Sta. Felomina | 242.704 | 4.986 | 2.05% | 99.681 | 41.07% | ||
| Tagbuane | 319.398 | 26.766 | 8.38% | 2.43 | 0.76% | 52.678 | 16.49% |
| Toril | 308.17 | 0.106 | 0.03% | 28.738 | 9.33% | ||
| West Poblacion | 47.003 | 4.935 | 10.50% | 35.288 | 75.08% | ||
| Total | 2,726.13 | 51.537 | 1.89% | 2.43 | 0.09% | 453.928 | 16.65% |