
Download in PDF and JPG format
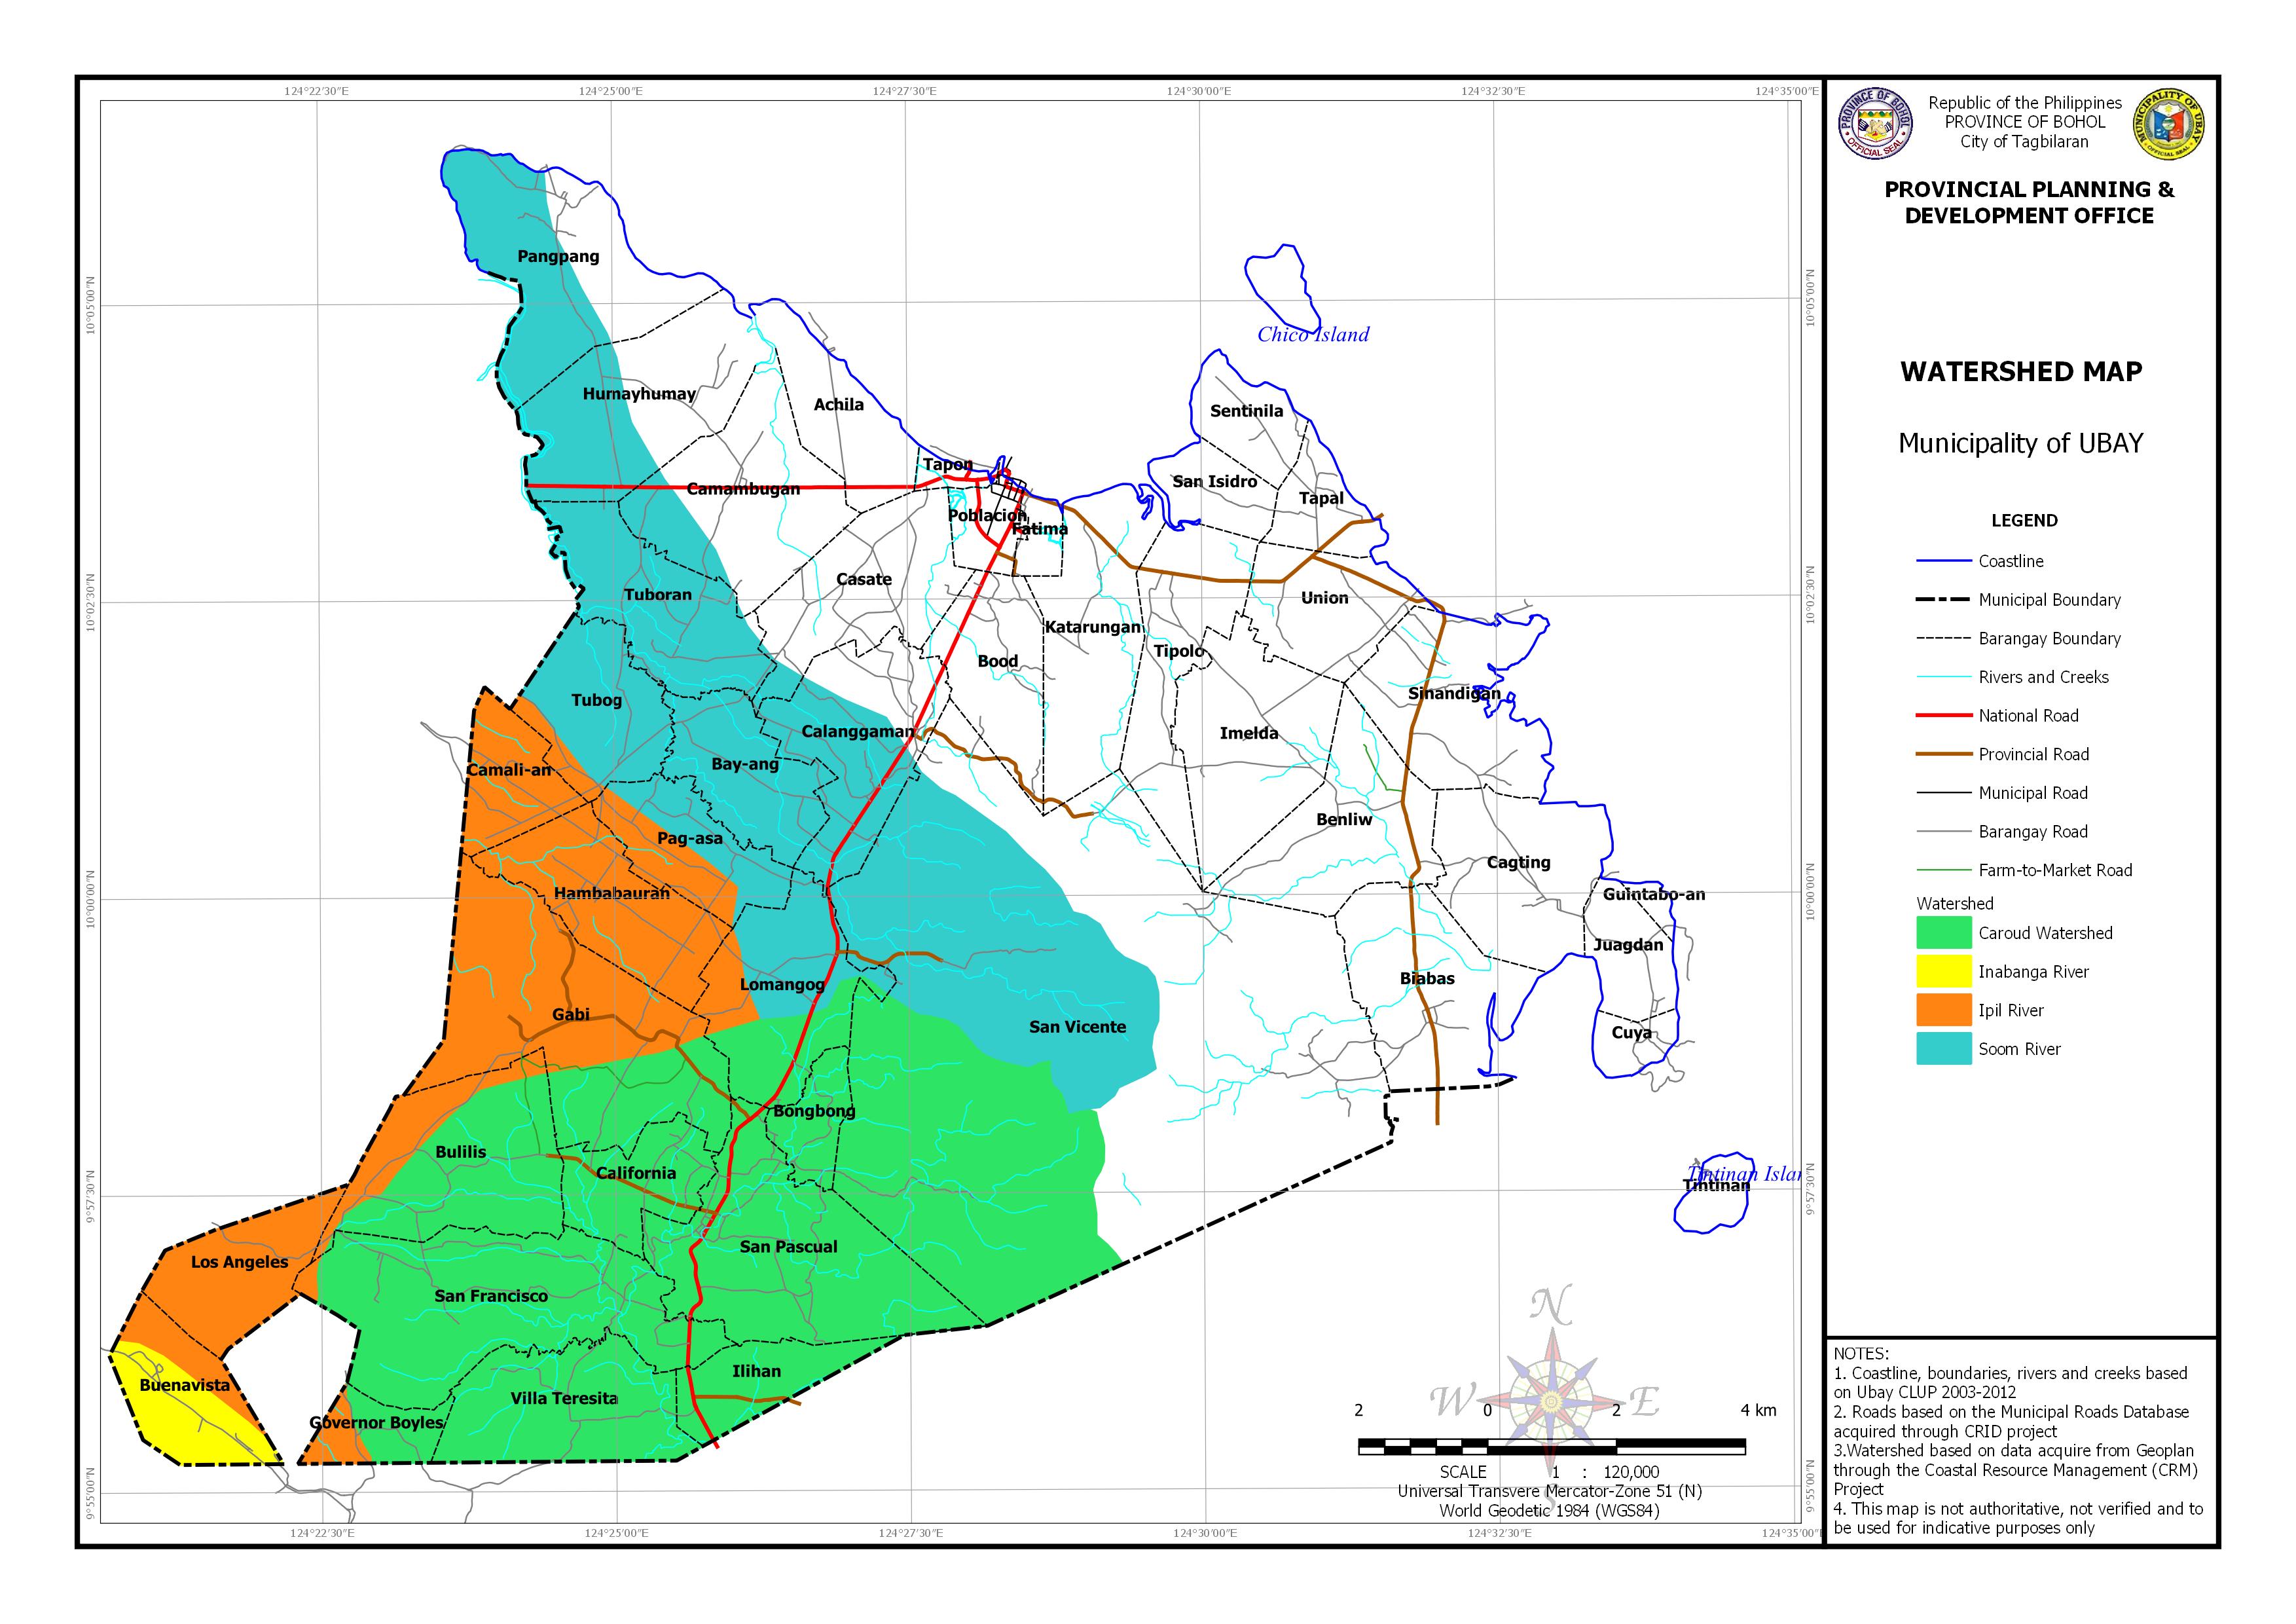
AREA EXPOSED TO WATERSHED BY BARANGAY
| Barangay | Area | Caroud Watershed | IInabanga River | Ipil River | Soom River | ||||
| (Hectares) | (Hectares) | Percentage | (Hectares) | Percentage | (Hectares) | Percentage | (Hectares) | Percentage | |
| Bay-ang | 415.145 | 415.145 | 100.00% | ||||||
| Bongbong | 171.884 | 171.884 | 100.00% | ||||||
| Buenavista | 387.243 | 262.665 | 67.83% | 124.578 | 32.17% | ||||
| Bulilis | 748.311 | 555.951 | 74.29% | 192.360 | 25.71% | ||||
| Calanggaman | 626.032 | 396.682 | 63.36% | ||||||
| California | 326.555 | 326.555 | 100.00% | ||||||
| Camali-an | 276.417 | 276.417 | 100.00% | ||||||
| Camambugan | 719.742 | 131.692 | 18.30% | ||||||
| Casate | 583.765 | 30.282 | 5.19% | ||||||
| Gabi | 1157.012 | 358.888 | 31.02% | 798.124 | 68.98% | ||||
| Governor Boyles | 187.582 | 123.483 | 65.83% | 64.097 | 34.17% | ||||
| Guintabo-an | 34.340 | ||||||||
| Hambabauran | 529.788 | 529.771 | 100.00% | 0.017 | 0.00% | ||||
| Humayhumay | 739.160 | 349.792 | 47.32% | ||||||
| Ilihan | 276.900 | 276.900 | 100.00% | ||||||
| Lomangog | 619.483 | 237.219 | 38.29% | 87.800 | 14.17% | 294.464 | 47.53% | ||
| Los Angeles | 402.969 | 402.969 | 100.00% | ||||||
| Pag-asa | 384.338 | 168.784 | 43.92% | 215.555 | 56.09% | ||||
| Pangpang | 802.227 | 487.943 | 60.82% | ||||||
| San Francisco | 1124.516 | 1108.712 | 98.60% | 15.804 | 1.41% | ||||
| San Pascual | 995.168 | 995.168 | 100.00% | ||||||
| San Vicente | 5232.845 | 1470.001 | 28.09% | 1402.791 | 26.81% | ||||
| Tubog | 451.619 | 55.275 | 12.24% | 396.344 | 87.76% | ||||
| Tuboran | 559.370 | 550.899 | 98.49% | ||||||
| Villa Teresita | 611.564 | 611.564 | 100.00% | ||||||
| Total | 25218.055 | 6236.326 | 836.12% | 262.665 | 67.83% | 2715.979 | 532.76% | 4671.604 | 611.67% |