
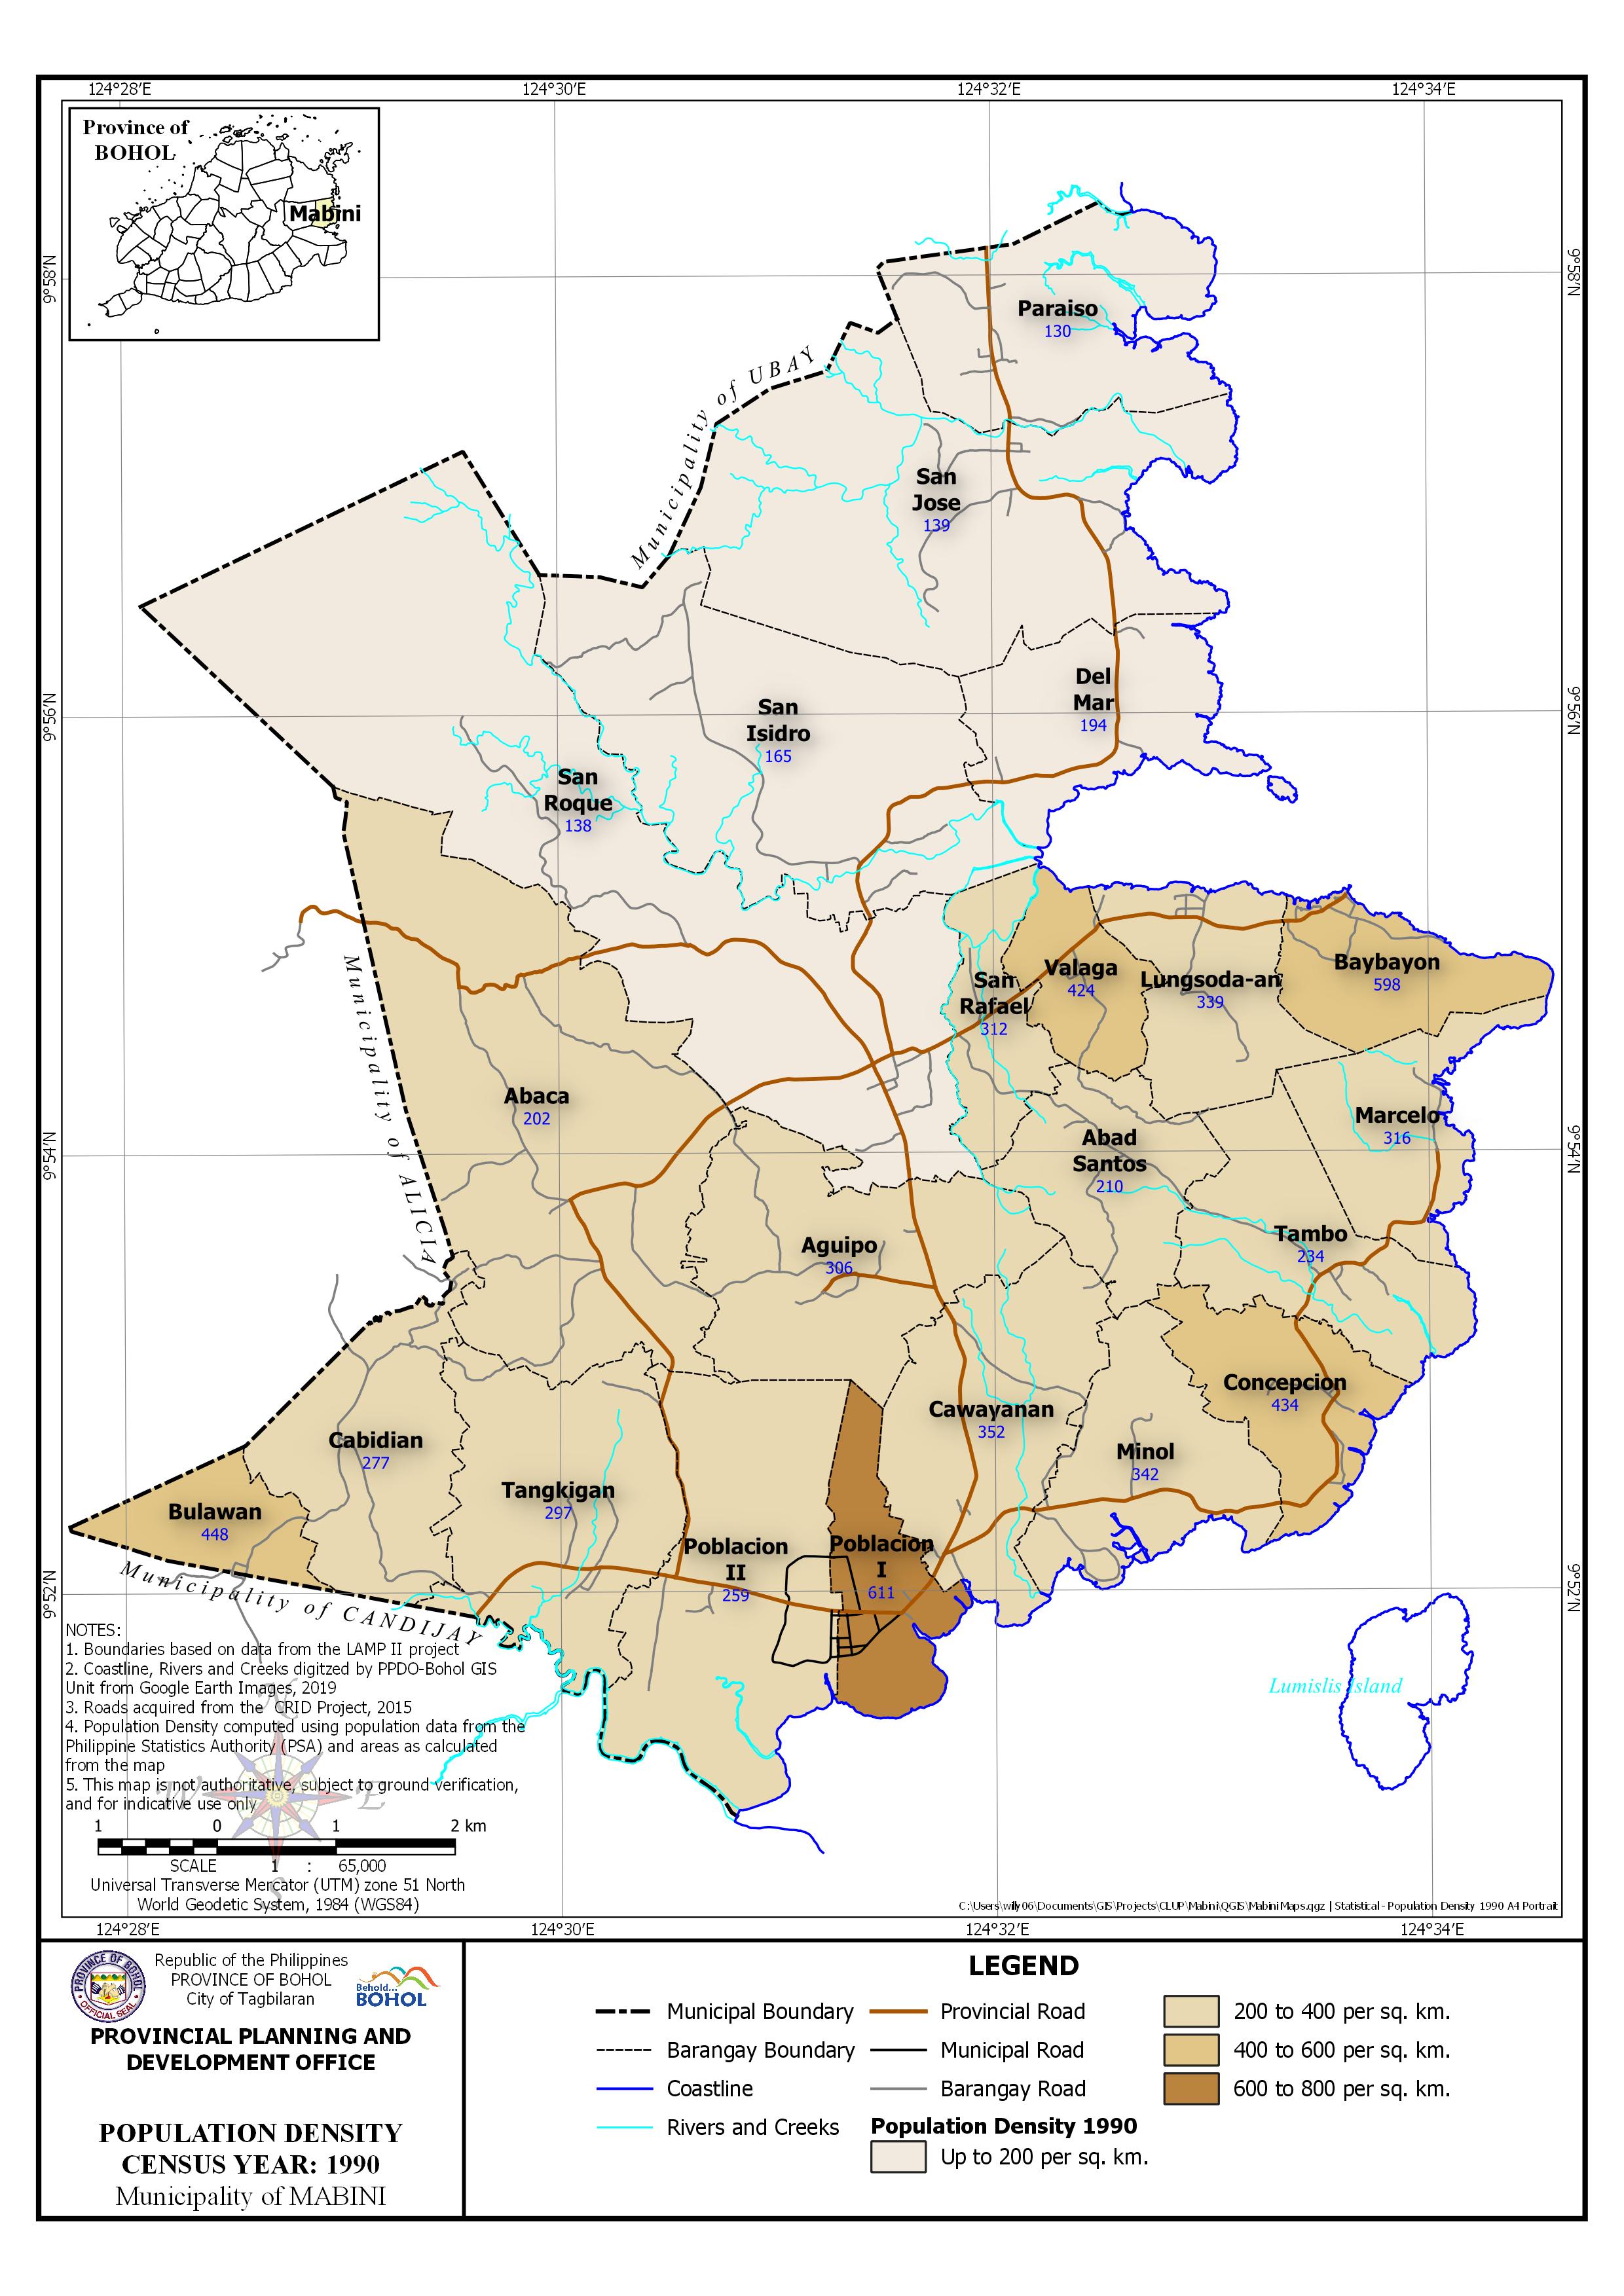
 | Census Year: 1990 Download in PDF and JPG format |
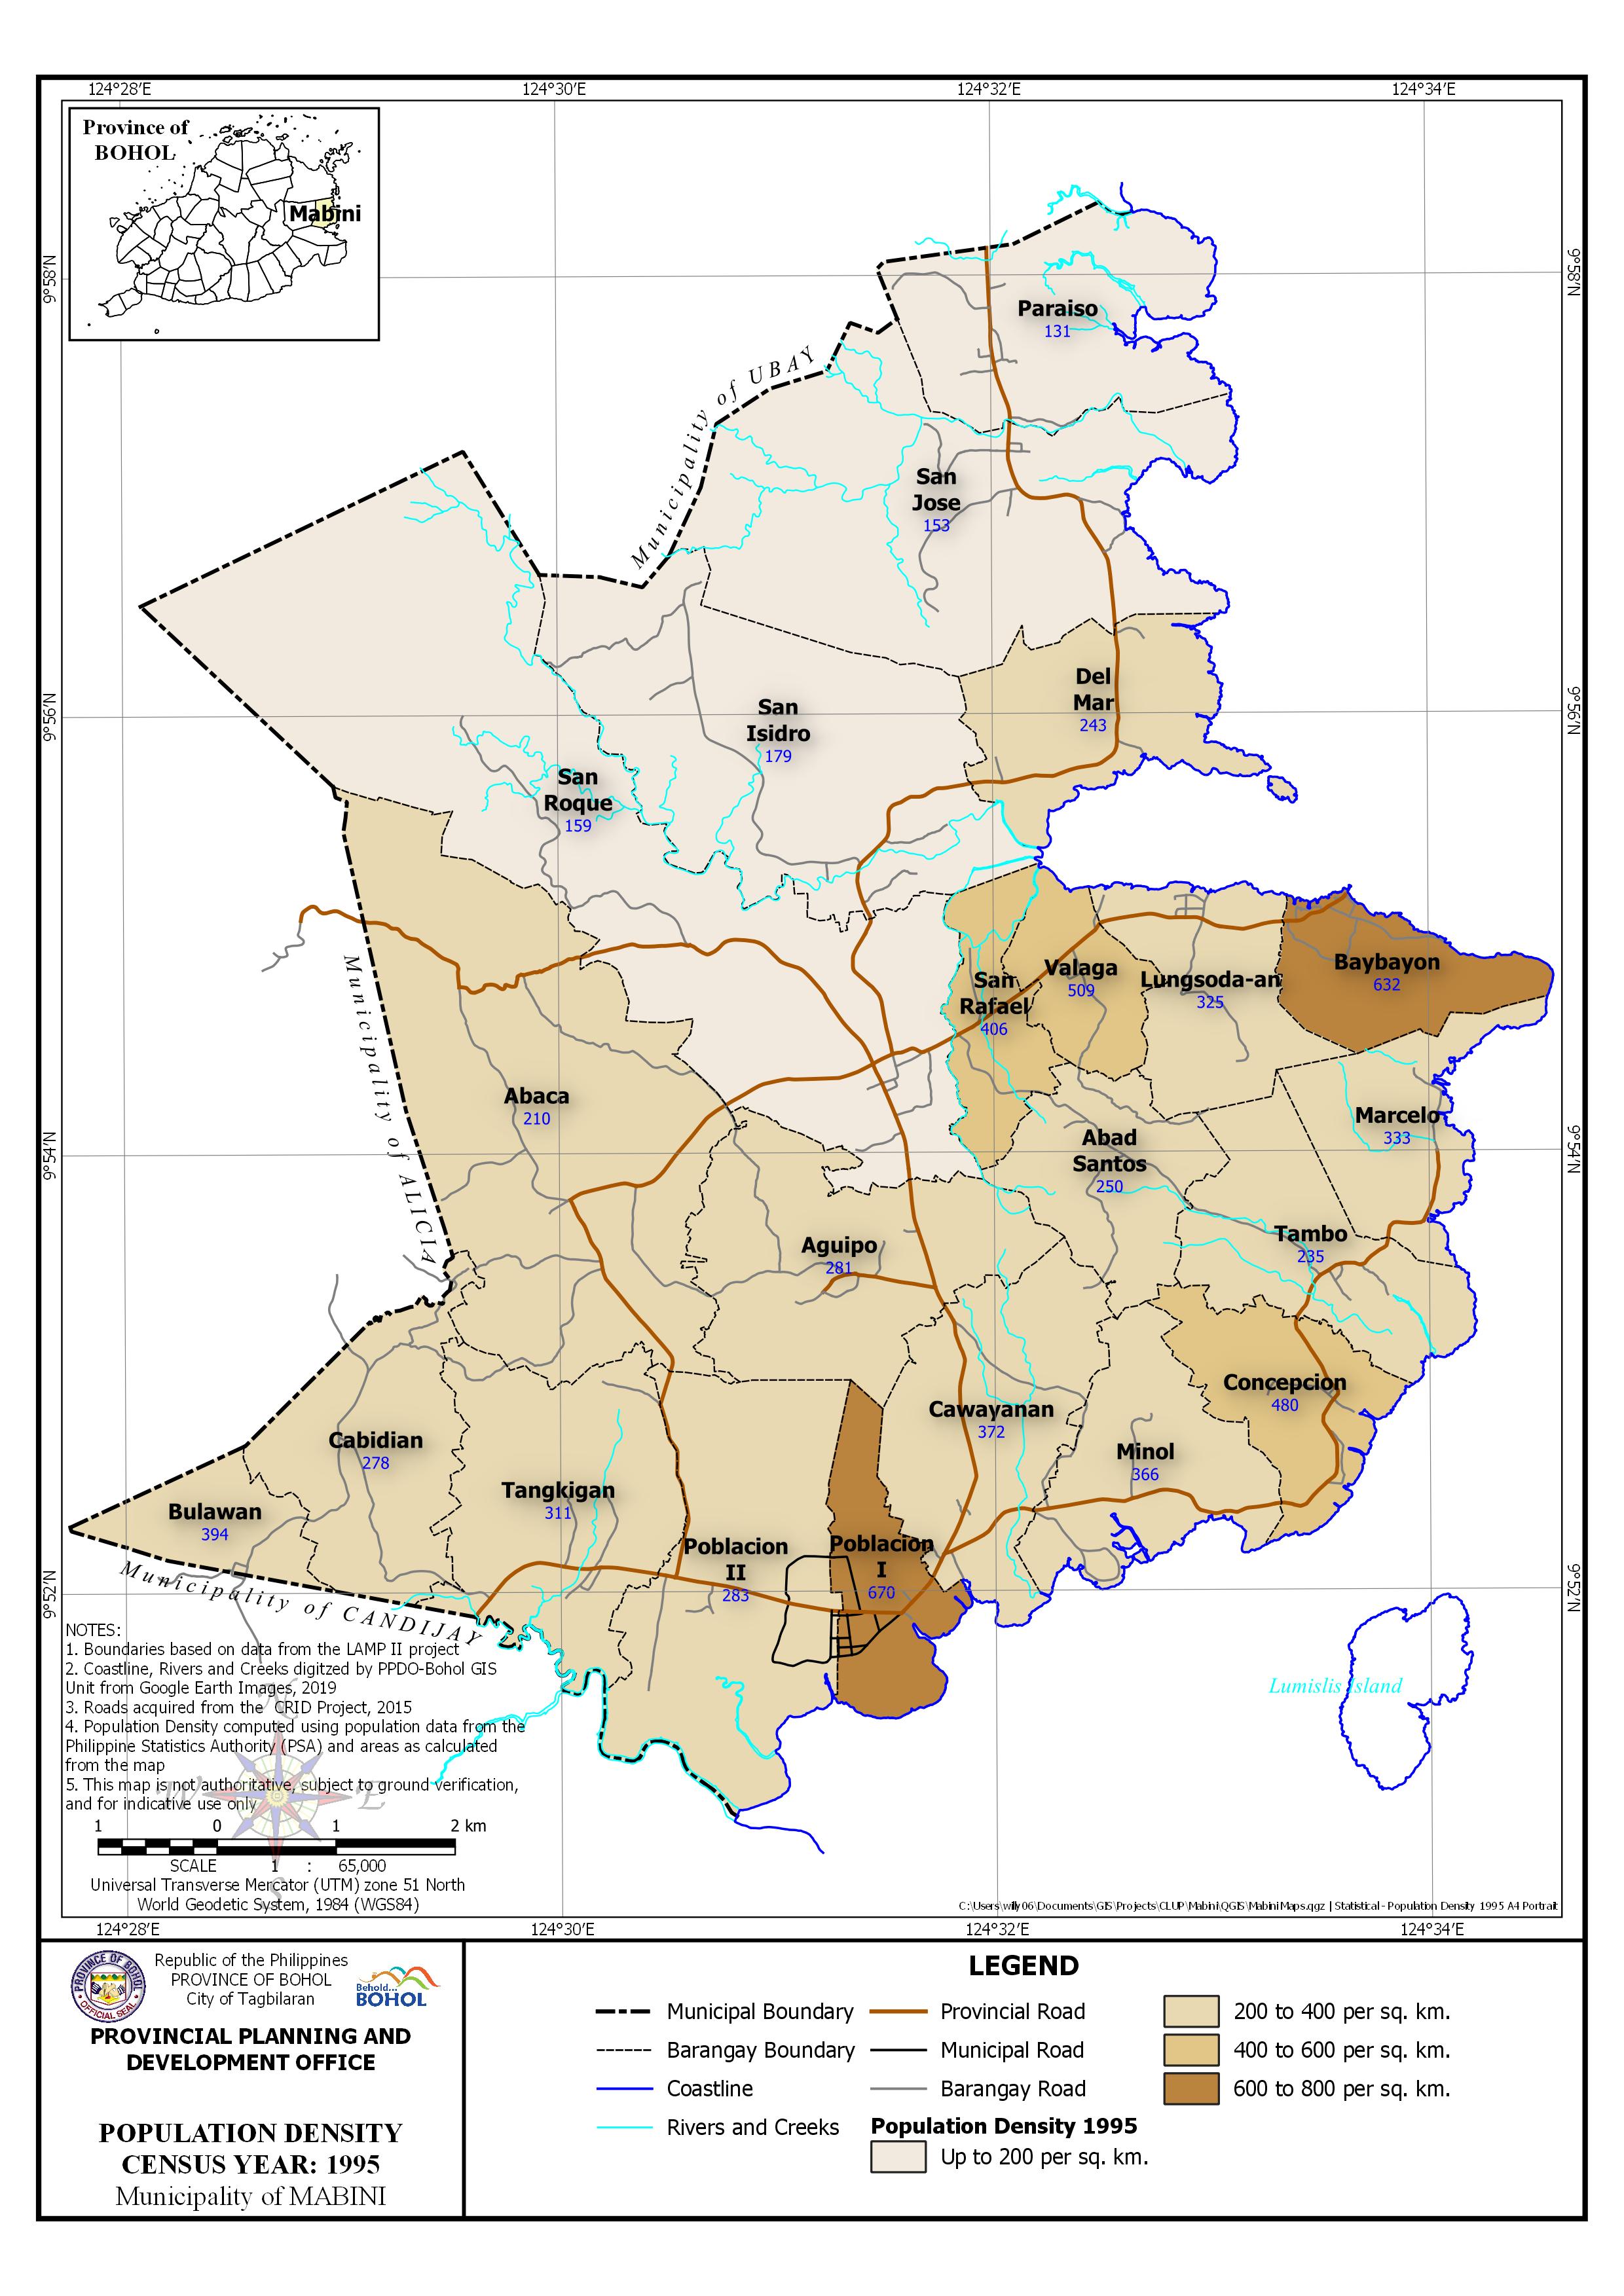 | Census Year: 1995 Download in PDF and JPG format |
 | Census Year: 2000 Download in PDF and JPG format |
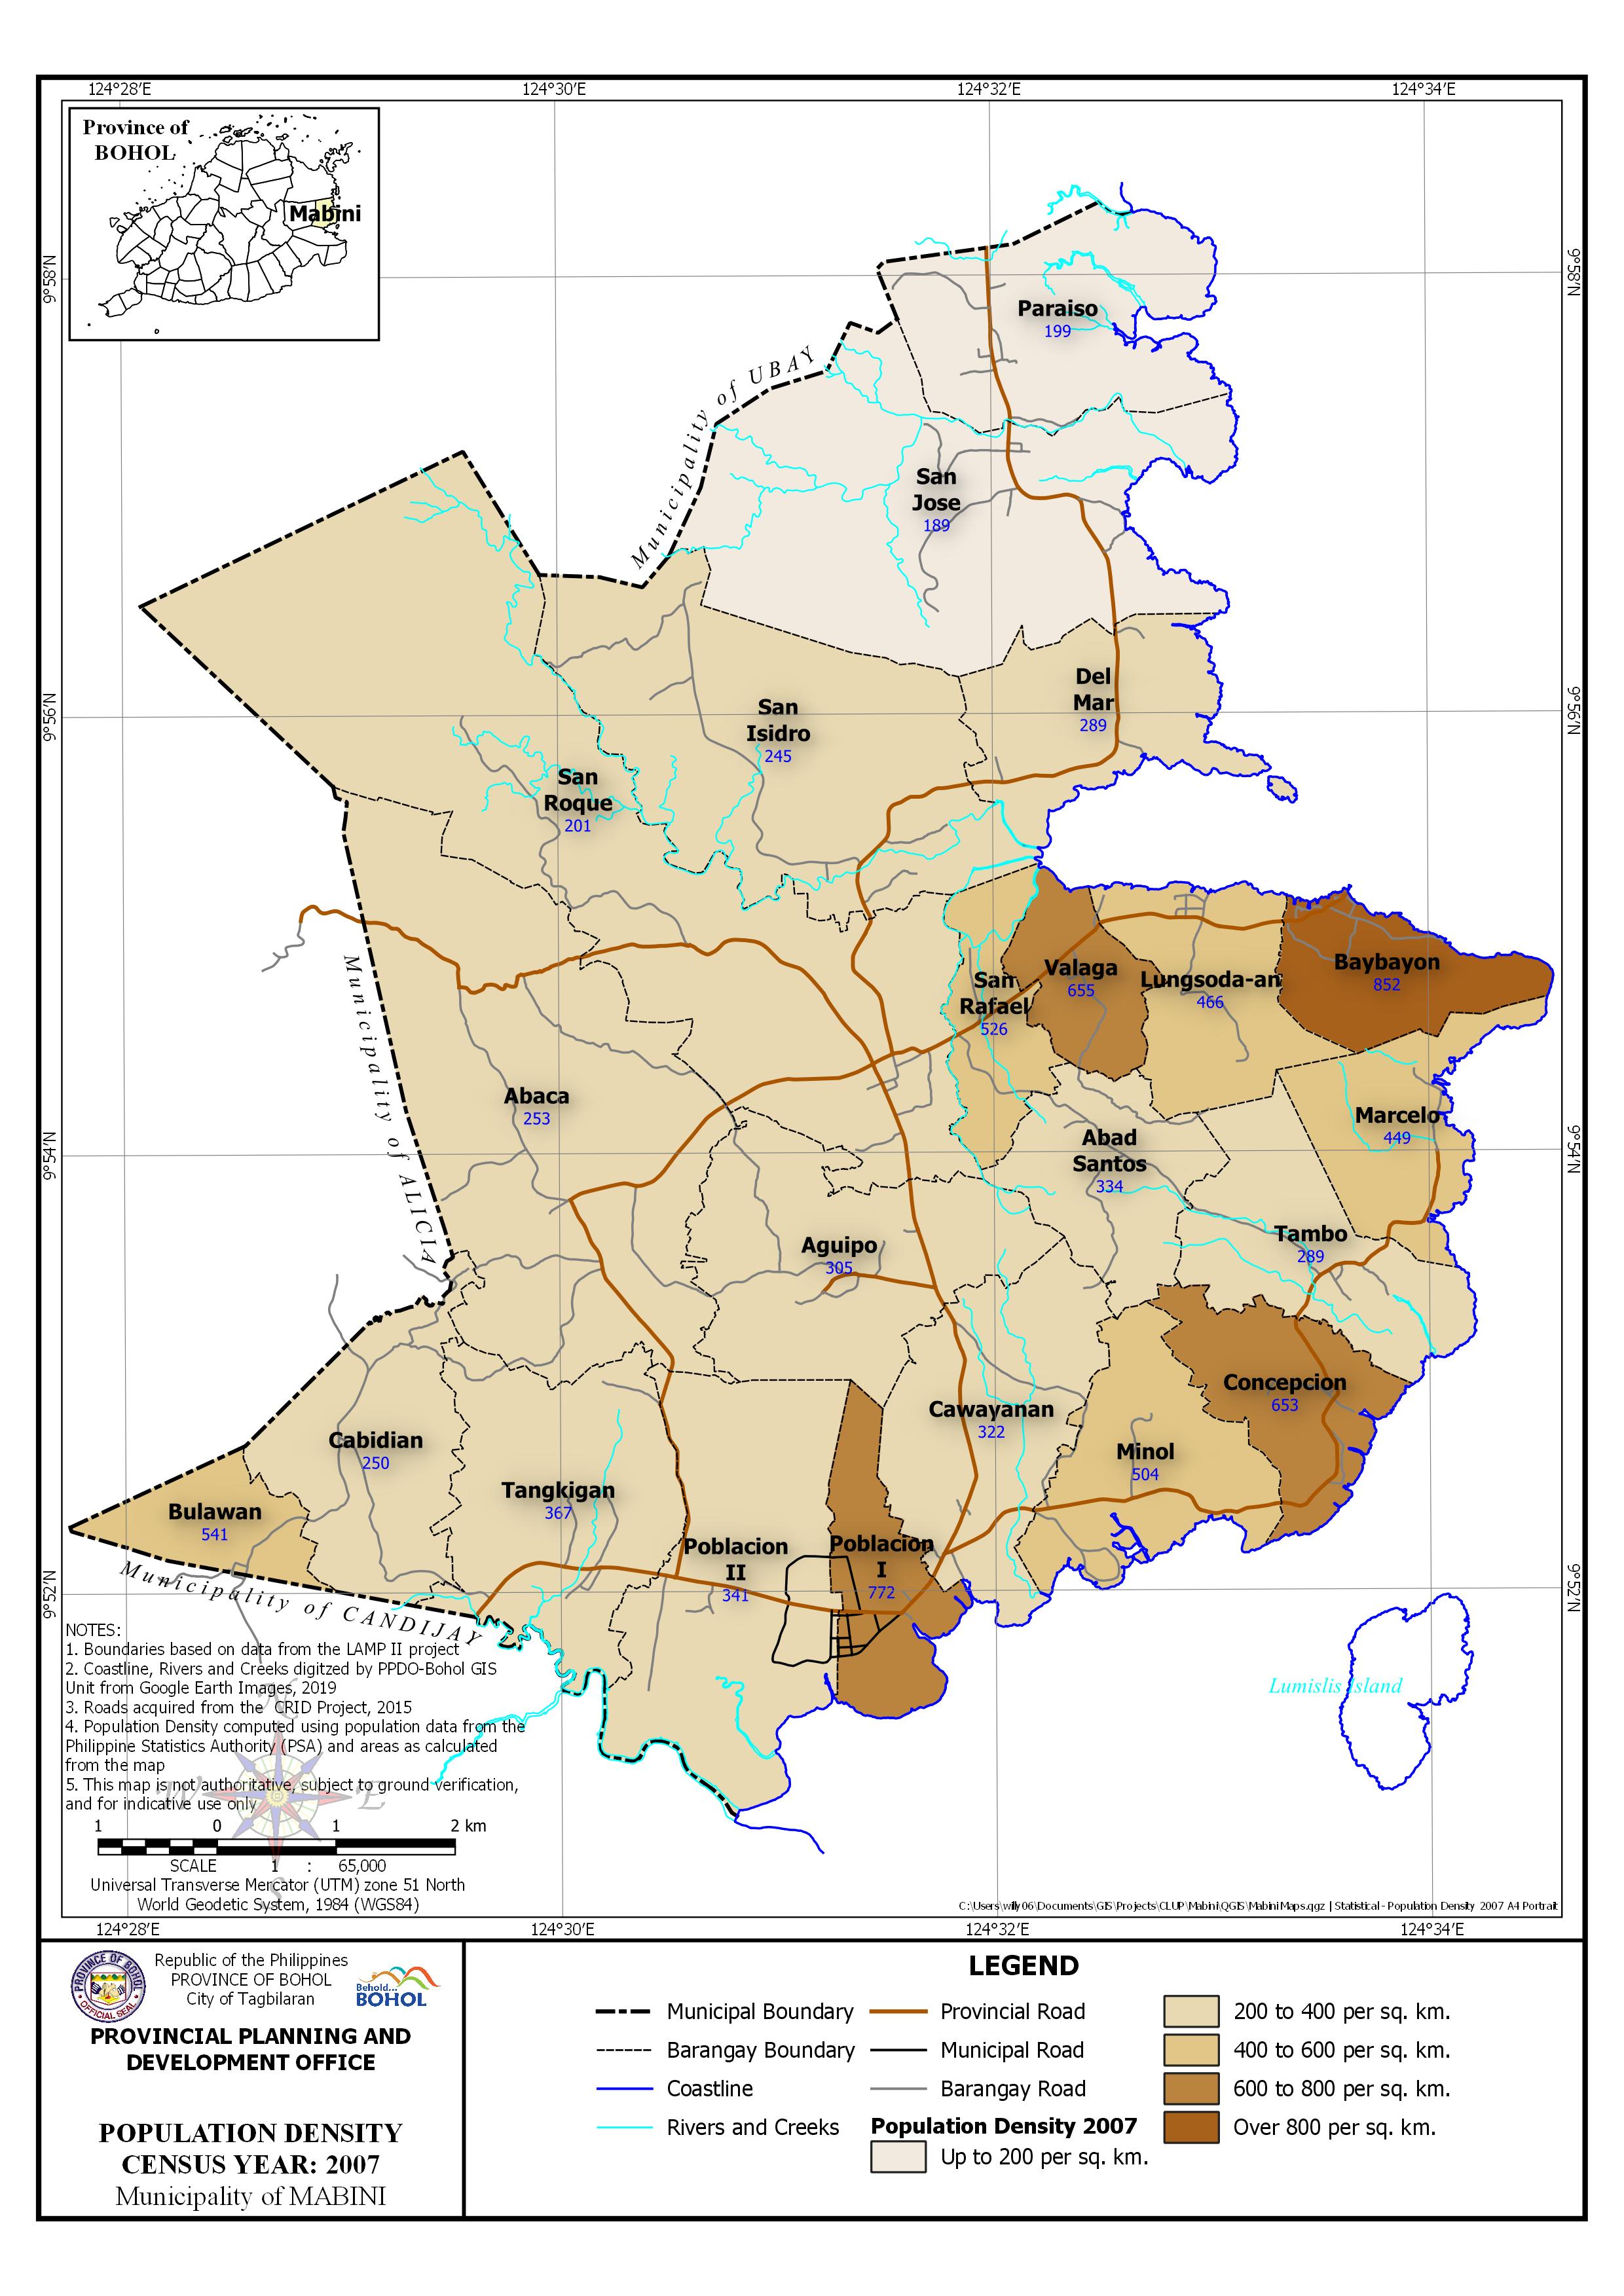 | Census Year: 2007 Download in PDF and JPG format |
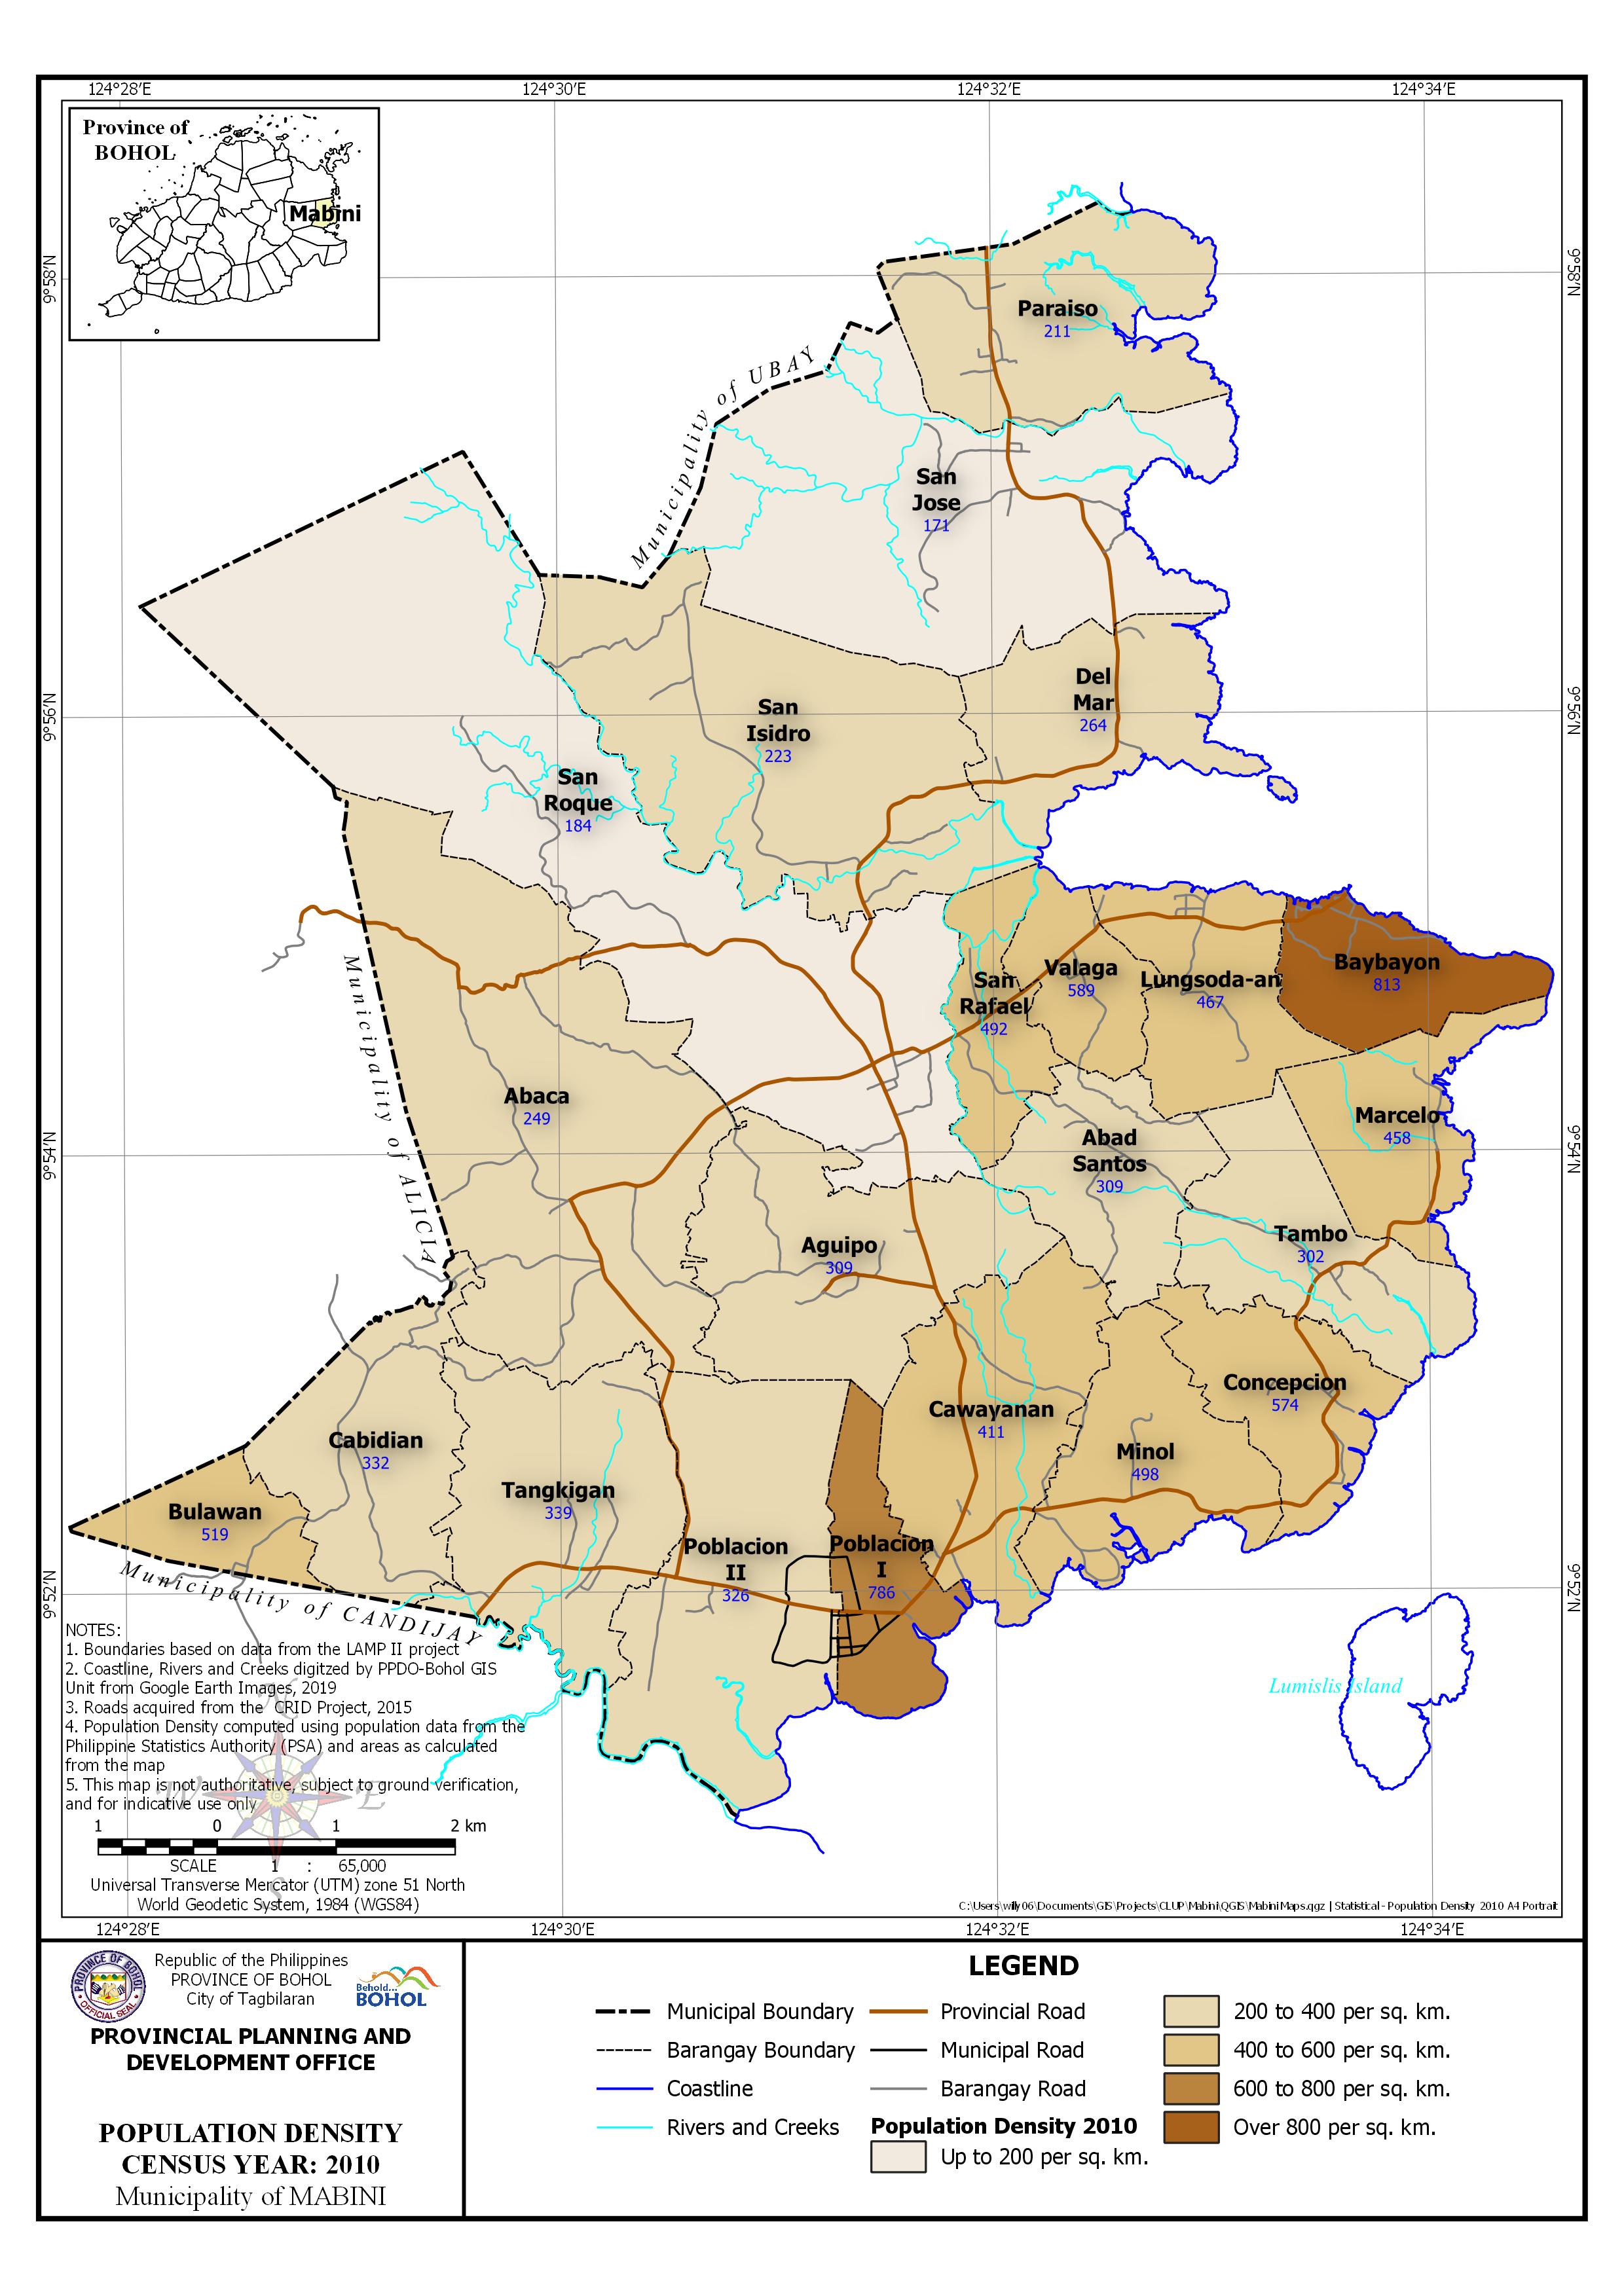 | Census Year: 2010 Download in PDF and JPG format |
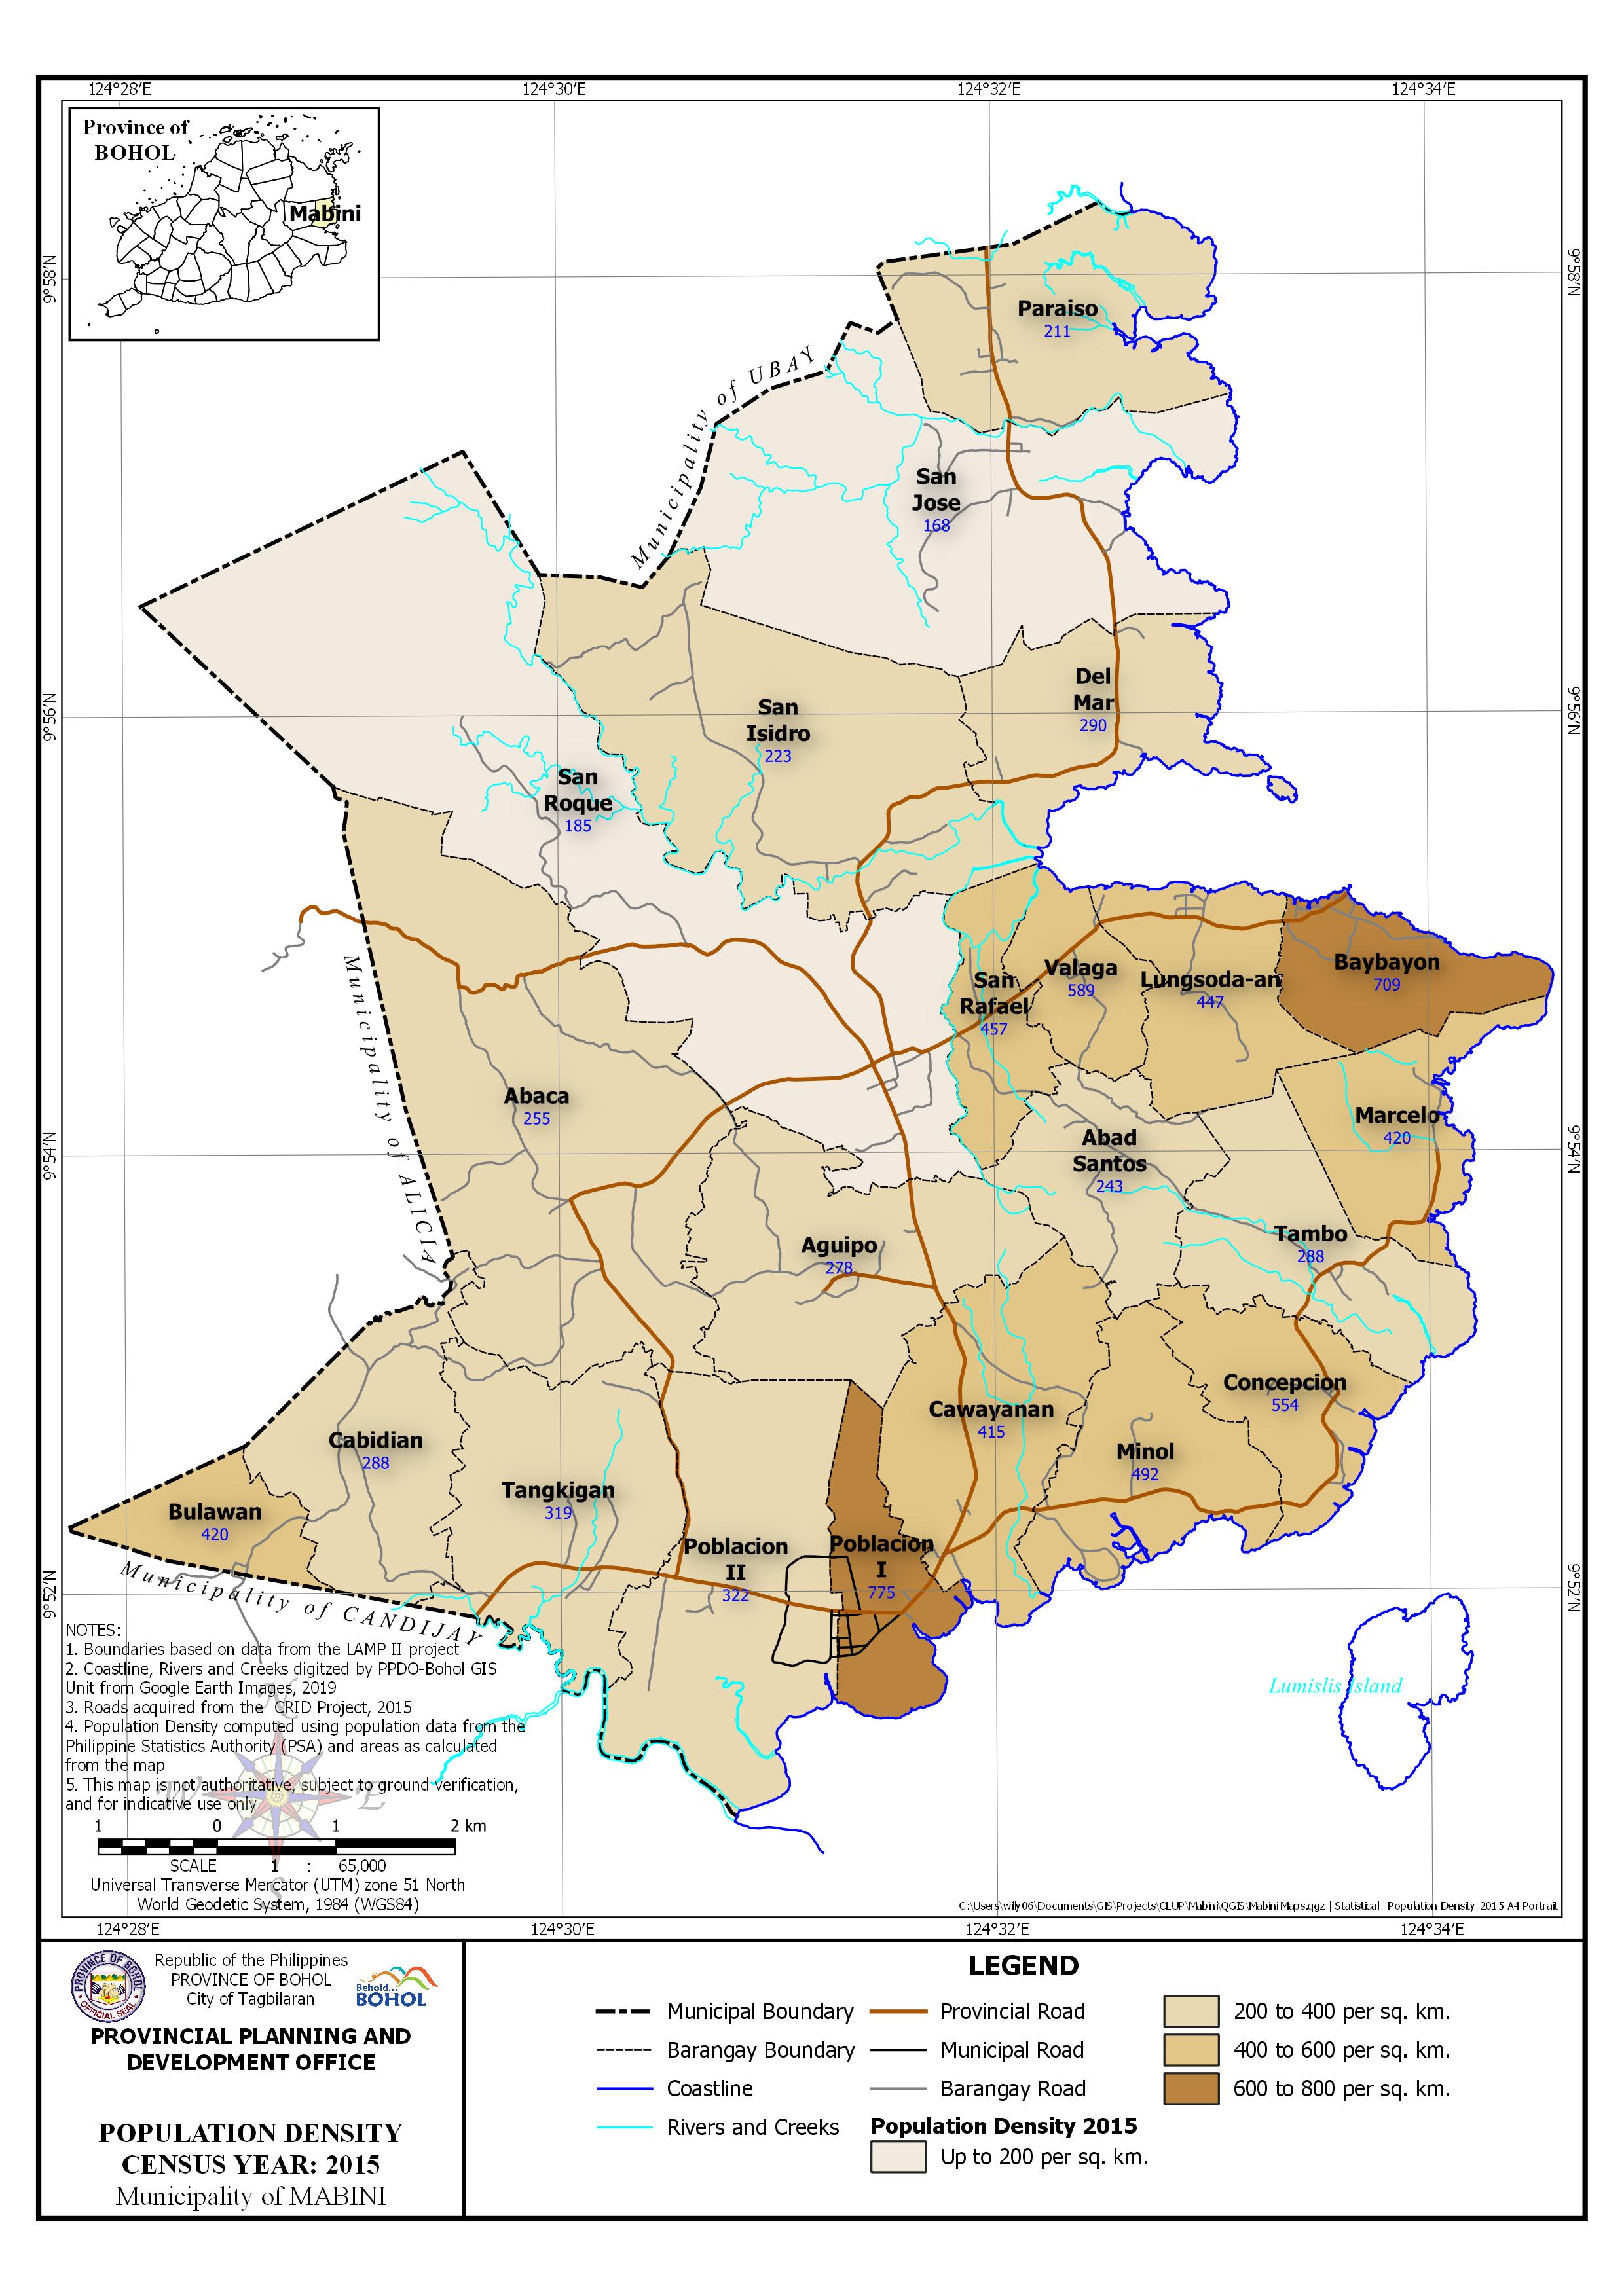 | Census Year: 2015 Download in PDF and JPG format |
| Barangay | Area | Census Year | |||||
| Hectares | 1990 | 1995 | 2000 | 2007 | 2010 | 2015 | |
| Abaca | 944.471 | 202 | 210 | 236 | 253 | 249 | 255 |
| Abad Santos | 232.914 | 210 | 250 | 280 | 334 | 309 | 243 |
| Aguipo | 442.045 | 306 | 281 | 346 | 305 | 309 | 278 |
| Baybayon | 185.445 | 598 | 632 | 816 | 852 | 813 | 709 |
| Bulawan | 126.765 | 448 | 394 | 499 | 541 | 519 | 420 |
| Cabidian | 313.637 | 277 | 278 | 345 | 250 | 332 | 288 |
| Cawayanan | 377.966 | 352 | 372 | 432 | 322 | 411 | 415 |
| Concepcion | 219.29 | 434 | 480 | 591 | 653 | 574 | 554 |
| Del Mar | 286.973 | 194 | 243 | 238 | 289 | 264 | 290 |
| Lungsoda-an | 241.967 | 339 | 325 | 434 | 466 | 467 | 447 |
| Marcelo | 218.321 | 316 | 333 | 429 | 449 | 458 | 420 |
| Minol | 284.162 | 342 | 366 | 486 | 504 | 498 | 492 |
| Paraiso | 388.851 | 130 | 131 | 159 | 199 | 211 | 211 |
| Poblacion I | 181.389 | 611 | 670 | 743 | 772 | 786 | 775 |
| Poblacion II | 519.893 | 259 | 283 | 319 | 341 | 326 | 322 |
| San Isidro | 733.392 | 165 | 179 | 197 | 245 | 223 | 223 |
| San Jose | 834.795 | 139 | 153 | 178 | 189 | 171 | 168 |
| San Rafael | 149.486 | 312 | 406 | 454 | 526 | 492 | 457 |
| San Roque | 1,376.05 | 138 | 159 | 174 | 201 | 184 | 185 |
| Tambo | 303.148 | 234 | 235 | 253 | 289 | 302 | 288 |
| Tangkigan | 423.821 | 297 | 311 | 338 | 367 | 339 | 319 |
| Valaga | 135.718 | 424 | 509 | 597 | 655 | 589 | 589 |
| Lumislis Island | 114.701 | ||||||
| MUNICIPAL | 9,035.19 | 242 | 259 | 302 | 319 | 312 | 301 |