
Download in PDF or in JPG format
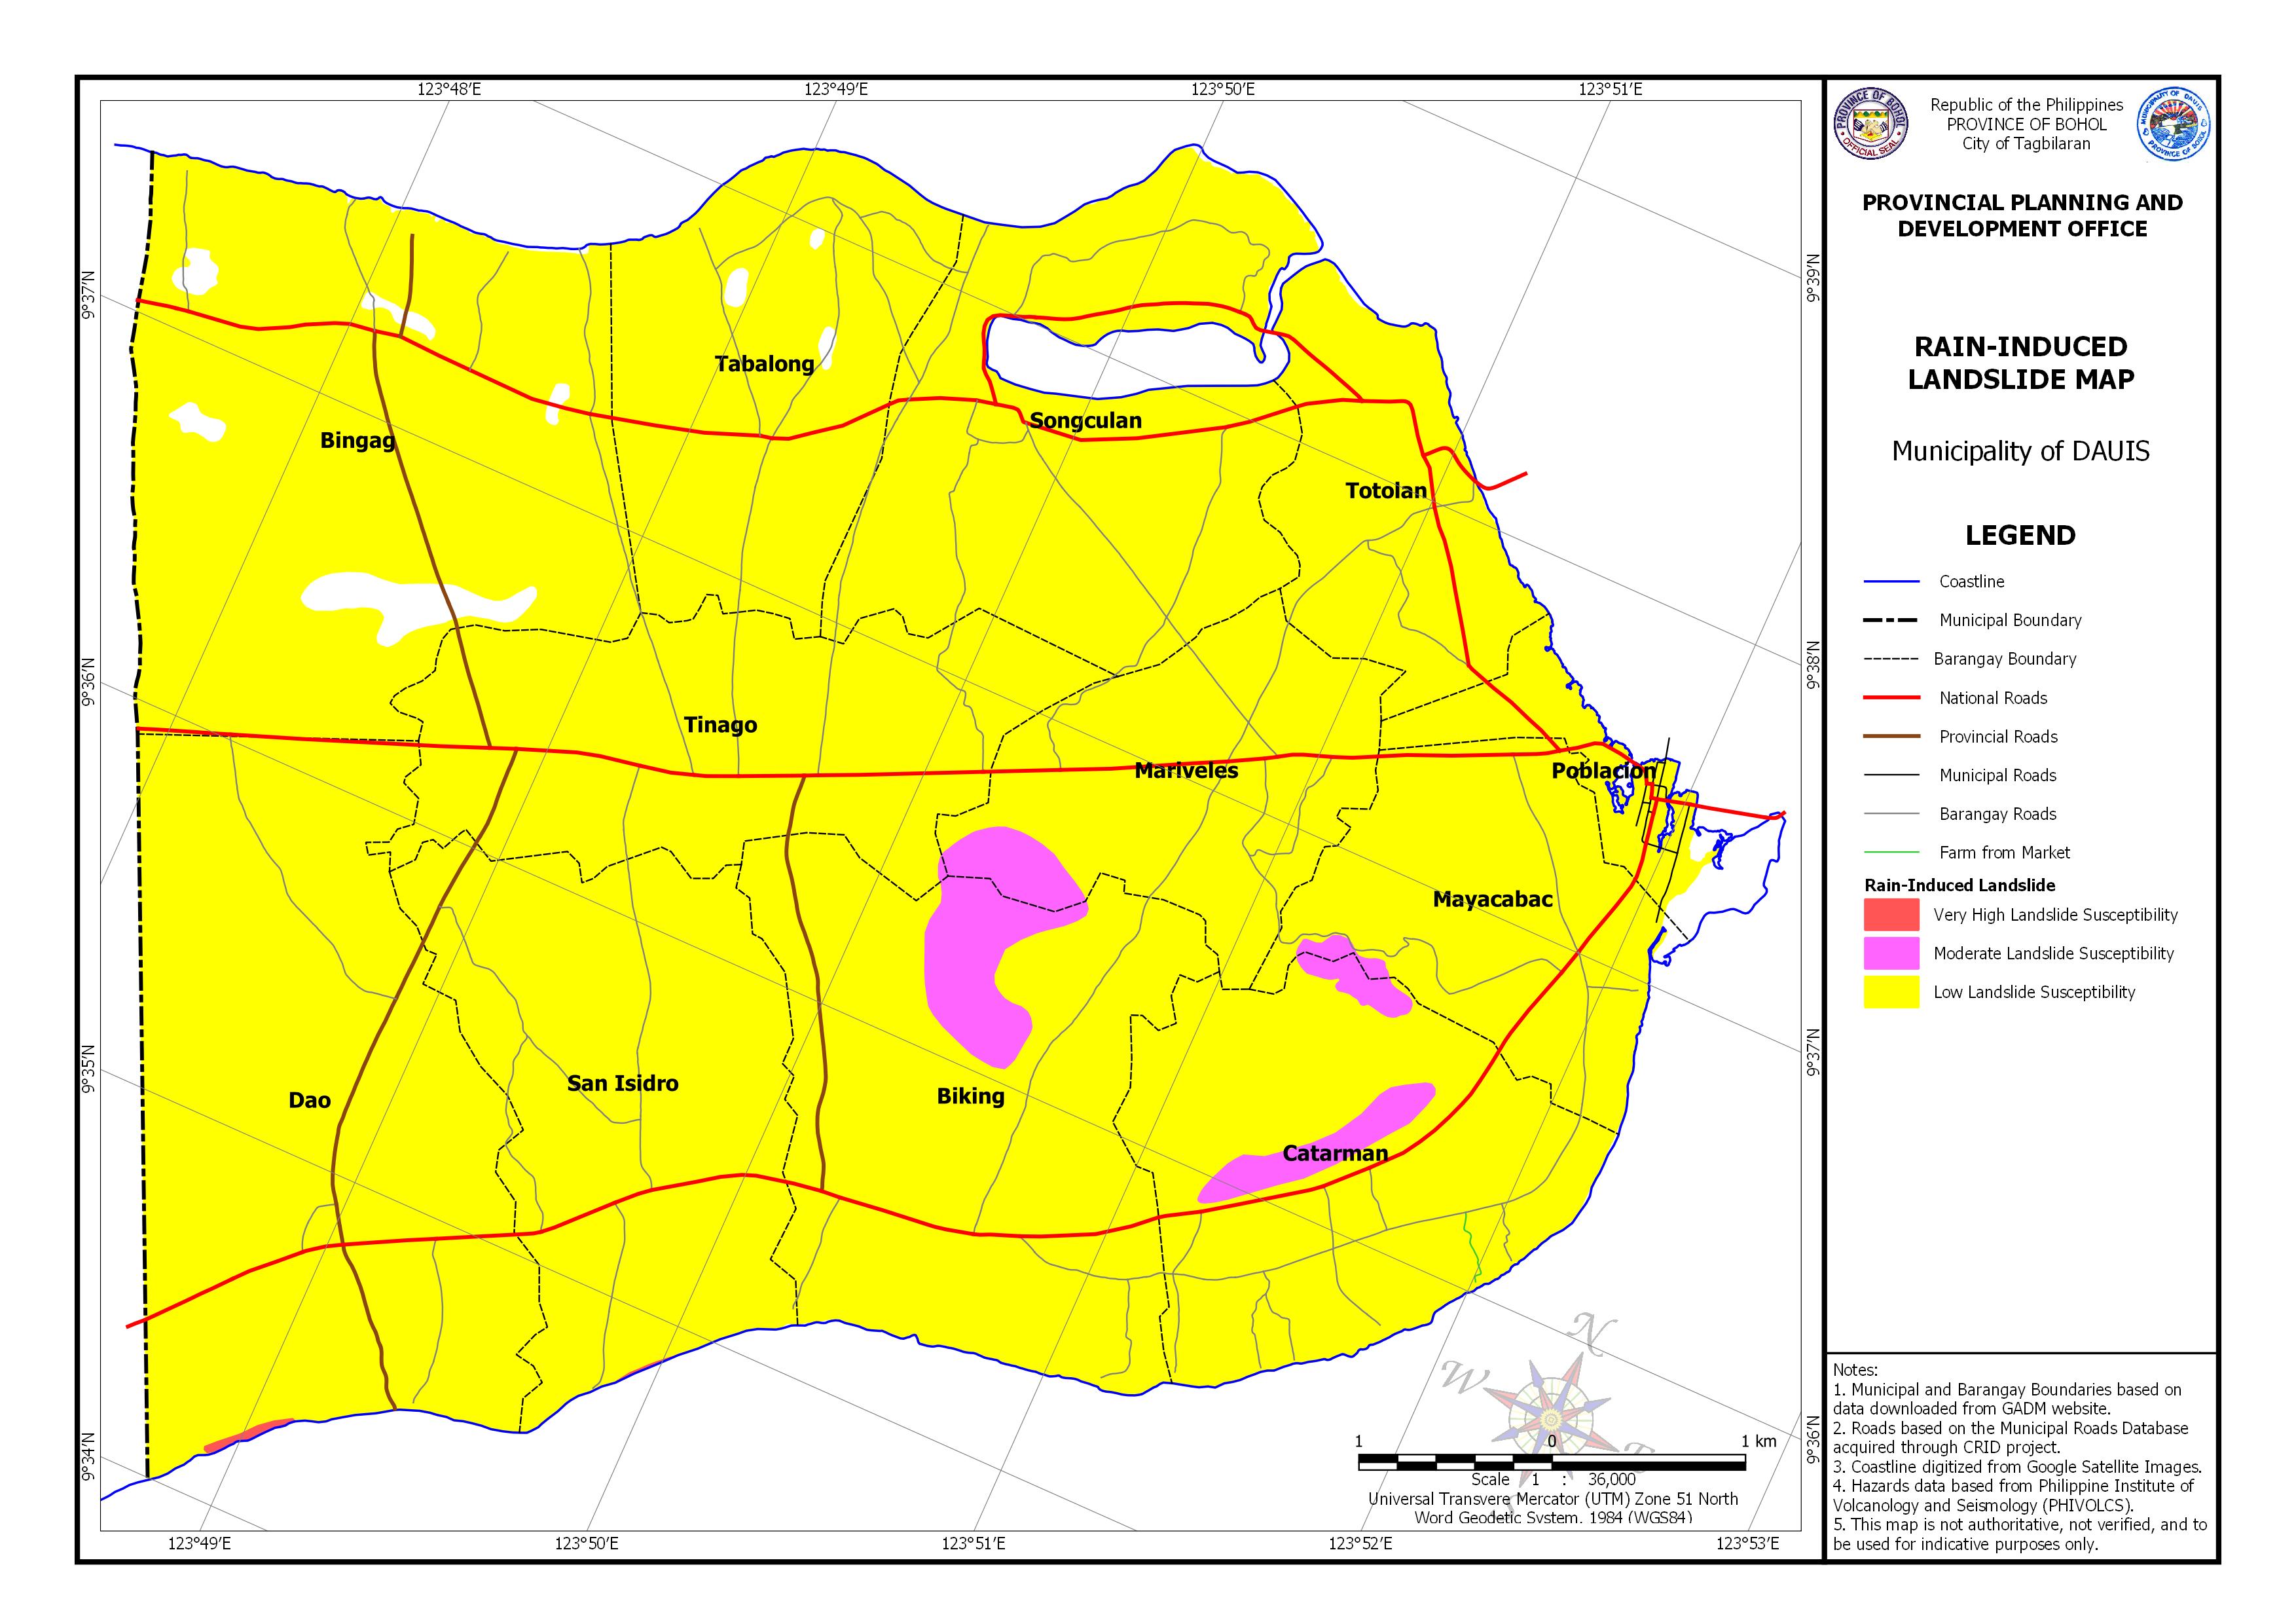
AREA EXPOSED TO RAIN-INDUCED LANDSLIDE BY BARANGAY
| Barangay | Area | Area Exposed to Low Landslide Susceptibility | Area Exposed to Moderate Landslide Susceptibility | Area Exposed to High Landslide Susceptibility | |||
|---|---|---|---|---|---|---|---|
| (Hectares) | (Hectares) | Percentage | Hectares | Percentage | Hectares | Percentage | |
| Biking | 489.508 | 445.212 | 90.951% | 43.752 | 8.938% | ||
| Bingag | 637.543 | 597.801 | 93.766% | 8.504% | |||
| Catarman | 380.868 | 347.675 | 91.285% | 32.388 | 8.504% | ||
| Dao | 619.836 | 617.418 | 99.610% | 7.520% | 2.411 | 0.004 | |
| Mariveles | 259.407 | 239.901 | 92.480% | 19.506 | 7.520% | ||
| Mayacabac | 245.550 | 238.562 | 97.154% | 4.365 | 1.778% | ||
| Poblacion | 88.749 | 68.897 | 77.631% | ||||
| San Isidro | 409.841 | 408.981 | 99.790% | 0.685 | 0.002 | ||
| Songculan | 425.780 | 422.860 | 99.314% | ||||
| Tabalong | 319.378 | 314.282 | 98.405% | ||||
| Tinago | 376.656 | 376.137 | 99.862% | 0.518 | 0.138% | ||
| Totolan | 201.105 | 199.395 | 99.150% | ||||
| Total | 4454.220 | 4277.122 | 1139.399% | 100.530 | 26.877% | 3.096 | 0.556% |