
Download in PDF and JPG format
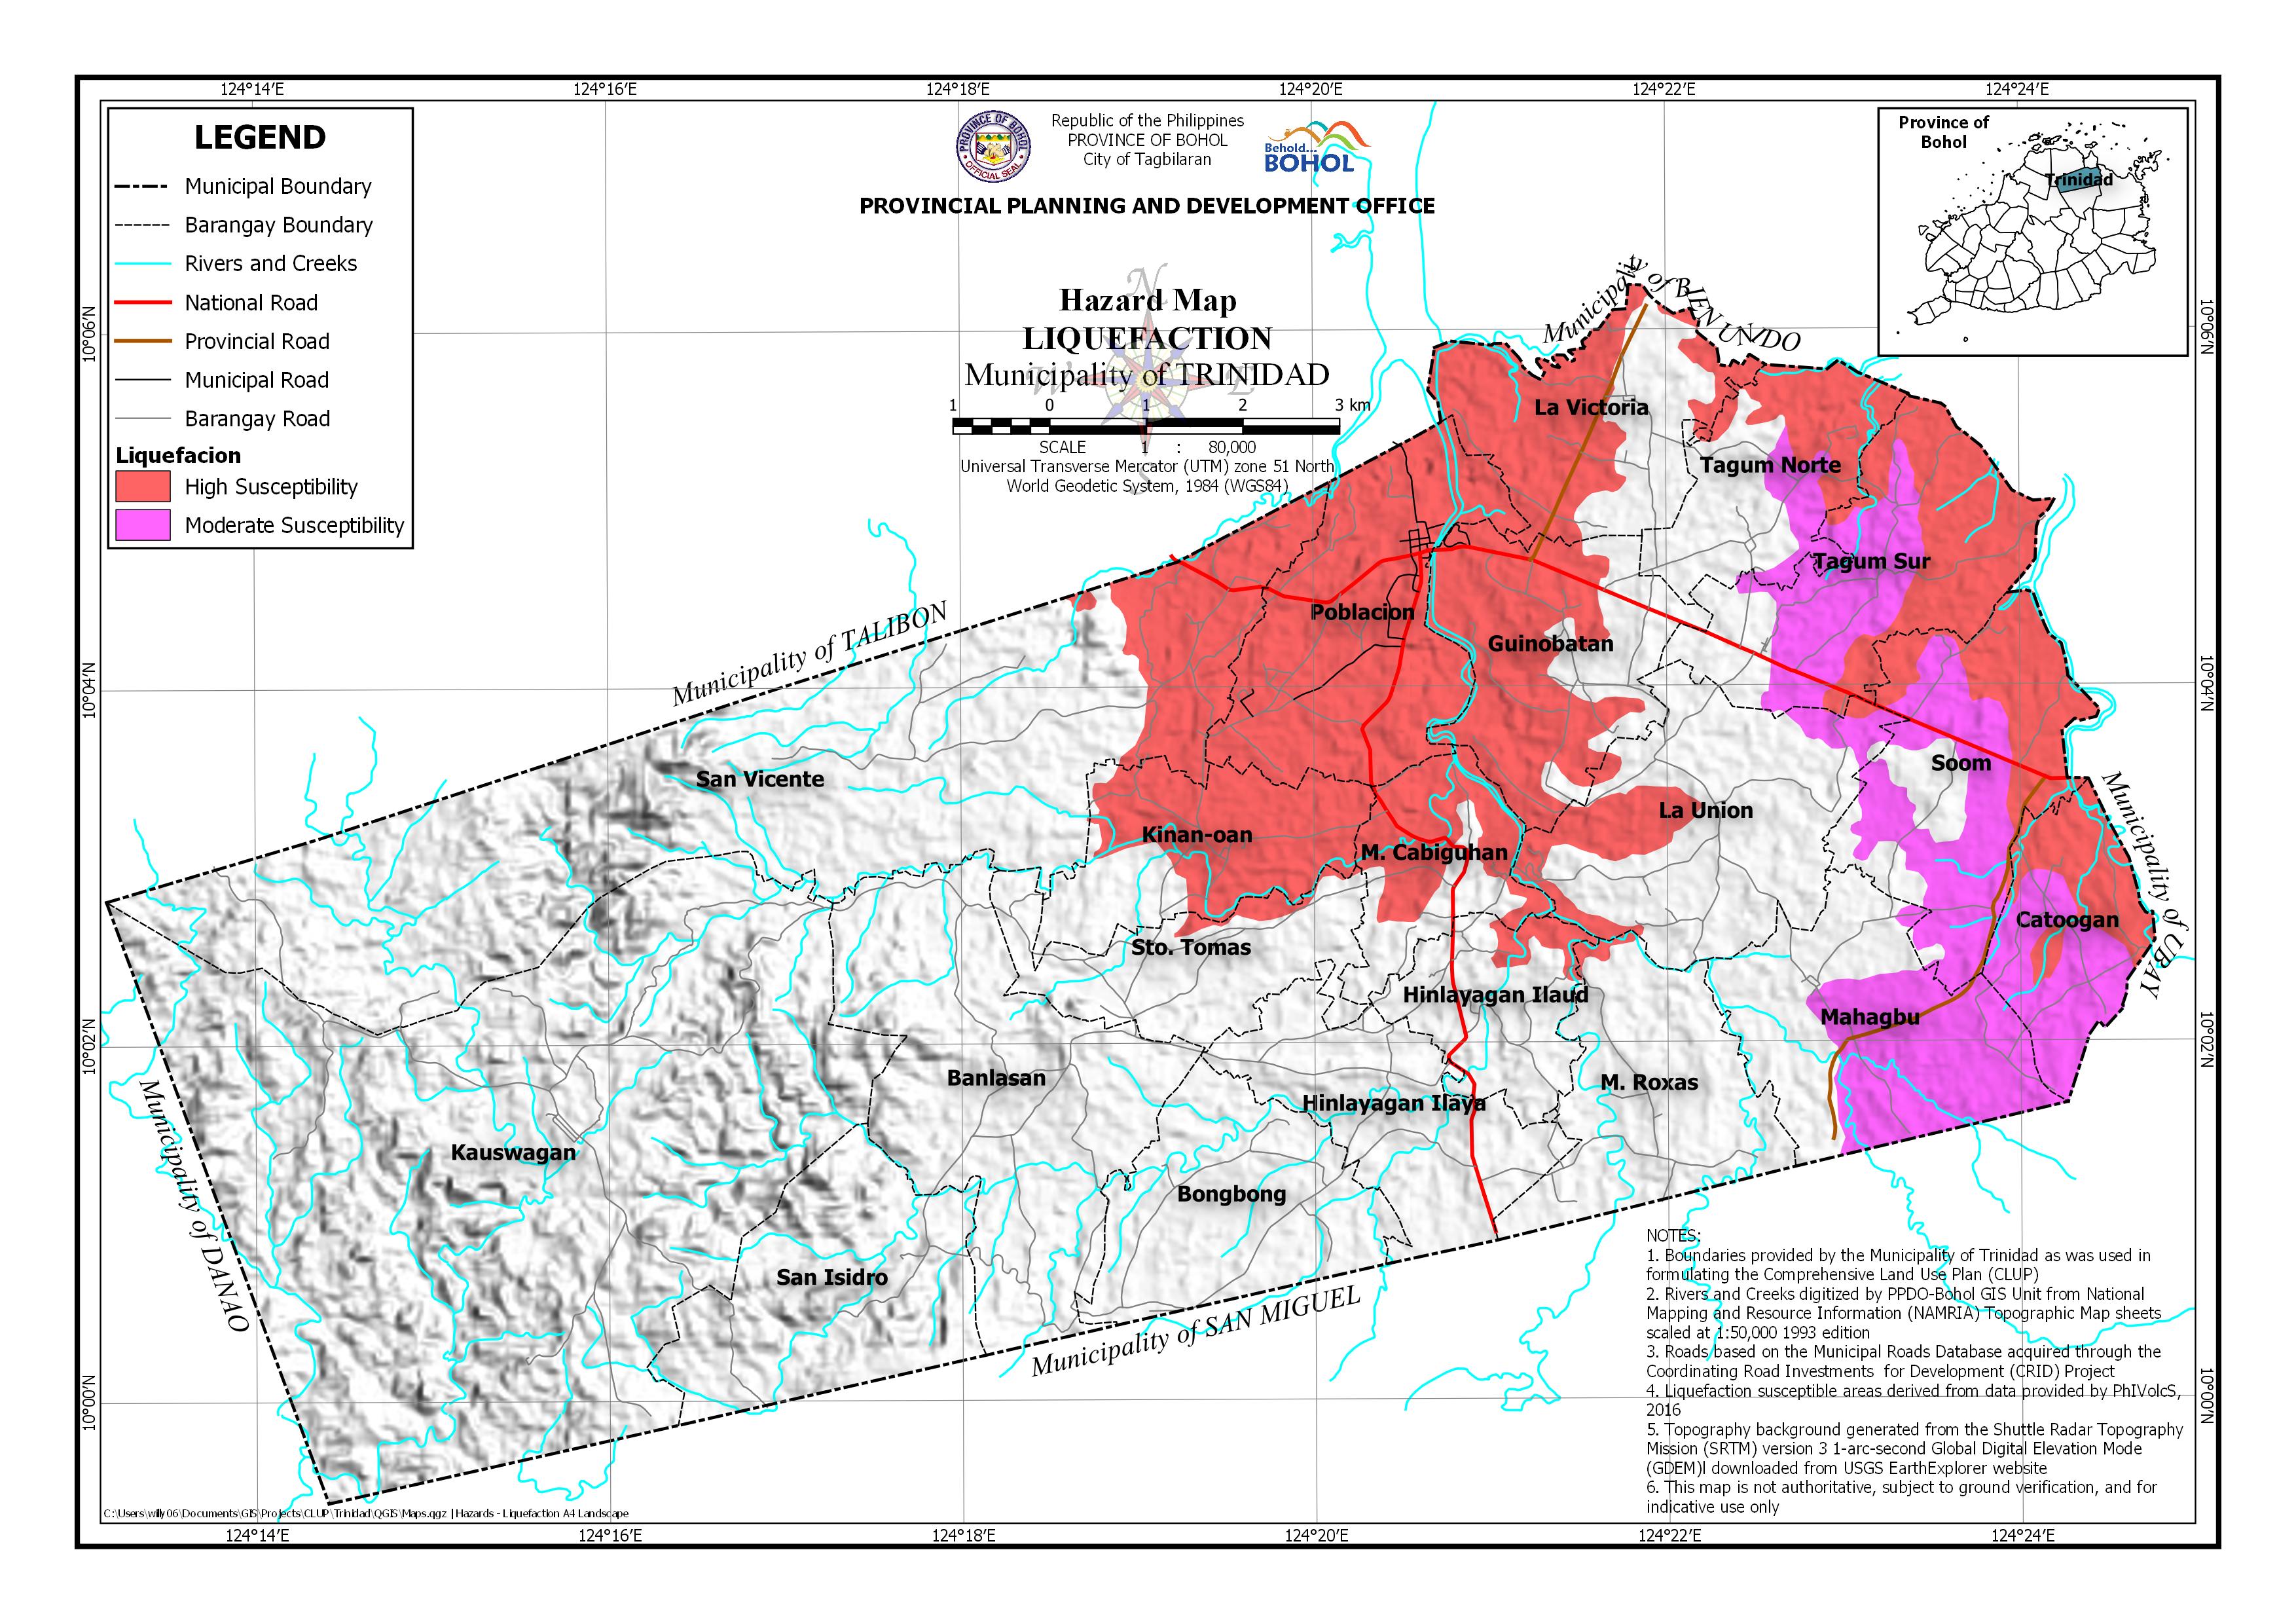
AREA EXPOSED TO LIQUEFACTION HAZARD BY BARANGAY
| Barangay | Area | Barangay Area Exposed to High Susceptibility | Barangay Area Exposed to Moderate Susceptibility | ||
| (Hectares) | (Hectares) | (Percentage) | (Hectares) | (Percentage) | |
| Banlasan | 988.739 | ||||
| Bongbong | 540.748 | ||||
| Catoogan | 335.1 | 150.055 | 44.78% | 185.045 | 55.22% |
| Guinobatan | 563.906 | 387.81 | 68.77% | ||
| Hinlayagan Ilaud | 306.645 | 34.658 | 11.30% | ||
| Hinlayagan Ilaya | 486.672 | ||||
| Kauswagan | 3,091.78 | ||||
| Kinan-oan | 439.893 | 307.578 | 69.92% | ||
| La Union | 724.351 | 126.035 | 17.40% | 34.755 | 4.80% |
| La Victoria | 516.037 | 321.587 | 62.32% | ||
| M. Cabiguhan | 306.975 | 188.502 | 61.41% | ||
| M. Roxas | 512.497 | 9.459 | 1.85% | ||
| Mahagbu | 627.355 | 332.416 | 52.99% | ||
| Poblacion | 671.786 | 671.786 | 100.00% | ||
| San Isidro | 620.653 | ||||
| San Vicente | 2,233.06 | 294.088 | 13.17% | ||
| Soom | 616.046 | 209.737 | 34.05% | 289.769 | 47.04% |
| Sto. Tomas | 401.716 | 23.011 | 5.73% | ||
| Tagum Norte | 392.375 | 140.021 | 35.69% | 64.157 | 16.35% |
| Tagum Sur | 613.829 | 295.494 | 48.14% | 217.589 | 35.45% |
| Total | 14,990.16 | 3,159.82 | 21.08% | 1,123.73 | 7.50% |