
Download in PDF and JPG format
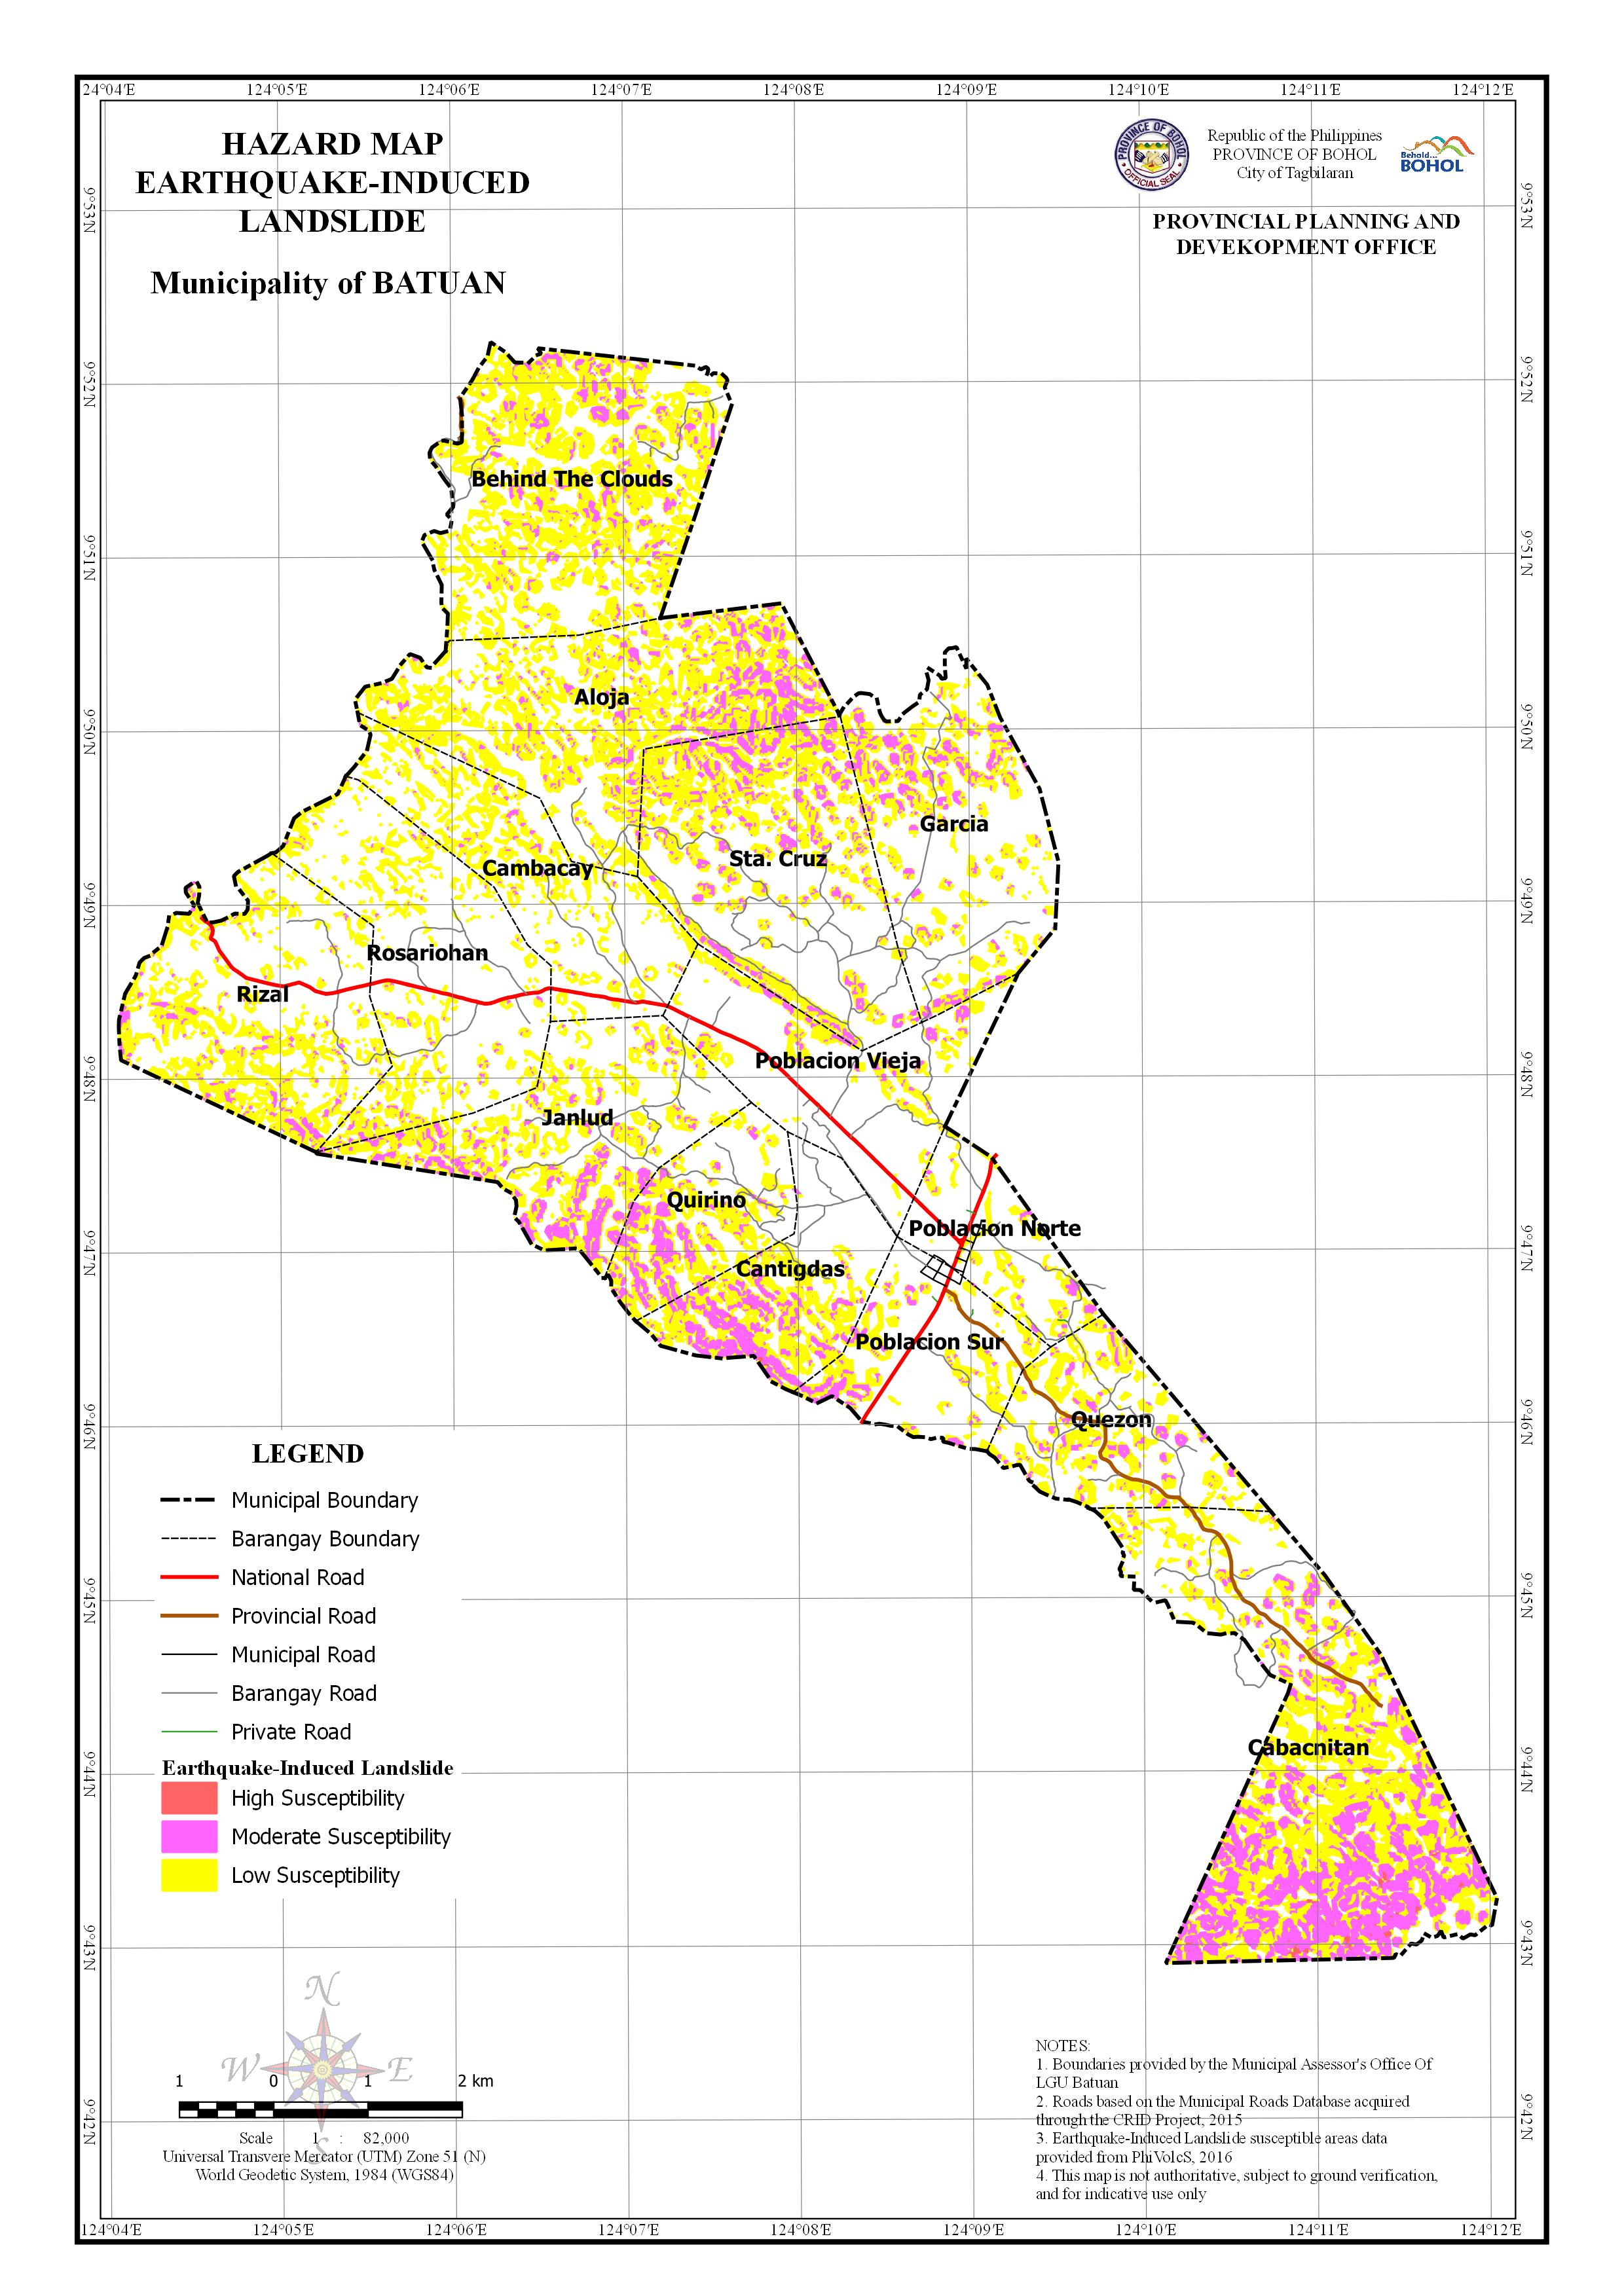
AREA EXPOSED TO EARTHQUAKE-INDUCED LANDSLIDE BY BARANGAY
| Barangay | Area | Area Exposed to High Susceptibility | Area Exposed to Moderate Susceptibility | Area Exposed to Low Susceptibility | |||
| (Hectares) | (Hectares) | Percentage | (Hectares) | Percentage | (Hectares) | Percentage | |
| Aloja | 703.38 | 72.751 | 10.34% | 219.496 | 31.21% | ||
| Behind The Clouds | 777.08 | 65.236 | 8.40% | 255.084 | 32.83% | ||
| Cabacnitan | 1,009.19 | 14.351 | 1.42% | 238.04 | 23.59% | 304.602 | 30.18% |
| Cambacay | 434.135 | 6.573 | 1.51% | 70.111 | 16.15% | ||
| Cantigdas | 326.134 | 0.904 | 0.28% | 46.8 | 14.35% | 76.111 | 23.34% |
| Garcia | 565.007 | 0.226 | 0.04% | 40.872 | 7.23% | 84.793 | 15.01% |
| Janlud | 506.905 | 0.294 | 0.06% | 48.806 | 9.63% | 110.189 | 21.74% |
| Poblacion Norte | 224.341 | 4.695 | 2.09% | 23.457 | 10.46% | ||
| Poblacion Sur | 317.725 | 13.881 | 4.37% | 41.561 | 13.08% | ||
| Poblacion Vieja | 447.363 | 12.2 | 2.73% | 36.898 | 8.25% | ||
| Quezon | 344.134 | 19.094 | 5.55% | 65.584 | 19.06% | ||
| Quirino | 269.747 | 0.201 | 0.07% | 34.237 | 12.69% | 61.41 | 22.77% |
| Rizal | 583.21 | 23.962 | 4.11% | 118.047 | 20.24% | ||
| Rosariohan | 588.702 | 9.583 | 1.63% | 65.716 | 11.16% | ||
| Sta. Cruz | 676.062 | 0.16 | 0.02% | 68.779 | 10.17% | 139.207 | 20.59% |
| Total | 7,773.12 | 16.136 | 0.21% | 705.508 | 9.08% | 1,672.27 | 21.51% |