
Download in PDF and JPG format
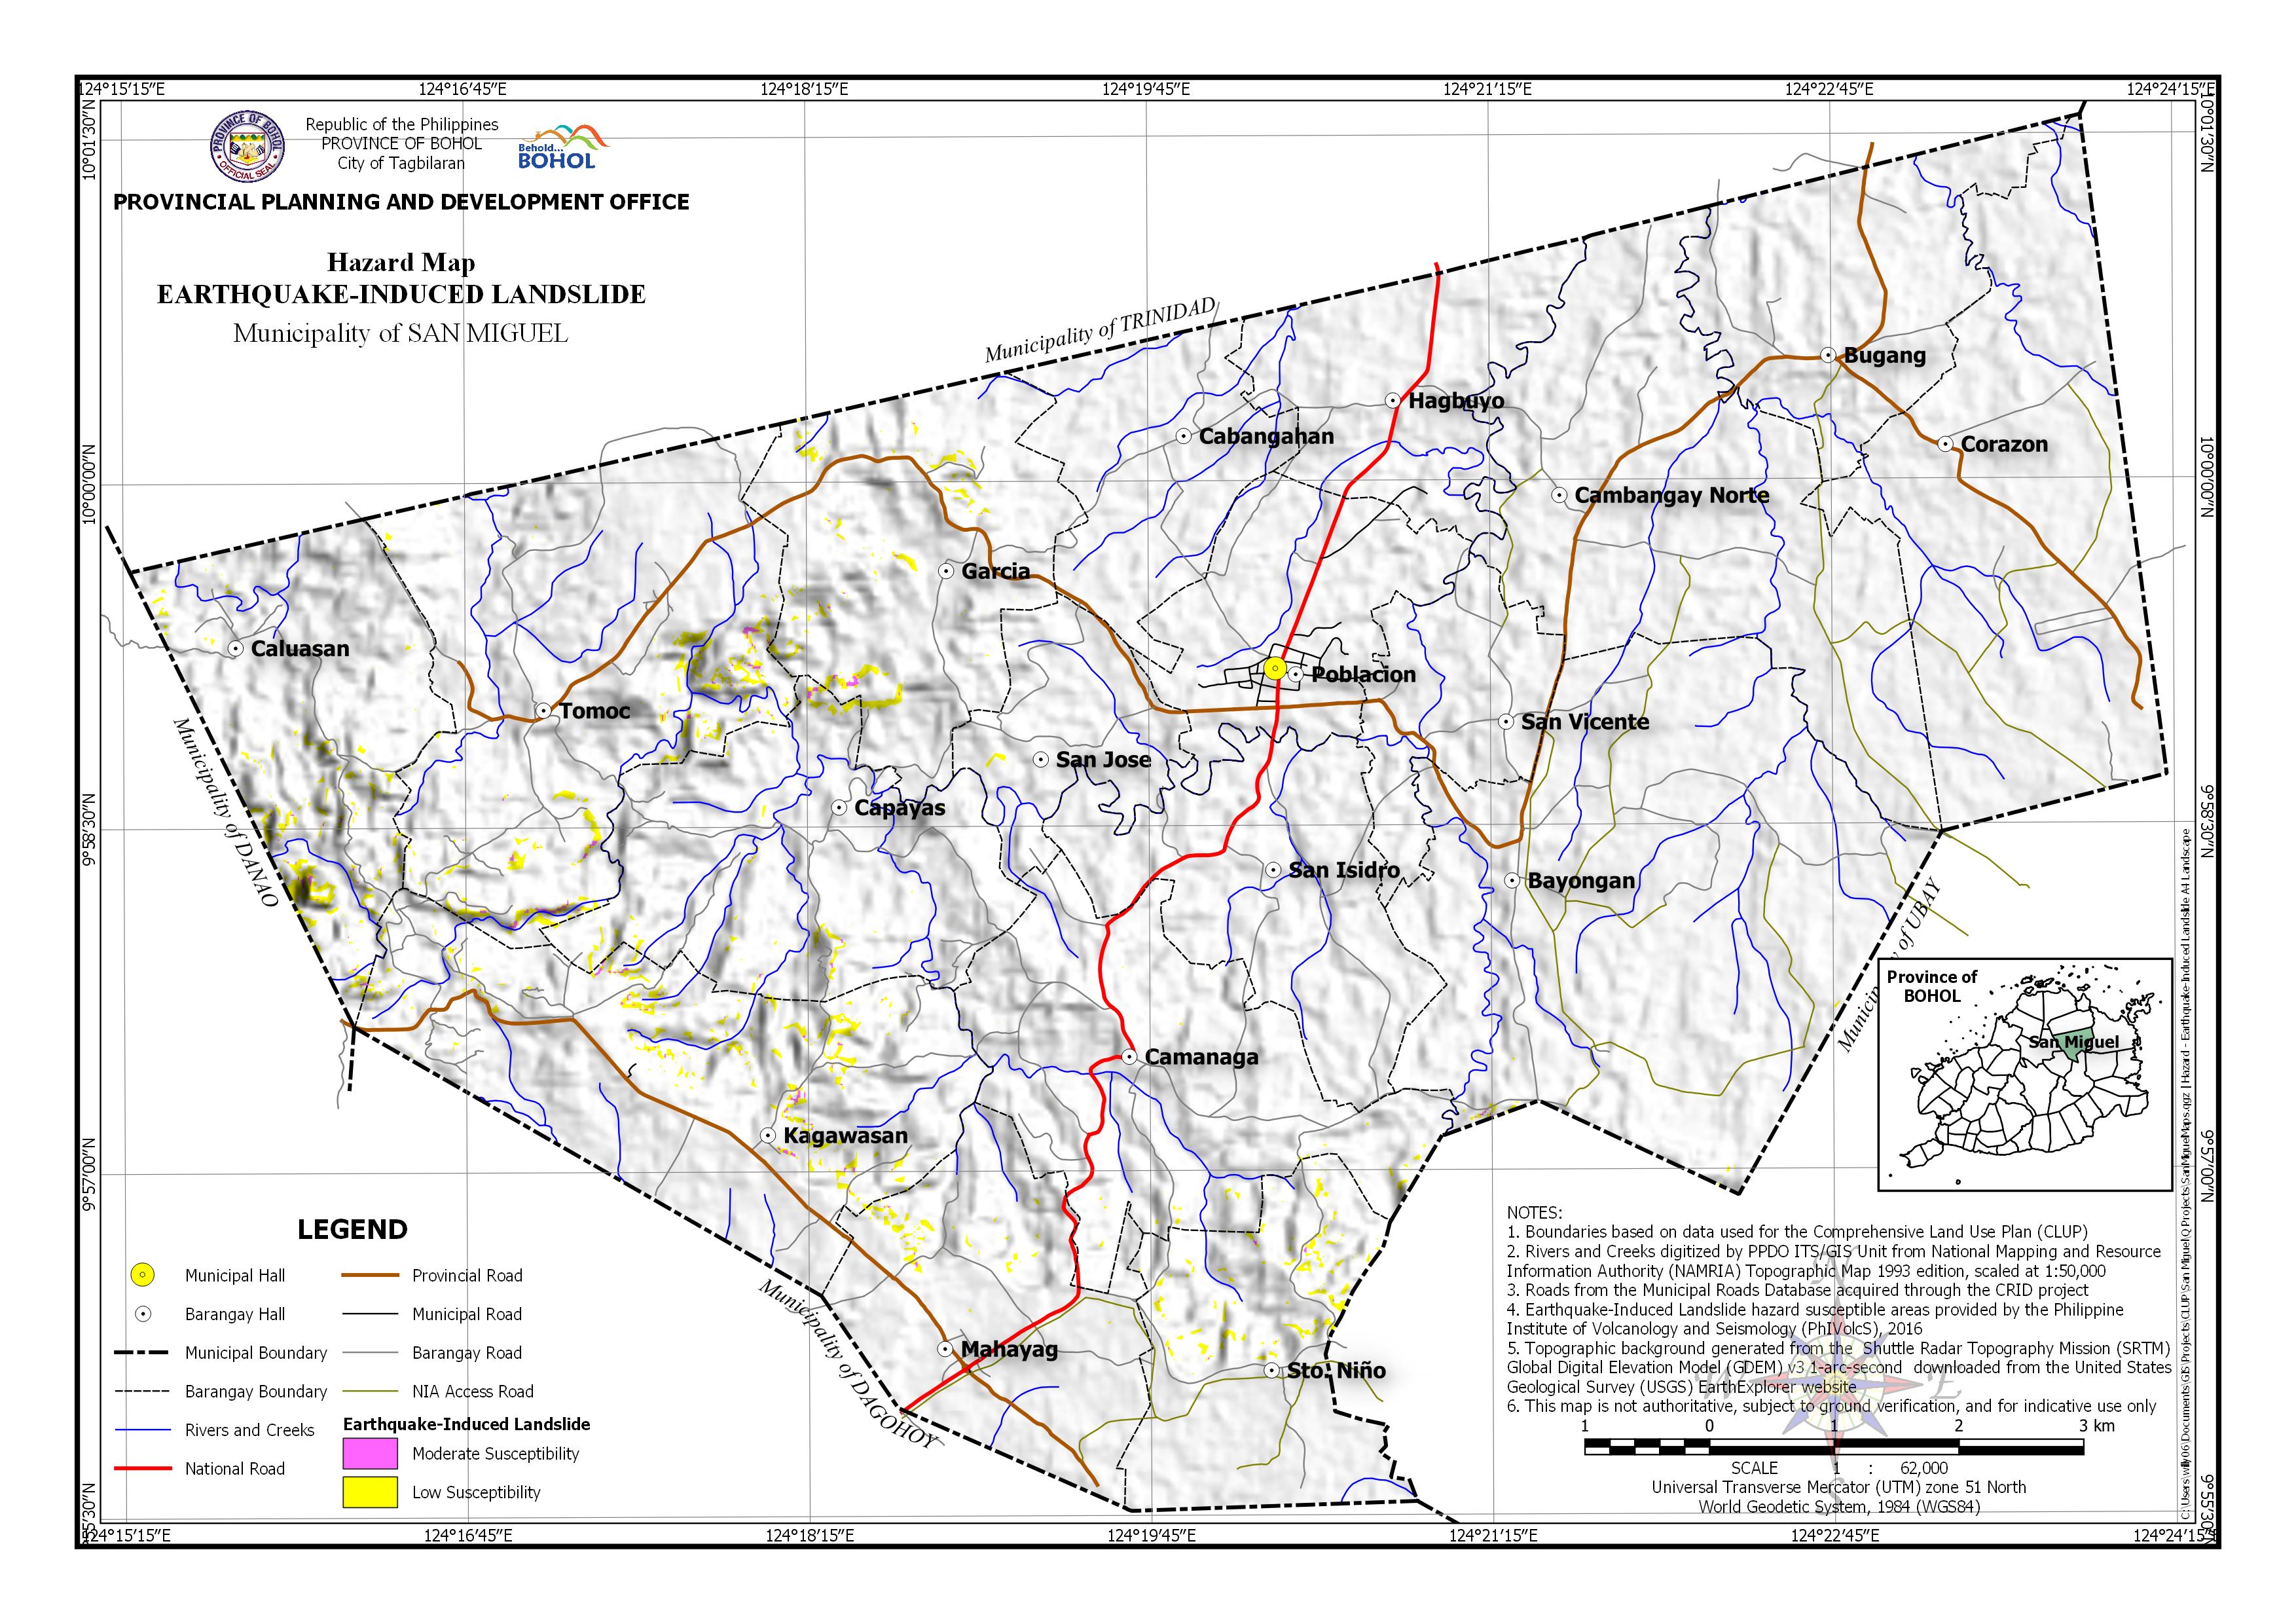
BARANGAY AREA EXPOSED TO EARTHQUAKE-INDUCED LANDSLIDE
| Barangay | Area | Area Exposed to Moderate Susceptibility | Area Exposed to Low Susceptibility | ||
| (Hectares) | (Hectares) | (Percentage) | (Hectares) | (Percentage) | |
| Bayongan | 1,250.10 | 0.24 | 0.02% | 2.343 | 0.19% |
| Bugang | 440.944 | ||||
| Cabangahan | 339.211 | ||||
| Caluasan | 524.448 | 1.925 | 0.37% | 32.739 | 6.24% |
| Camanaga | 656.314 | 4.227 | 0.64% | ||
| Cambangay Norte | 858.694 | 0.304 | 0.04% | ||
| Capayas | 590.621 | 0.807 | 0.14% | 12.932 | 2.19% |
| Corazon | 848.991 | ||||
| Garcia | 569.211 | 1.353 | 0.24% | 21.073 | 3.70% |
| Hagbuyo | 367.155 | ||||
| Kagawasan | 819.411 | 3.415 | 0.42% | 41.797 | 5.10% |
| Mahayag | 492.551 | 0.24 | 0.05% | 8.803 | 1.79% |
| Poblacion | 358.19 | ||||
| San Isidro | 470.994 | 0.027 | 0.01% | ||
| San Jose | 234.559 | 1.031 | 0.44% | ||
| San Vicente | 248.082 | ||||
| Sto. Niño | 441.053 | 0.503 | 0.11% | 19.898 | 4.51% |
| Tomoc | 886.864 | 4.127 | 0.47% | 38.231 | 4.31% |
| Total | 10,397.39 | 12.61 | 0.12% | 183.407 | 1.76% |