
Download in PDF and JPG format
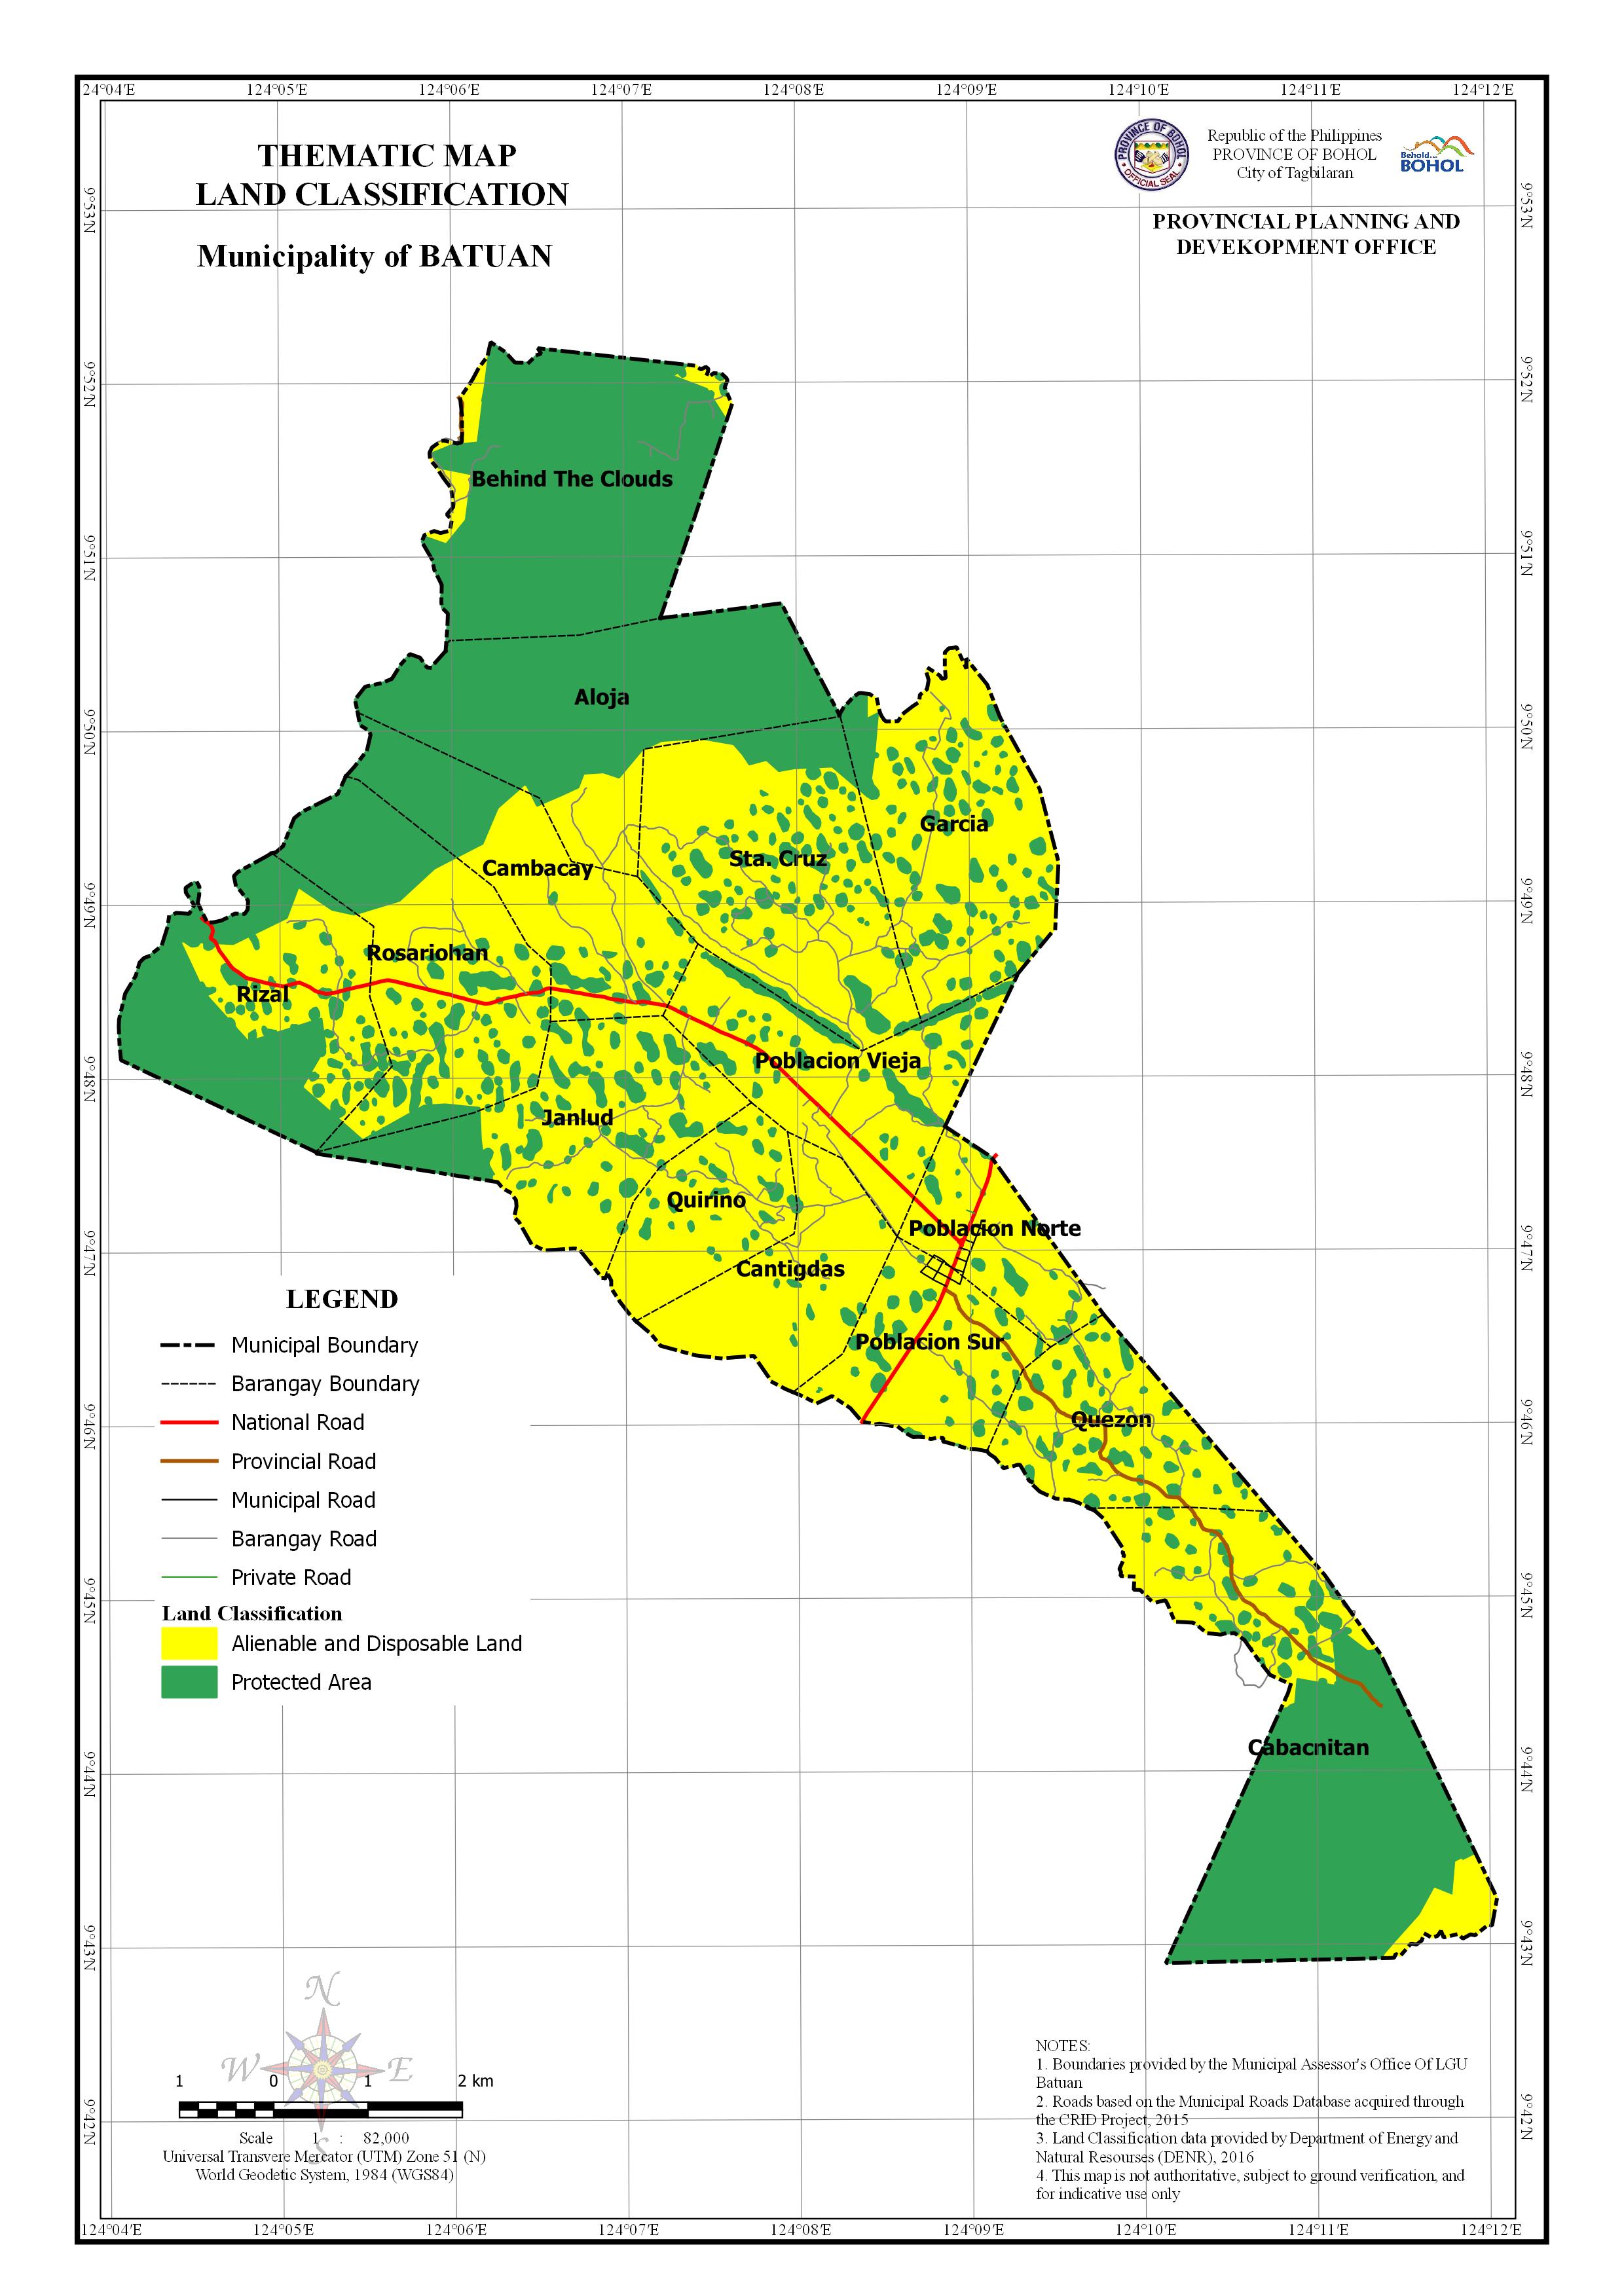
AREA PER LAND CLASSIFICATION BY BARANGAY
| Barangay | Area | Alienable and Disposable Land | Protected Area | ||
| (Hectares) | (Hectares) | Percentage | (Hectares) | Percentage | |
| Aloja | 703.38 | 89.156 | 12.675% | 614.222 | 87.324% |
| Behind The Clouds | 777.08 | 44.067 | 5.671% | 733.033 | 94.332% |
| Cabacnitan | 1009.193 | 313.527 | 31.067% | 695.669 | 68.933% |
| Cambacay | 434.135 | 278.822 | 64.225% | 155.312 | 35.775% |
| Cantigdas | 326.134 | 319.211 | 97.877% | 6.923 | 2.123% |
| Garcia | 565.007 | 461.116 | 81.612% | 103.89 | 18.387% |
| Janlud | 506.905 | 369.253 | 72.845% | 137.652 | 27.155% |
| Poblacion Norte | 224.341 | 206.796 | 92.179% | 17.546 | 7.821% |
| Poblacion Sur | 317.725 | 286.663 | 90.223% | 31.063 | 9.777% |
| Poblacion Vieja | 447.363 | 385.814 | 86.242% | 61.548 | 13.758% |
| Quezon | 344.134 | 298.971 | 86.876% | 45.167 | 13.125% |
| Quirino | 269.747 | 248.223 | 92.021% | 21.523 | 7.979% |
| Rizal | 583.21 | 222.203 | 38.100% | 361.005 | 61.900% |
| Rosariohan | 588.702 | 349.932 | 59.441% | 238.771 | 40.559% |
| Sta. Cruz | 676.062 | 535.334 | 79.184% | 140.73 | 20.816% |
| Total | 7773.119 | 4409.088 | 56.722% | 3364.055 | 43.278% |