
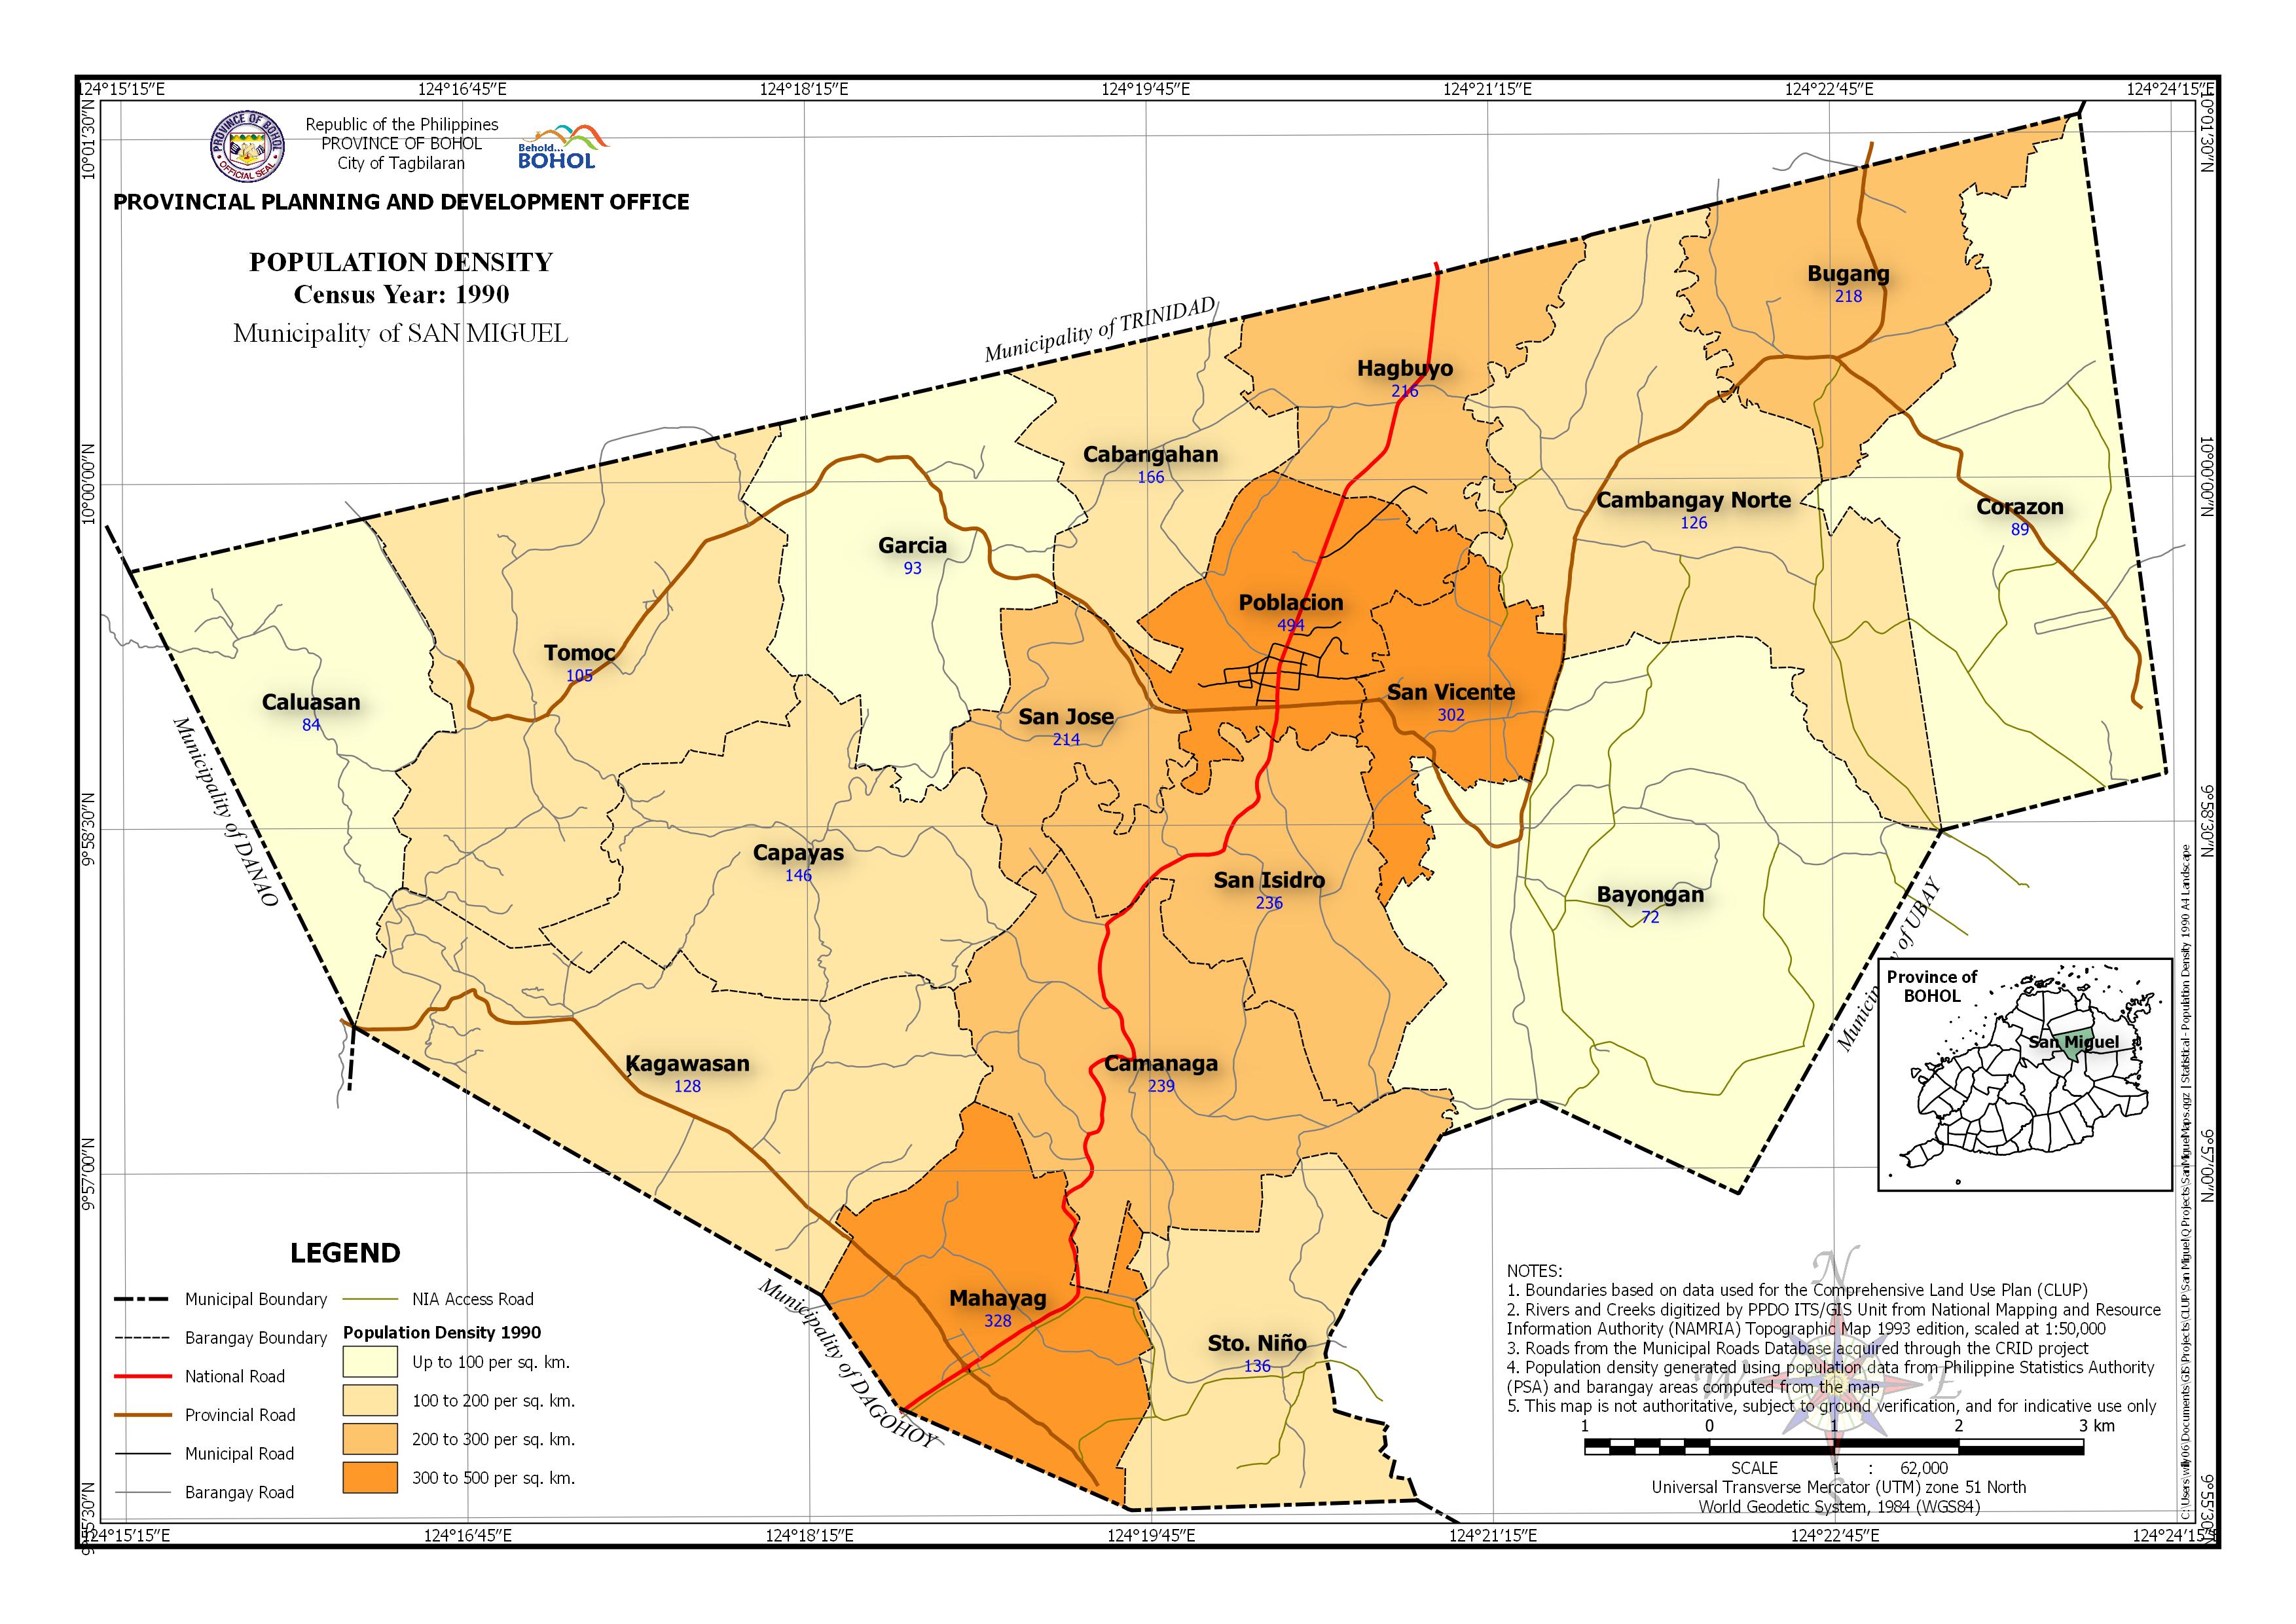
 | Census Year: 1990 Download in PDF and JPG format |
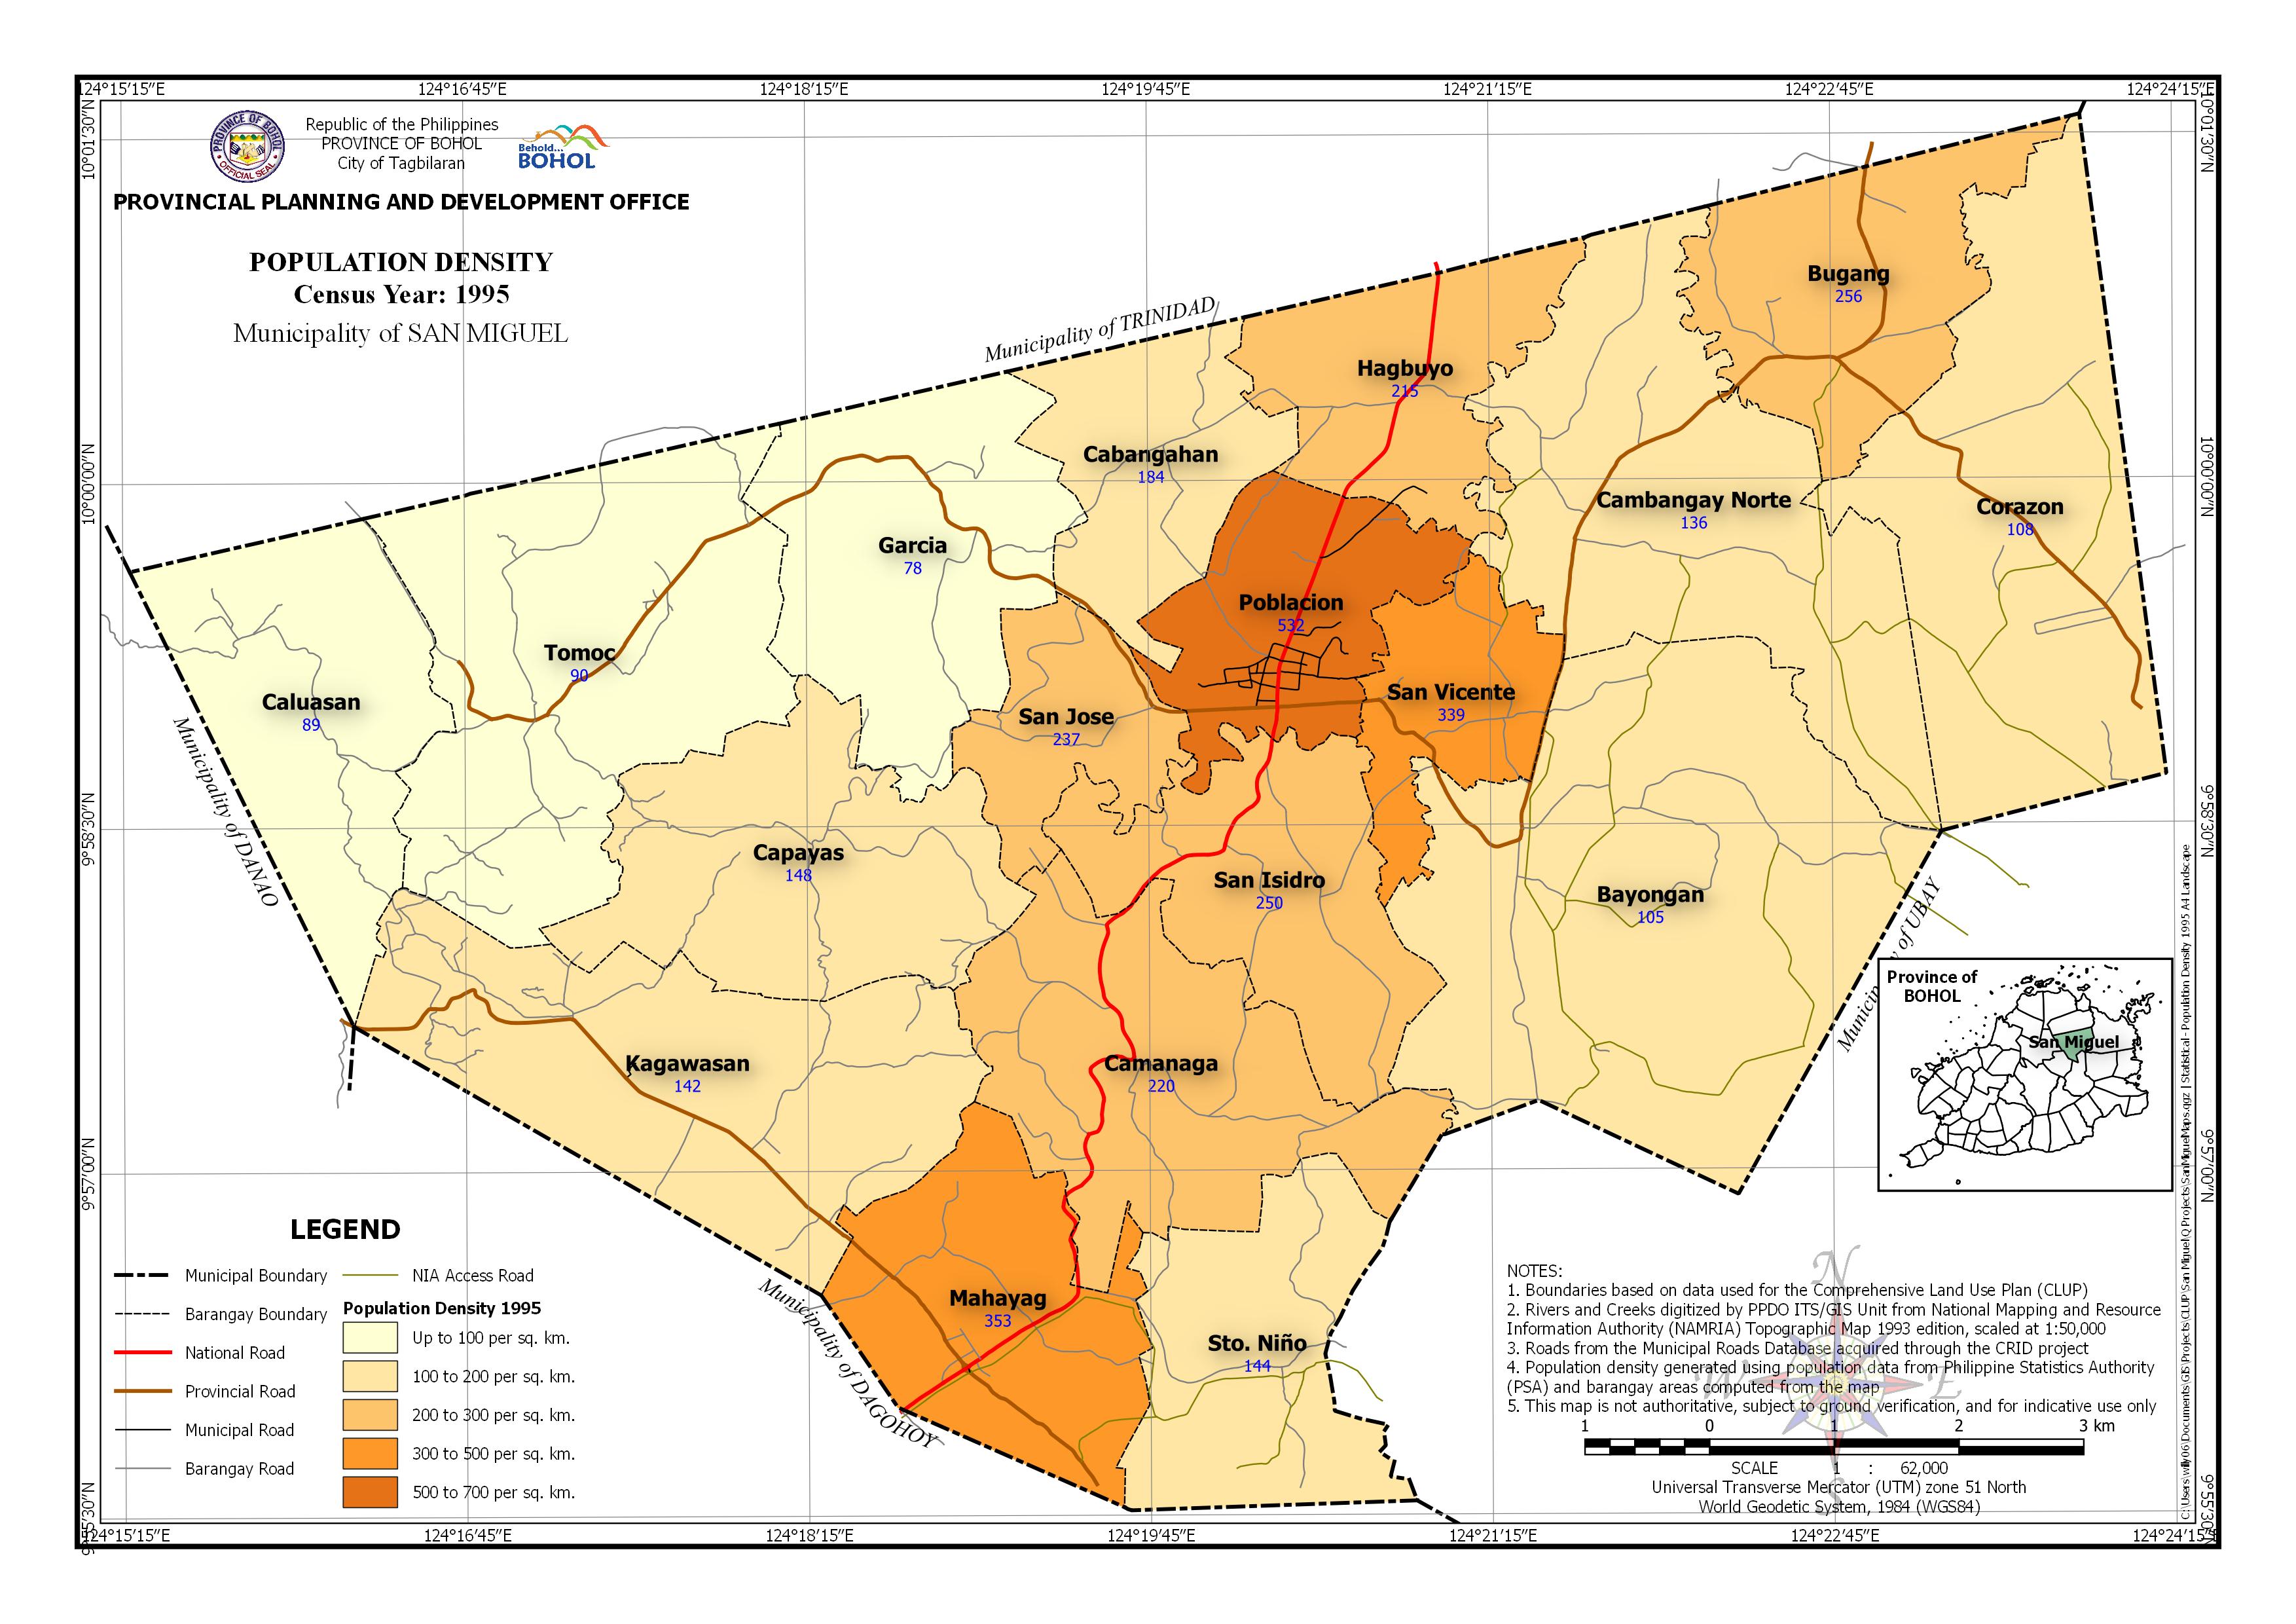 | Census Year: 1995 Download in PDF and JPG format |
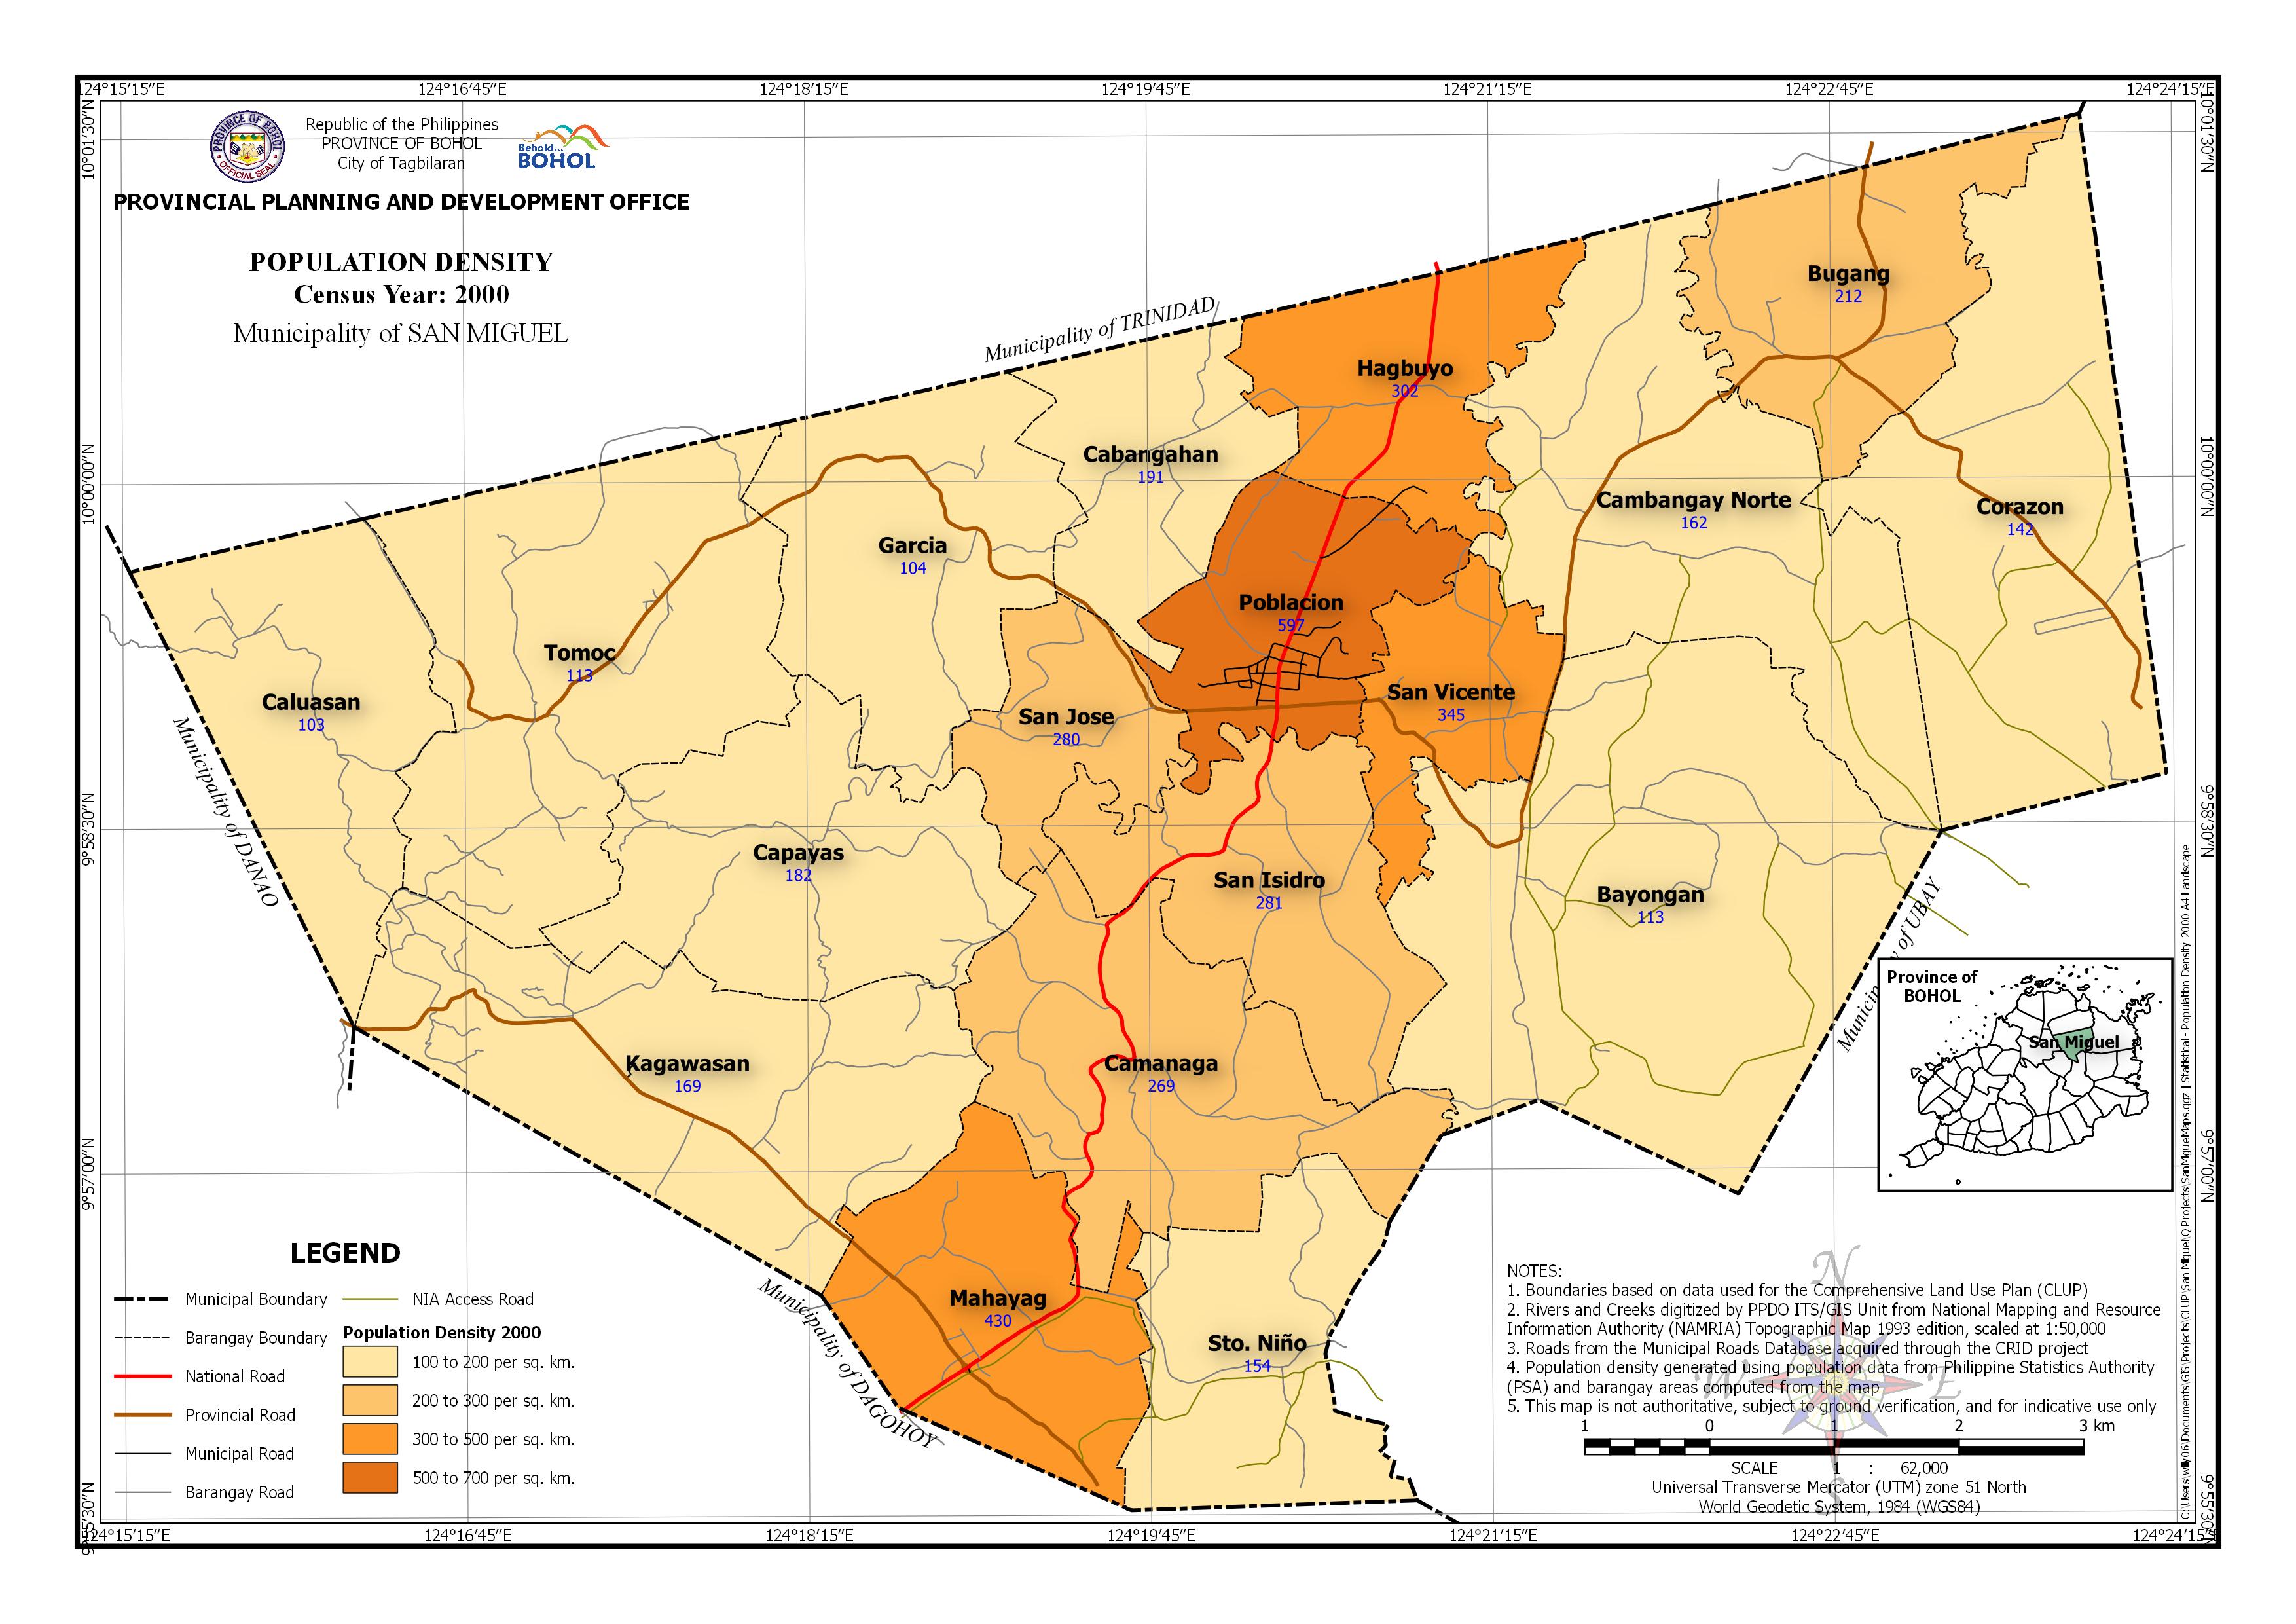 | Census Year: 2000 Download in PDF and JPG format |
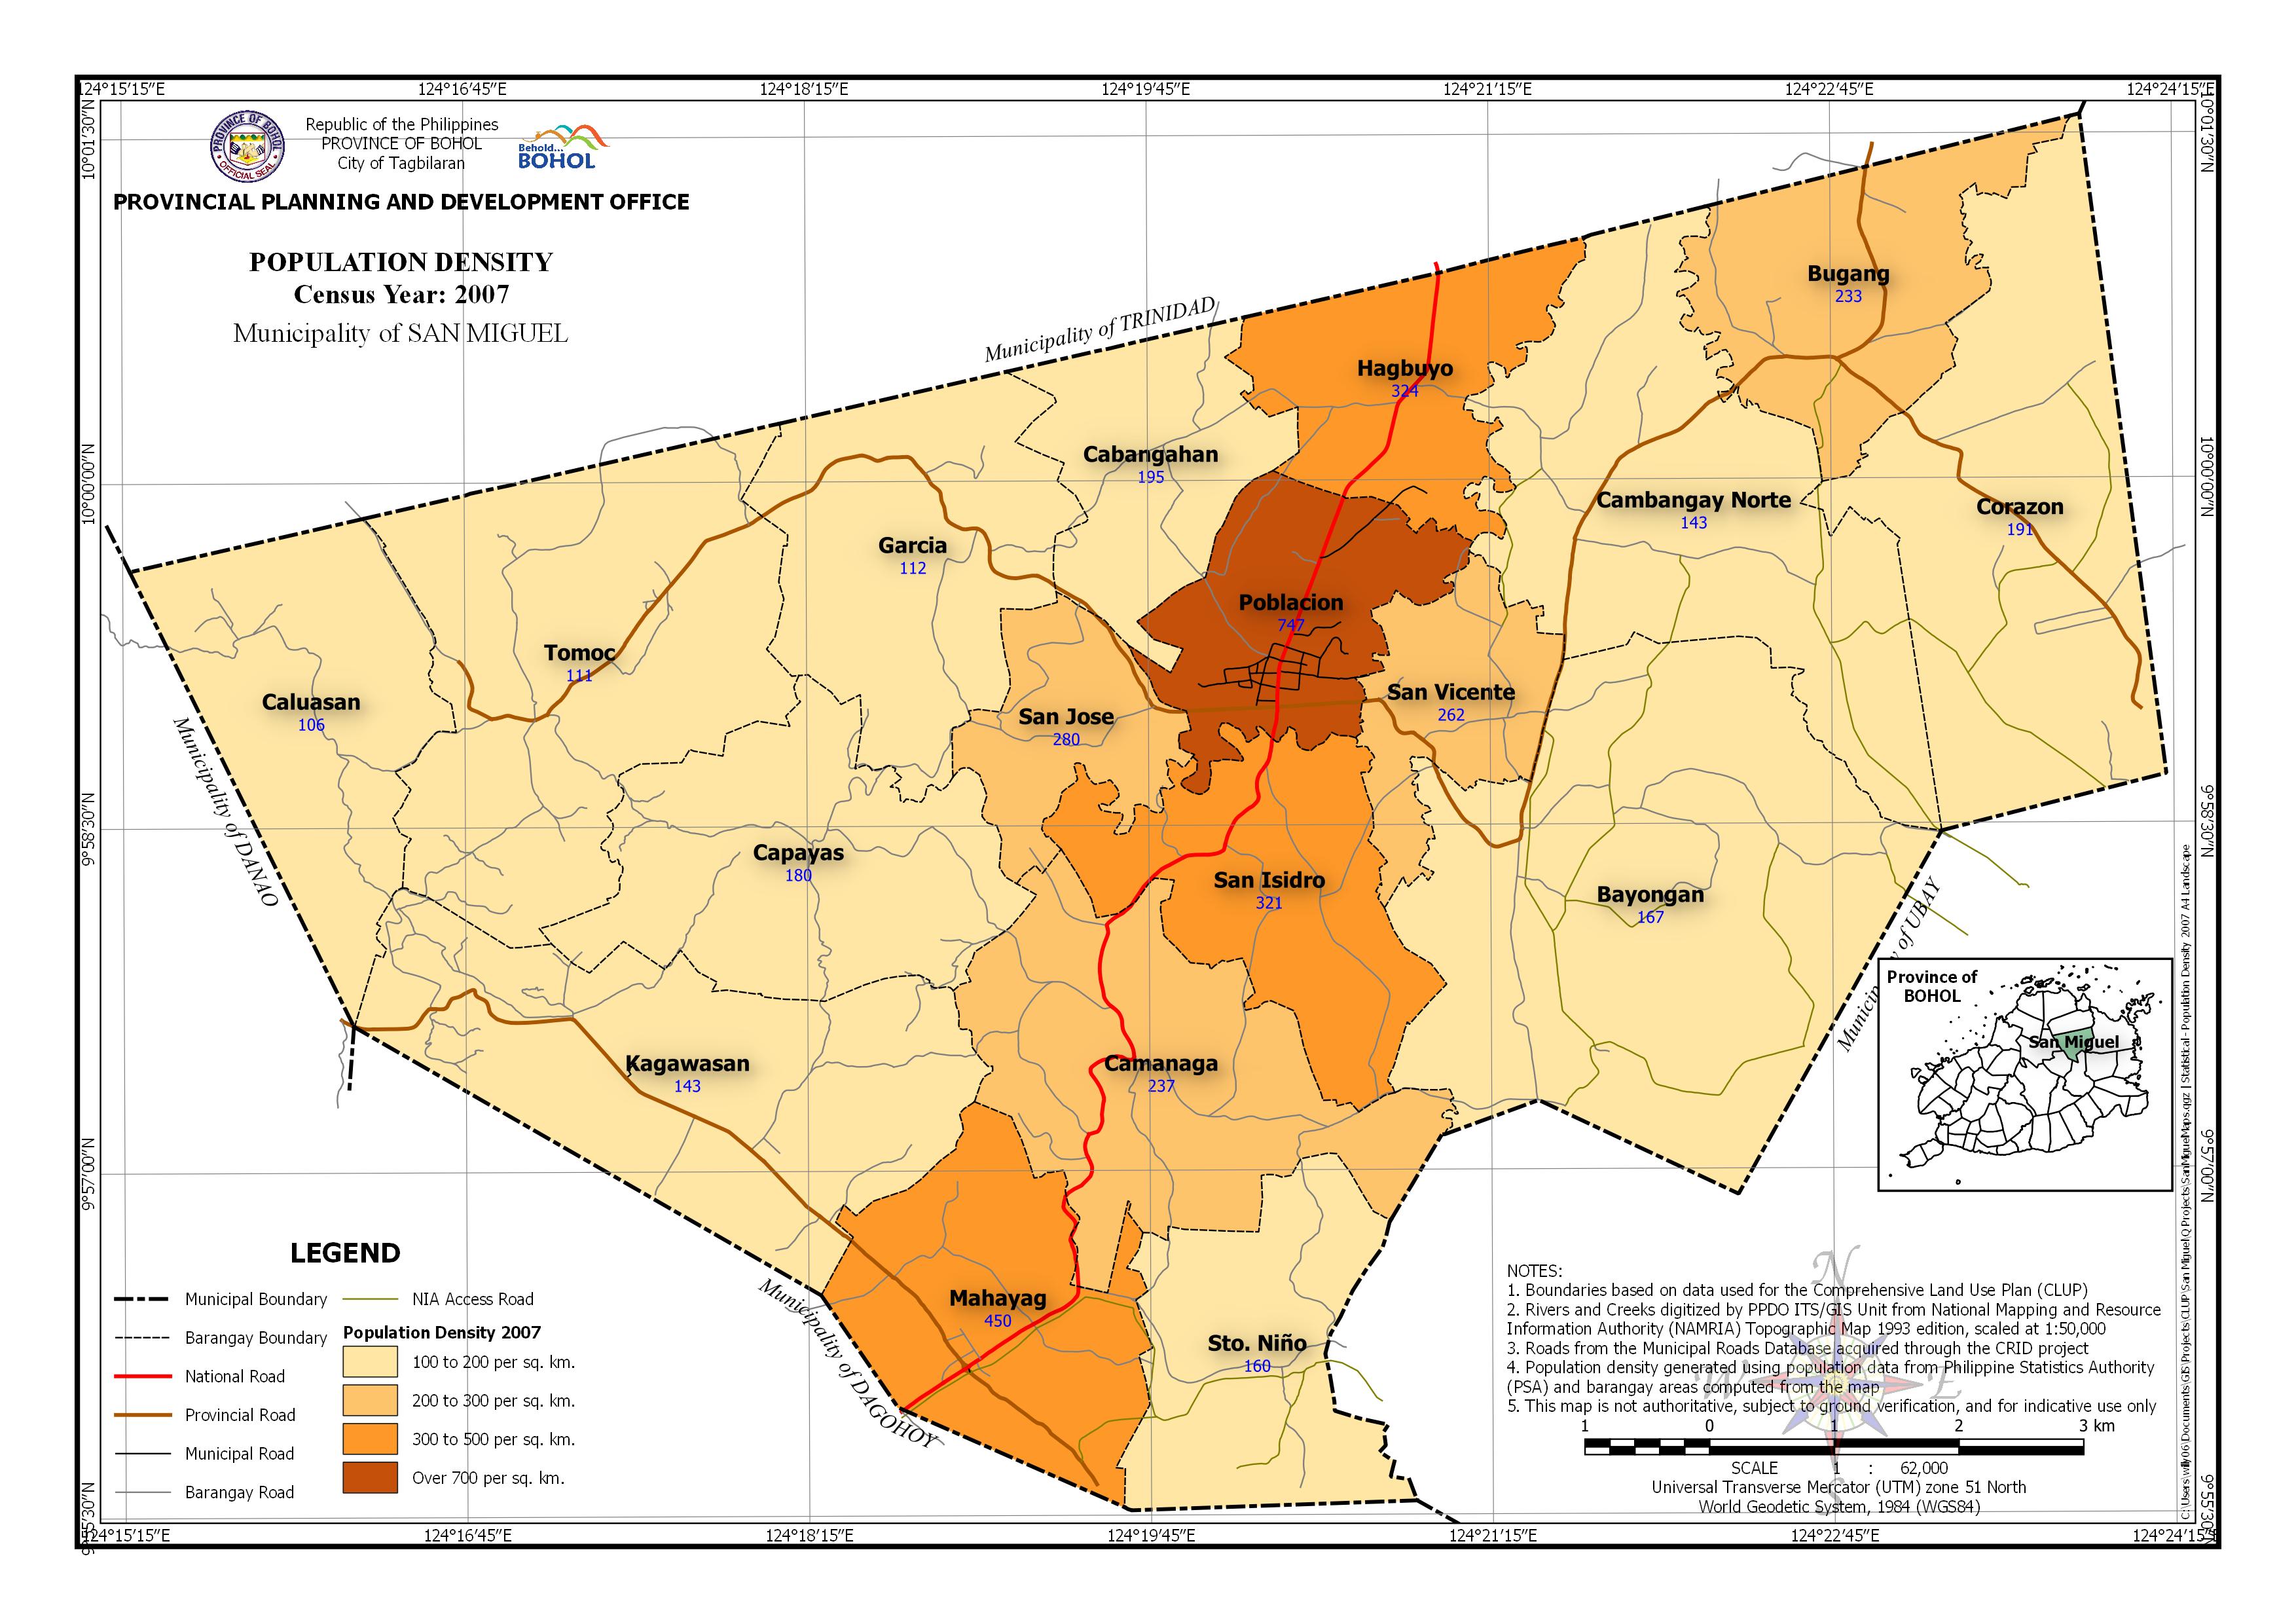 | Census Year: 2007 Download in PDF and JPG format |
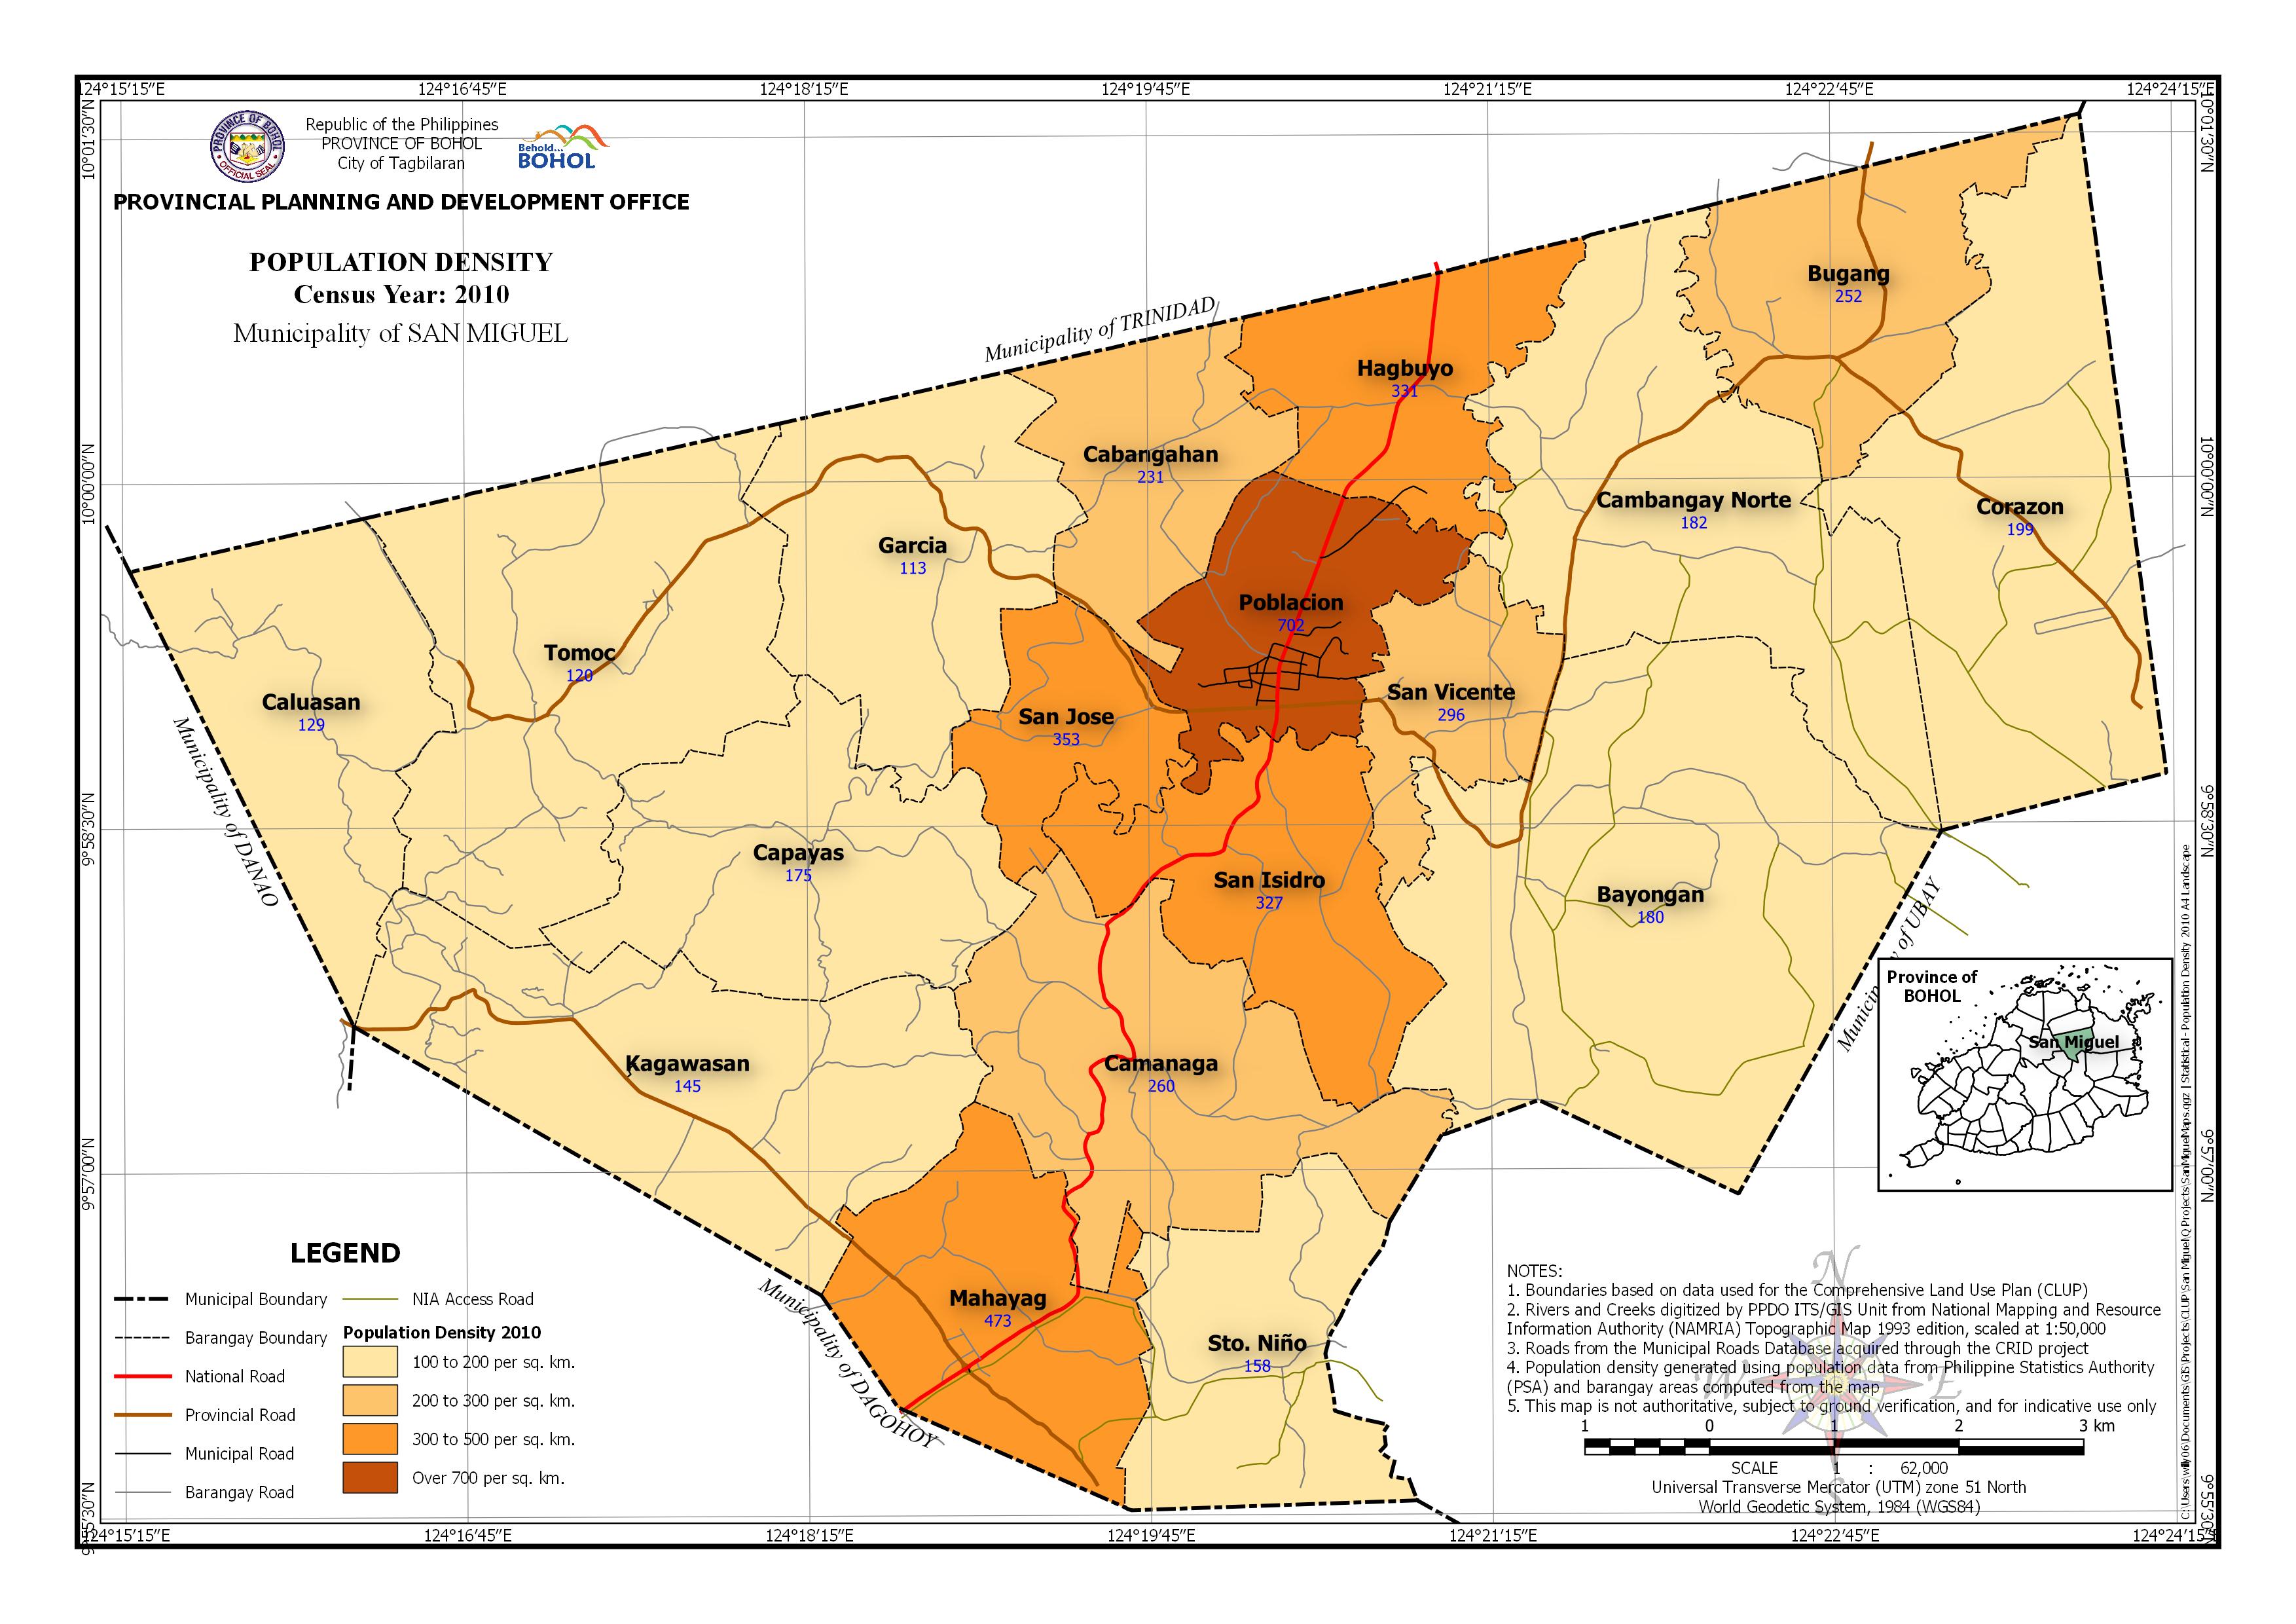 | Census Year: 2010 Download in PDF and JPG format |
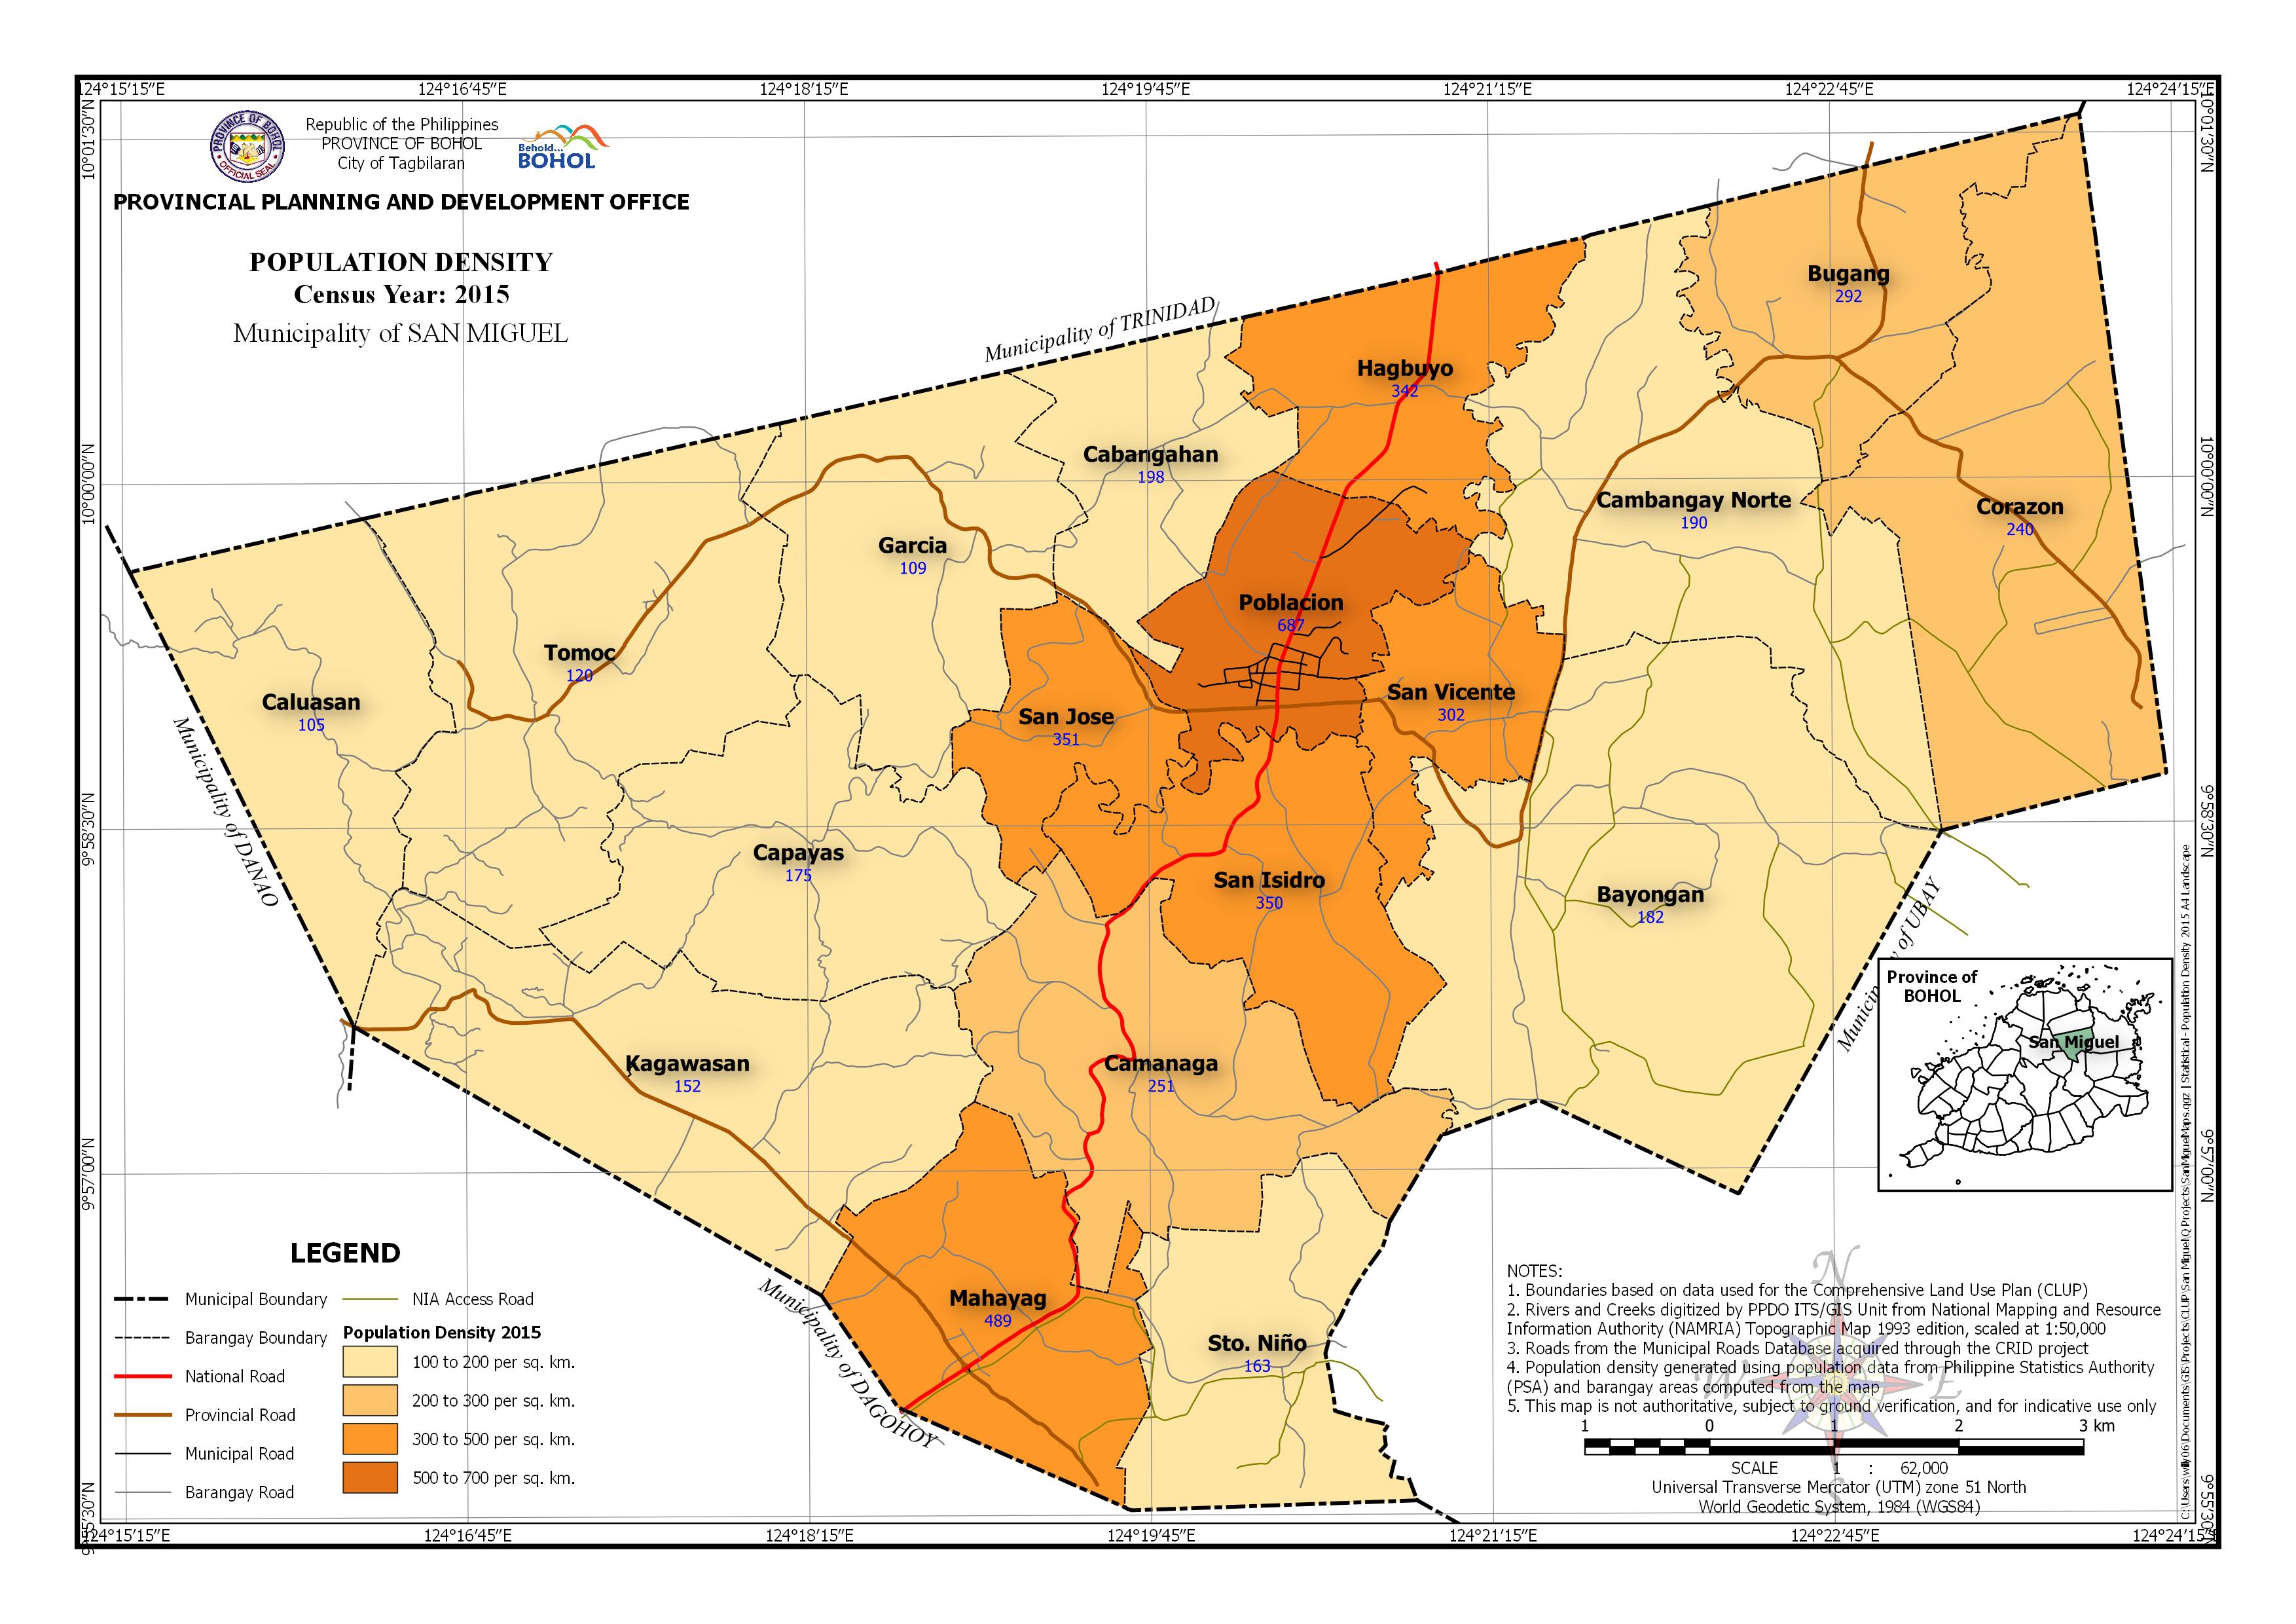 | Census Year: 2015 Download in PDF and JPG format |
| Barangay | Area | Census Year | |||||
| (Hectares) | 1990 | 1995 | 2000 | 2007 | 2010 | 2015 | |
| Bayongan | 1,250.10 | 72 | 105 | 113 | 167 | 180 | 182 |
| Bugang | 440.944 | 218 | 256 | 212 | 233 | 252 | 292 |
| Cabangahan | 339.211 | 166 | 184 | 191 | 195 | 231 | 198 |
| Caluasan | 524.448 | 84 | 89 | 103 | 106 | 129 | 105 |
| Camanaga | 656.314 | 239 | 220 | 269 | 237 | 260 | 251 |
| Cambangay Norte | 858.694 | 126 | 136 | 162 | 143 | 182 | 190 |
| Capayas | 590.621 | 146 | 148 | 182 | 180 | 175 | 175 |
| Corazon | 848.991 | 89 | 108 | 142 | 191 | 199 | 240 |
| Garcia | 569.211 | 93 | 78 | 104 | 112 | 113 | 109 |
| Hagbuyo | 367.155 | 216 | 215 | 302 | 324 | 331 | 342 |
| Kagawasan | 819.411 | 128 | 142 | 169 | 143 | 145 | 152 |
| Mahayag | 492.551 | 328 | 353 | 430 | 450 | 473 | 489 |
| Poblacion | 358.19 | 494 | 532 | 597 | 747 | 702 | 687 |
| San Isidro | 470.994 | 236 | 250 | 281 | 321 | 327 | 350 |
| San Jose | 234.559 | 214 | 237 | 280 | 280 | 353 | 351 |
| San Vicente | 248.082 | 302 | 339 | 345 | 262 | 296 | 302 |
| Santo Niño | 441.053 | 136 | 144 | 154 | 160 | 158 | 163 |
| Tomoc | 886.864 | 105 | 90 | 113 | 111 | 120 | 120 |
| Municipal | 10,397.39 | 161 | 173 | 200 | 214 | 227 | 232 |