
Download in PDF and JPG format
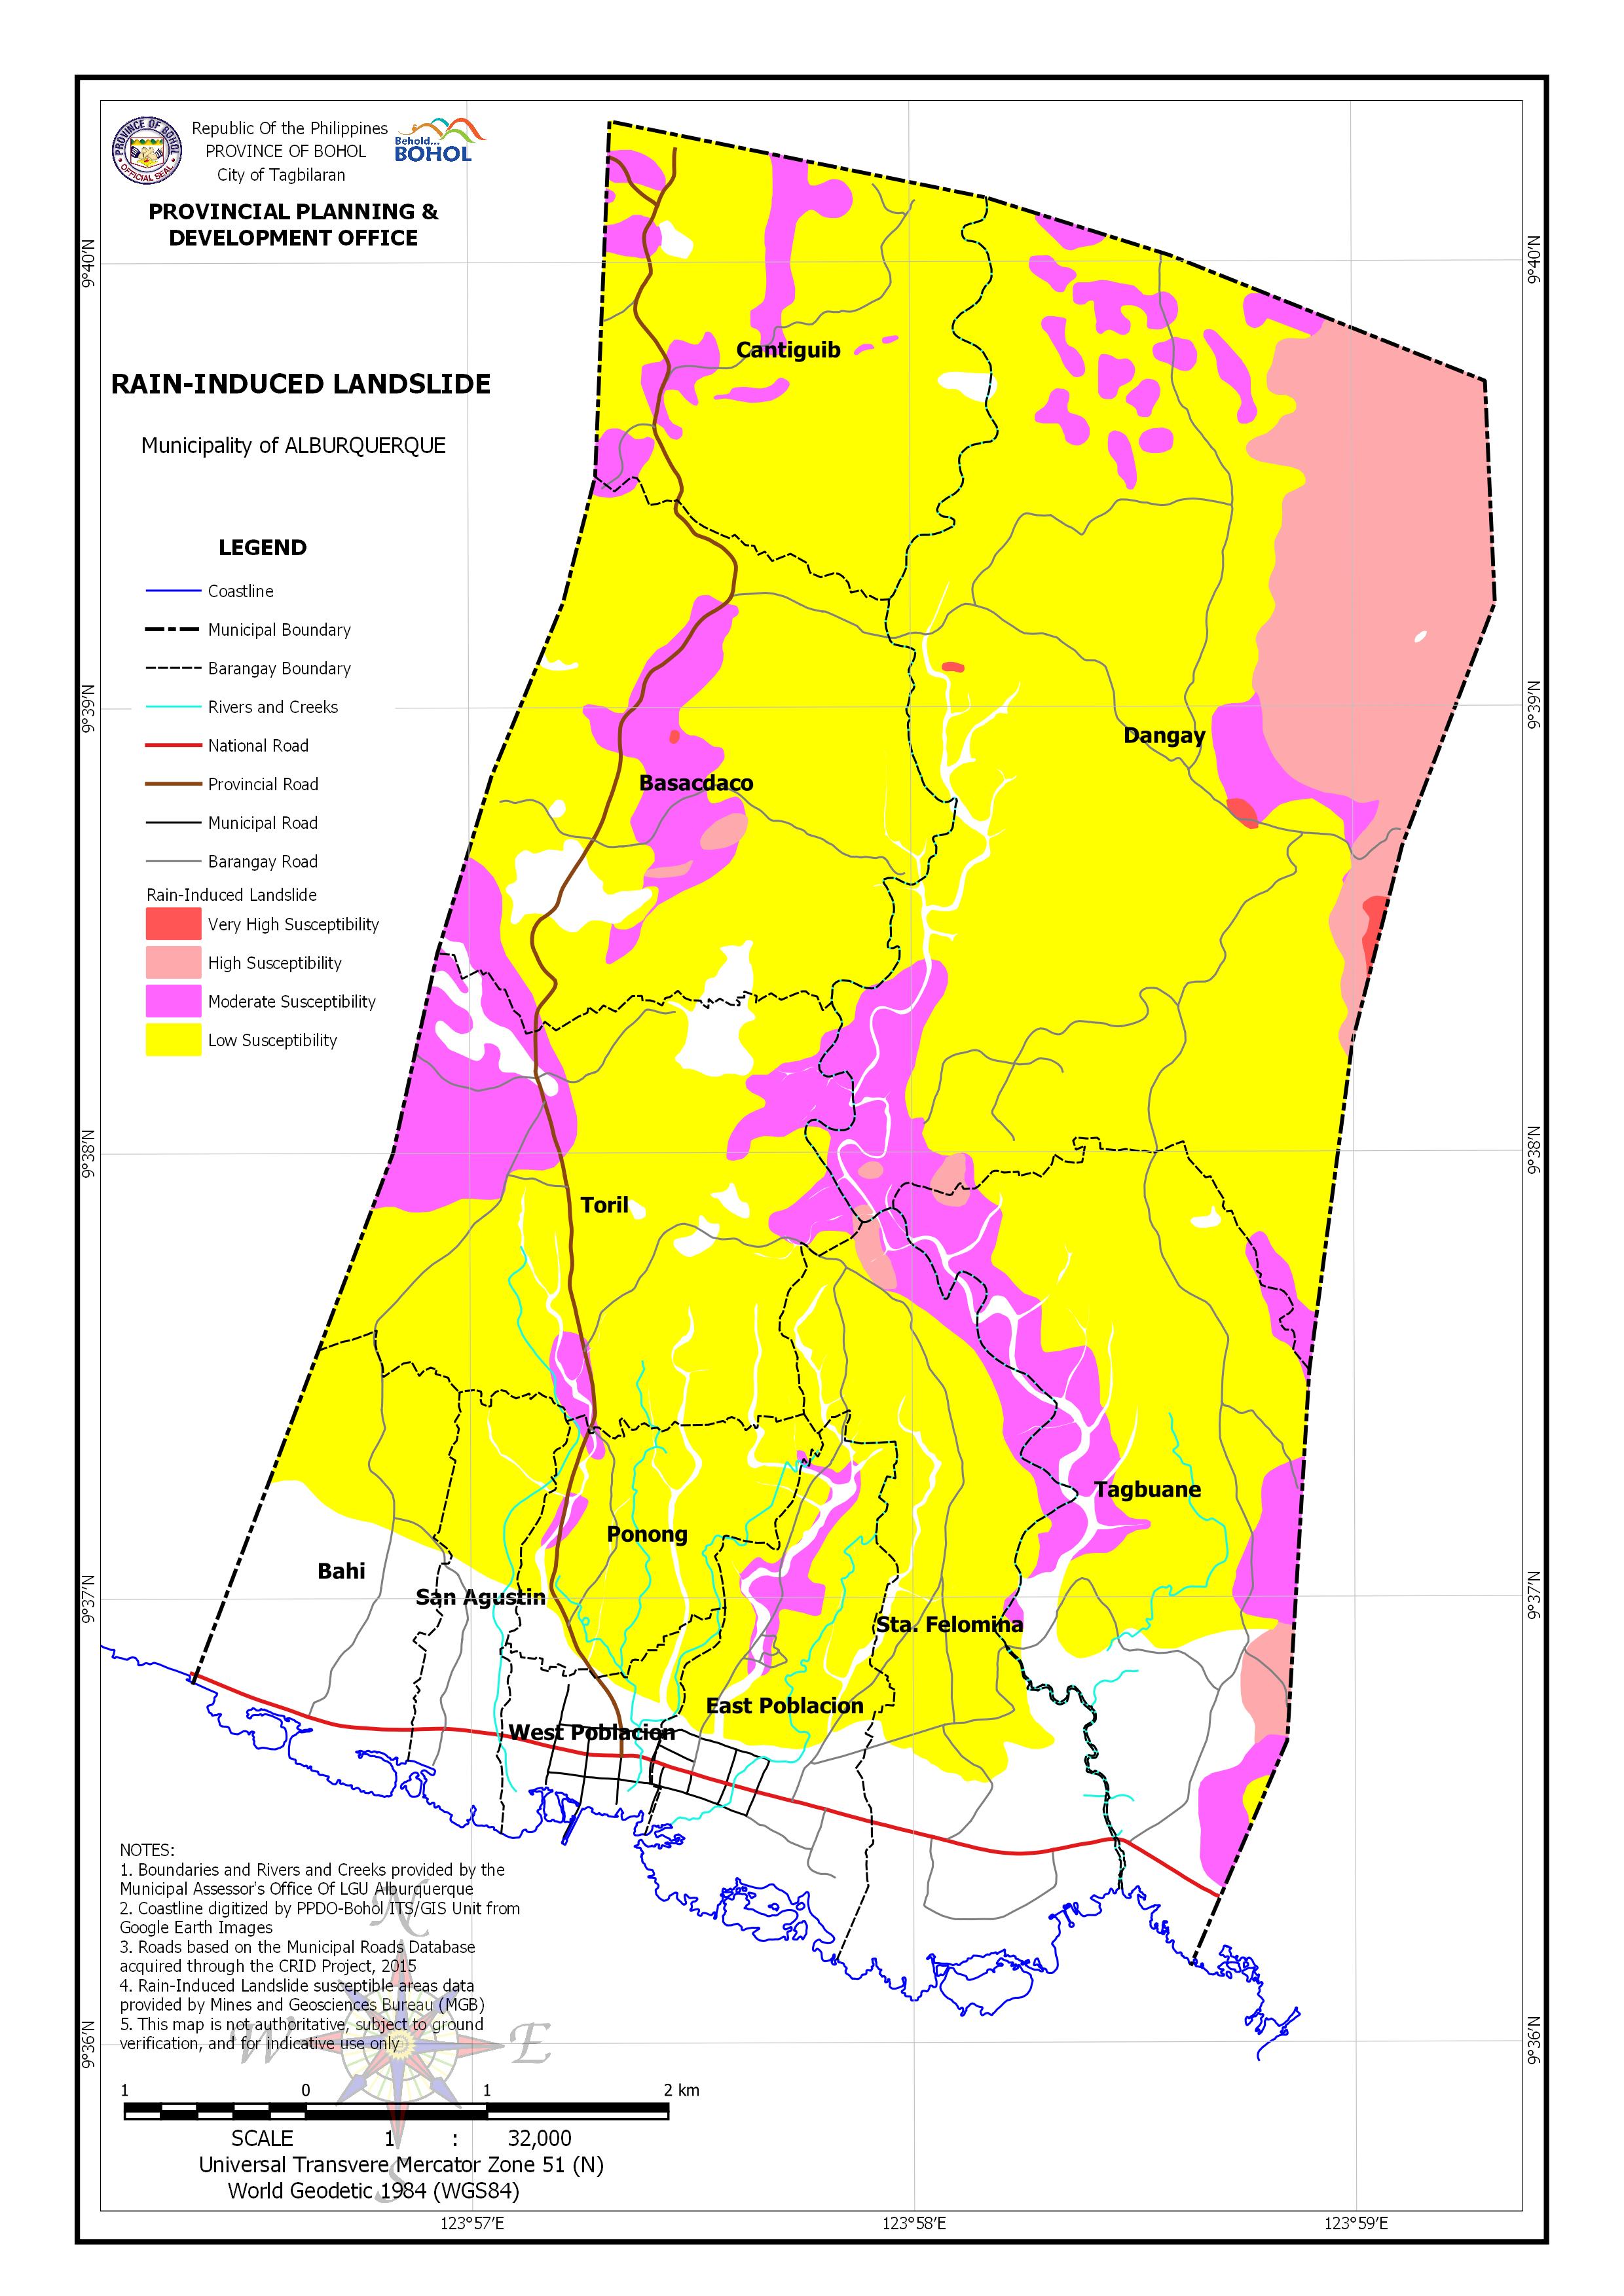
AREA EXPOSED TO RAIN-INDUCED LANDSLIDE BY BARANGAY
| Barangay | Area | Area Exposed to Very High Susceptibility | Area Exposed to High Susceptibility | Area Exposed to Moderate Susceptibility | Area Exposed to Low Susceptibility | ||||
| (Hectares) | (Hectares) | (Percentage) | (Hectares) | (Percentage) | (Hectares) | (Percentage) | (Hectares) | (Percentage) | |
| Bahi | 131.978 | 44.424 | 33.66% | ||||||
| Basacdaco | 320.521 | 0.131 | 0.04% | 3.257 | 1.02% | 50.647 | 15.80% | 245.739 | 76.67% |
| Cantiguib | 244.97 | 34.735 | 14.18% | 206.541 | 84.31% | ||||
| Dangay | 815.135 | 2.792 | 0.34% | 175.588 | 21.54% | 80.621 | 9.89% | 543.074 | 66.62% |
| East Poblacion | 141.696 | 9.564 | 6.75% | 55.508 | 39.17% | ||||
| Ponong | 89.032 | 3.04 | 3.41% | 72.186 | 81.08% | ||||
| San Agustin | 65.521 | 0.007 | 0.01% | 28.711 | 43.82% | ||||
| Sta. Felomina | 242.704 | 3.105 | 1.28% | 16.656 | 6.86% | 118.263 | 48.73% | ||
| Tagbuane | 319.398 | 9.025 | 2.83% | 63.956 | 20.02% | 164.543 | 51.52% | ||
| Toril | 308.17 | 0.244 | 0.08% | 69.522 | 22.56% | 209.56 | 68.00% | ||
| West Poblacion | 47.003 | 6.769 | 14.40% | ||||||
| Total | 2,726.13 | 2.923 | 0.11% | 191.219 | 7.01% | 328.749 | 12.06% | 1,695.32 | 62.19% |