
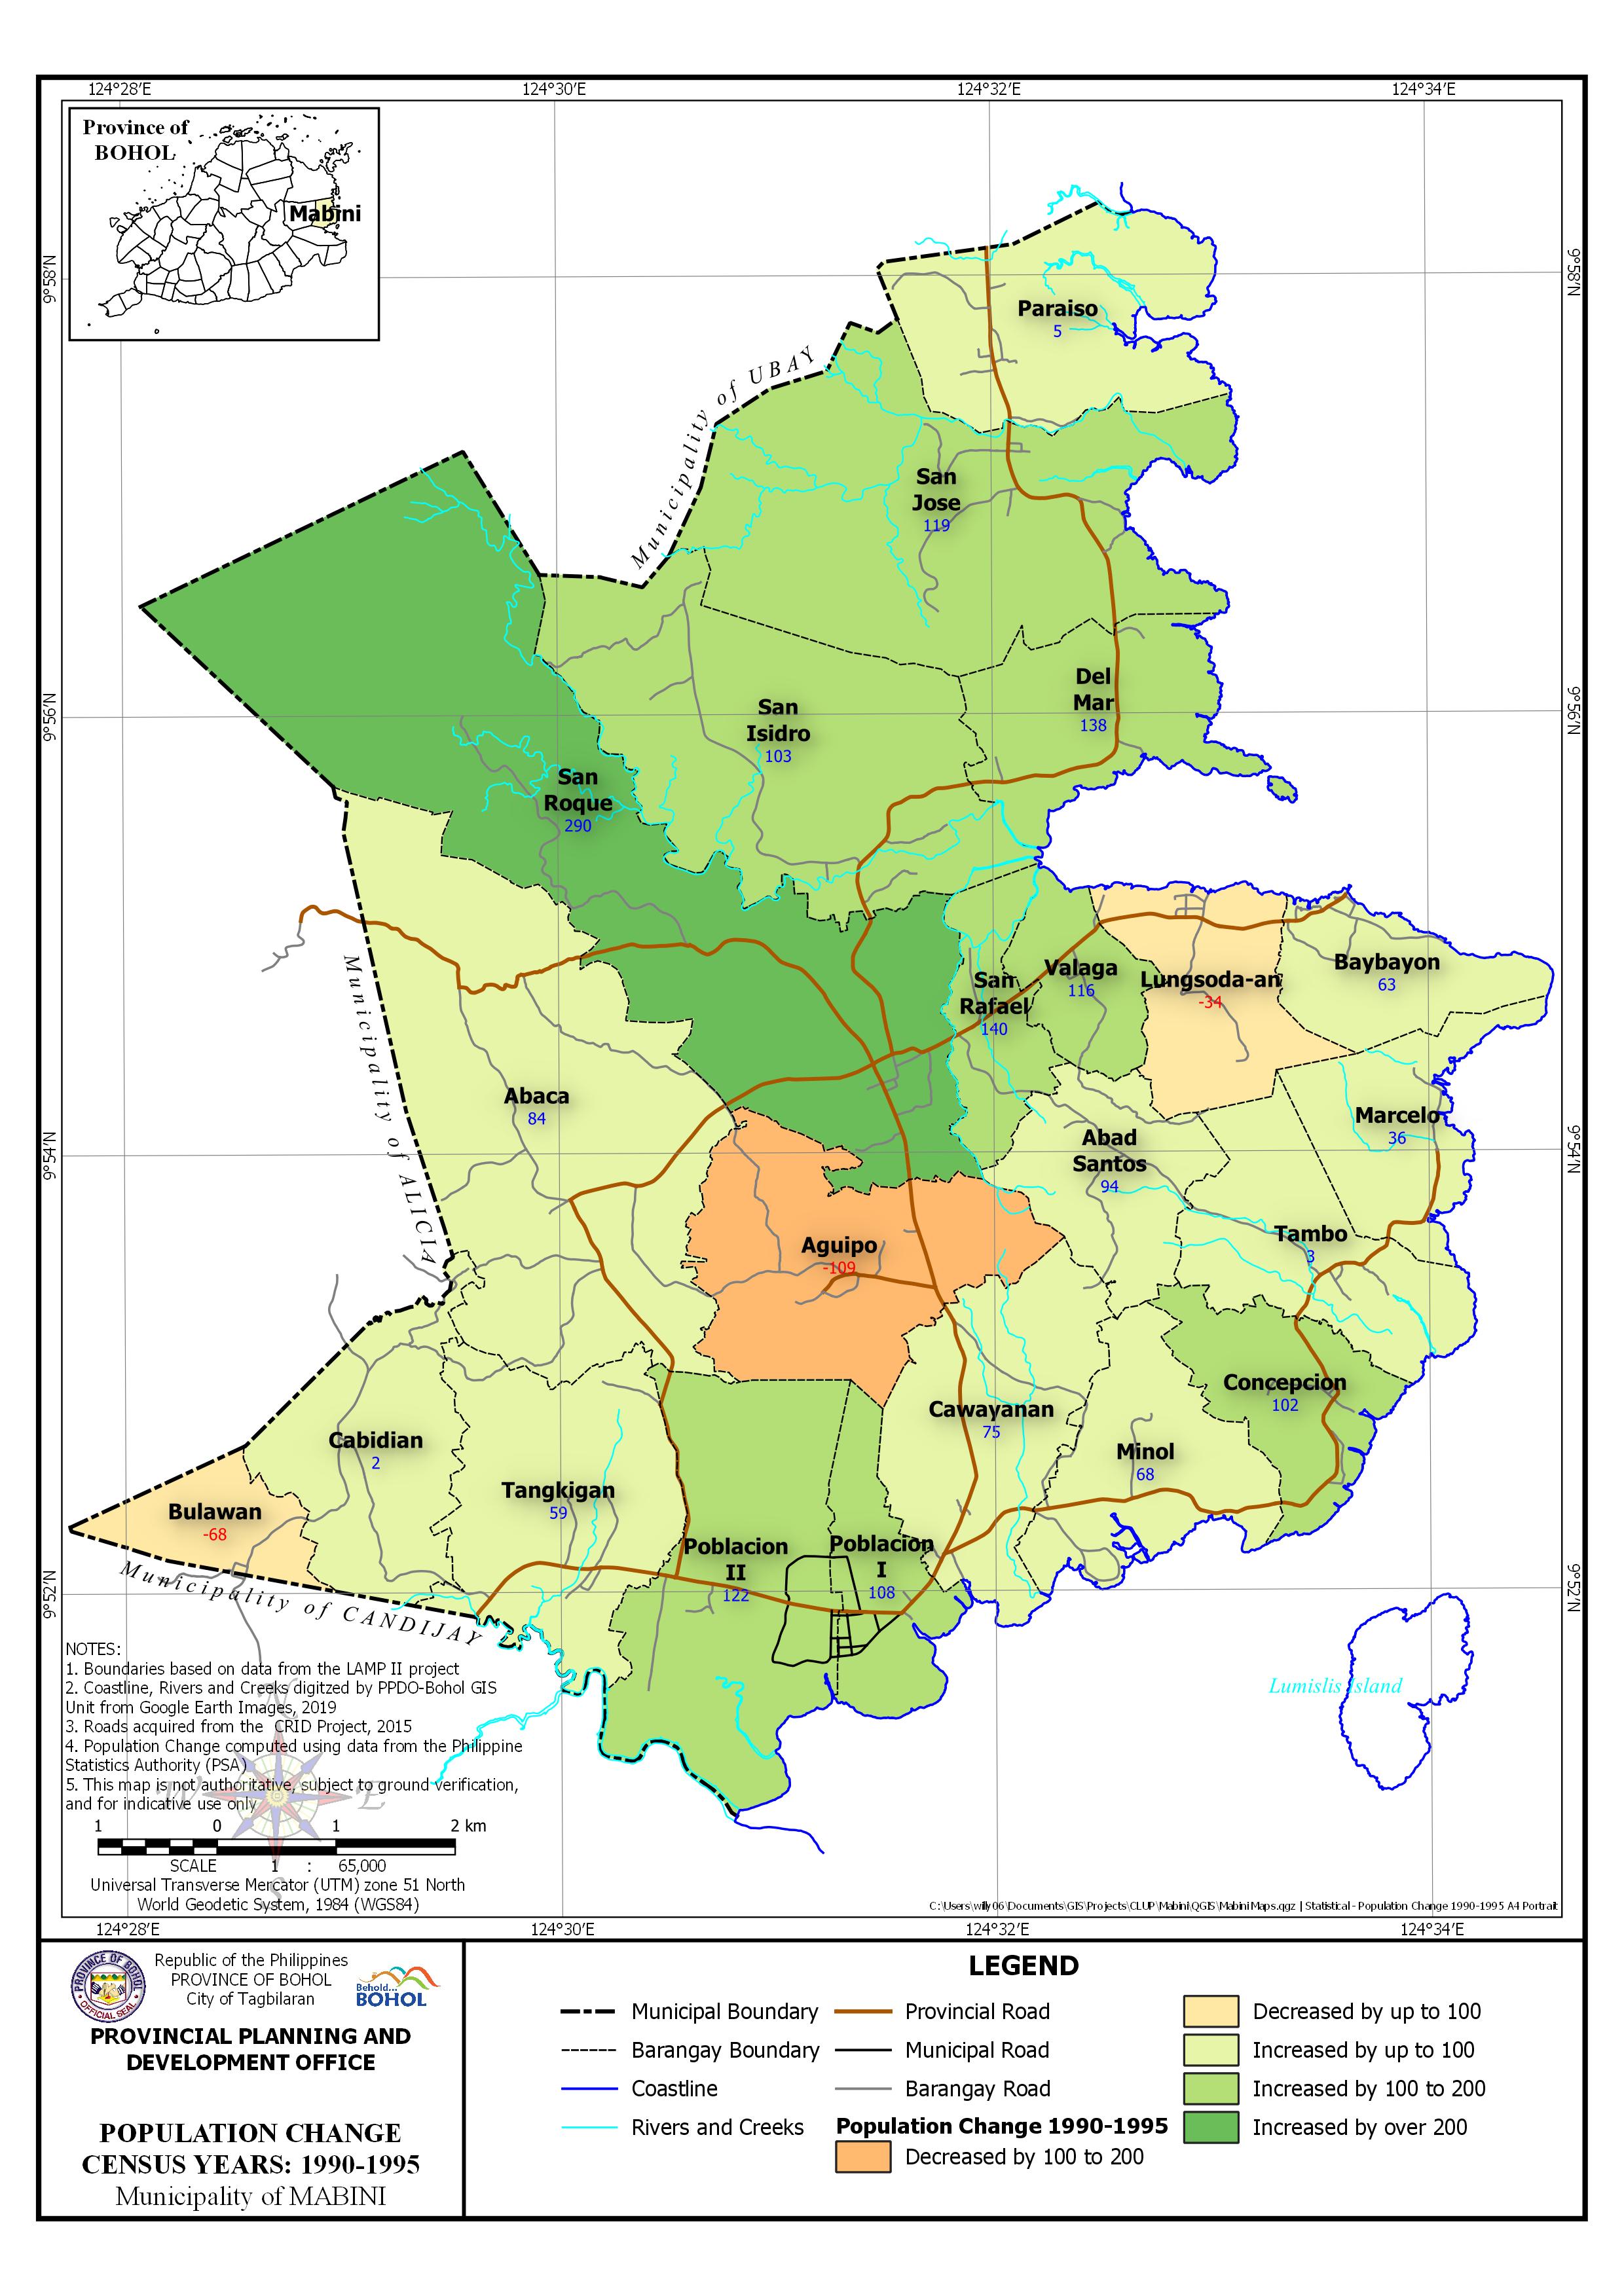
 | Census Year: 1990-1995 Download in PDF and JPG format |
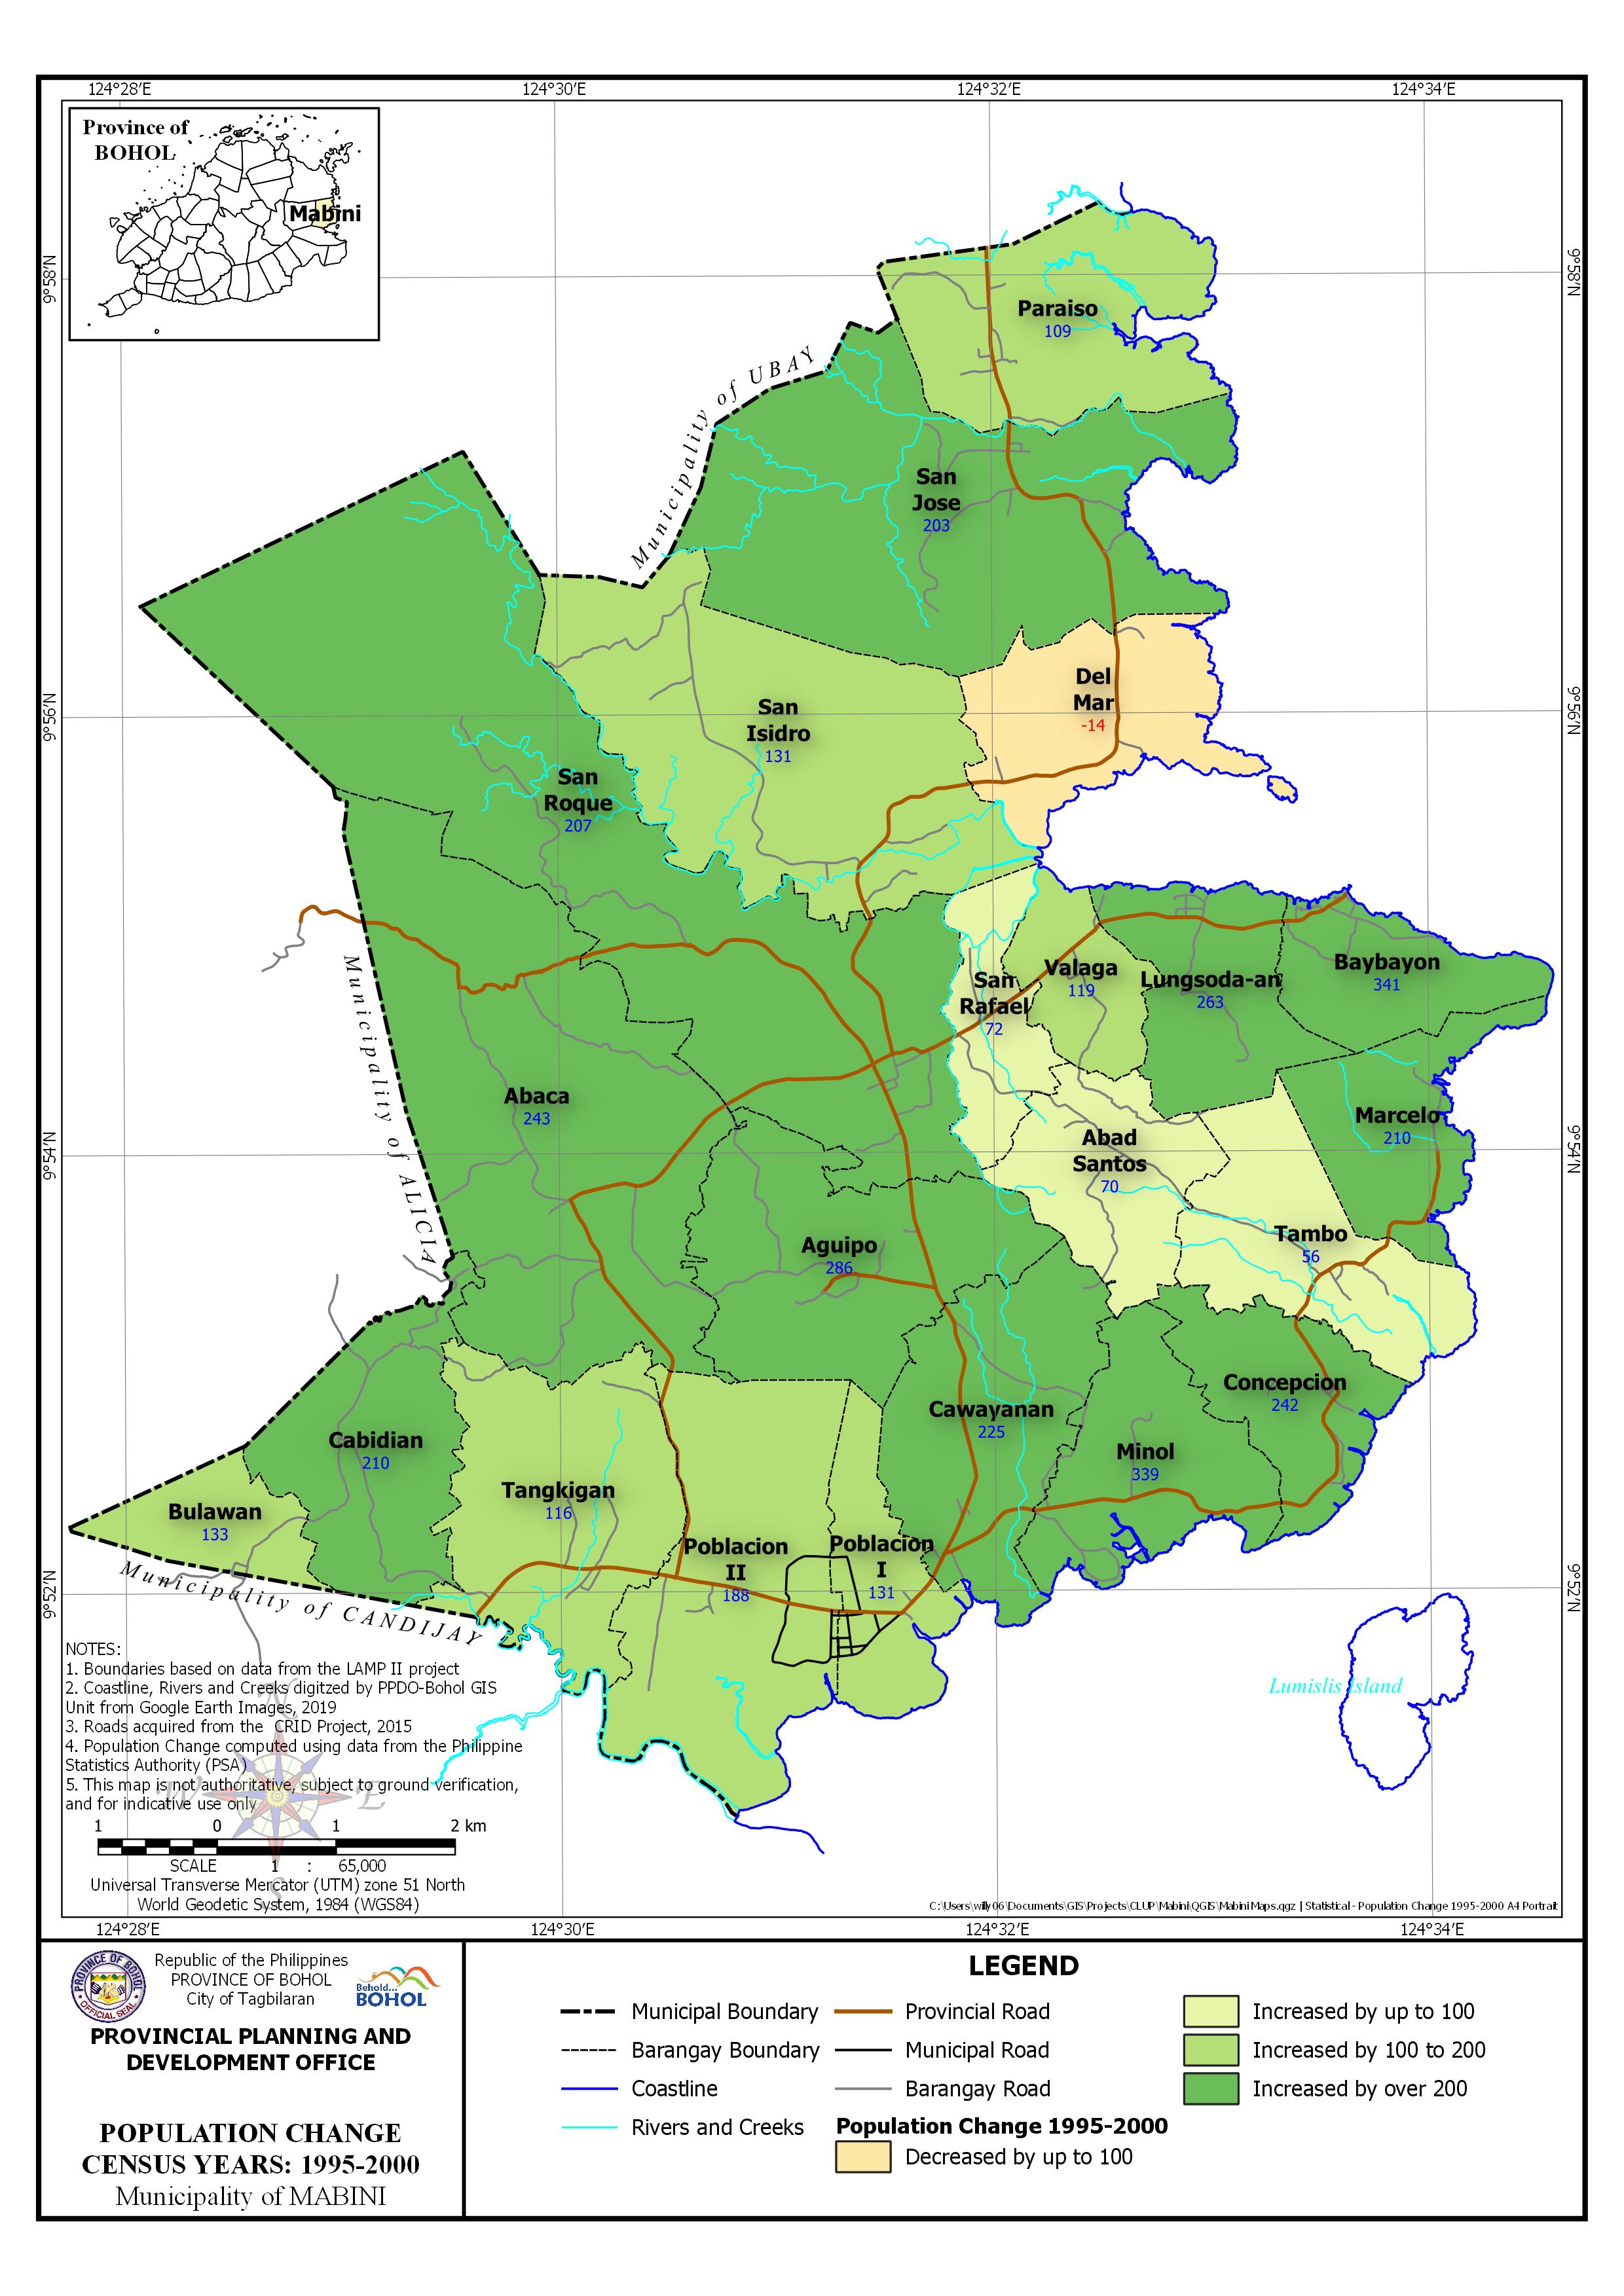 | Census Year: 1995-2000 Download in PDF and JPG format |
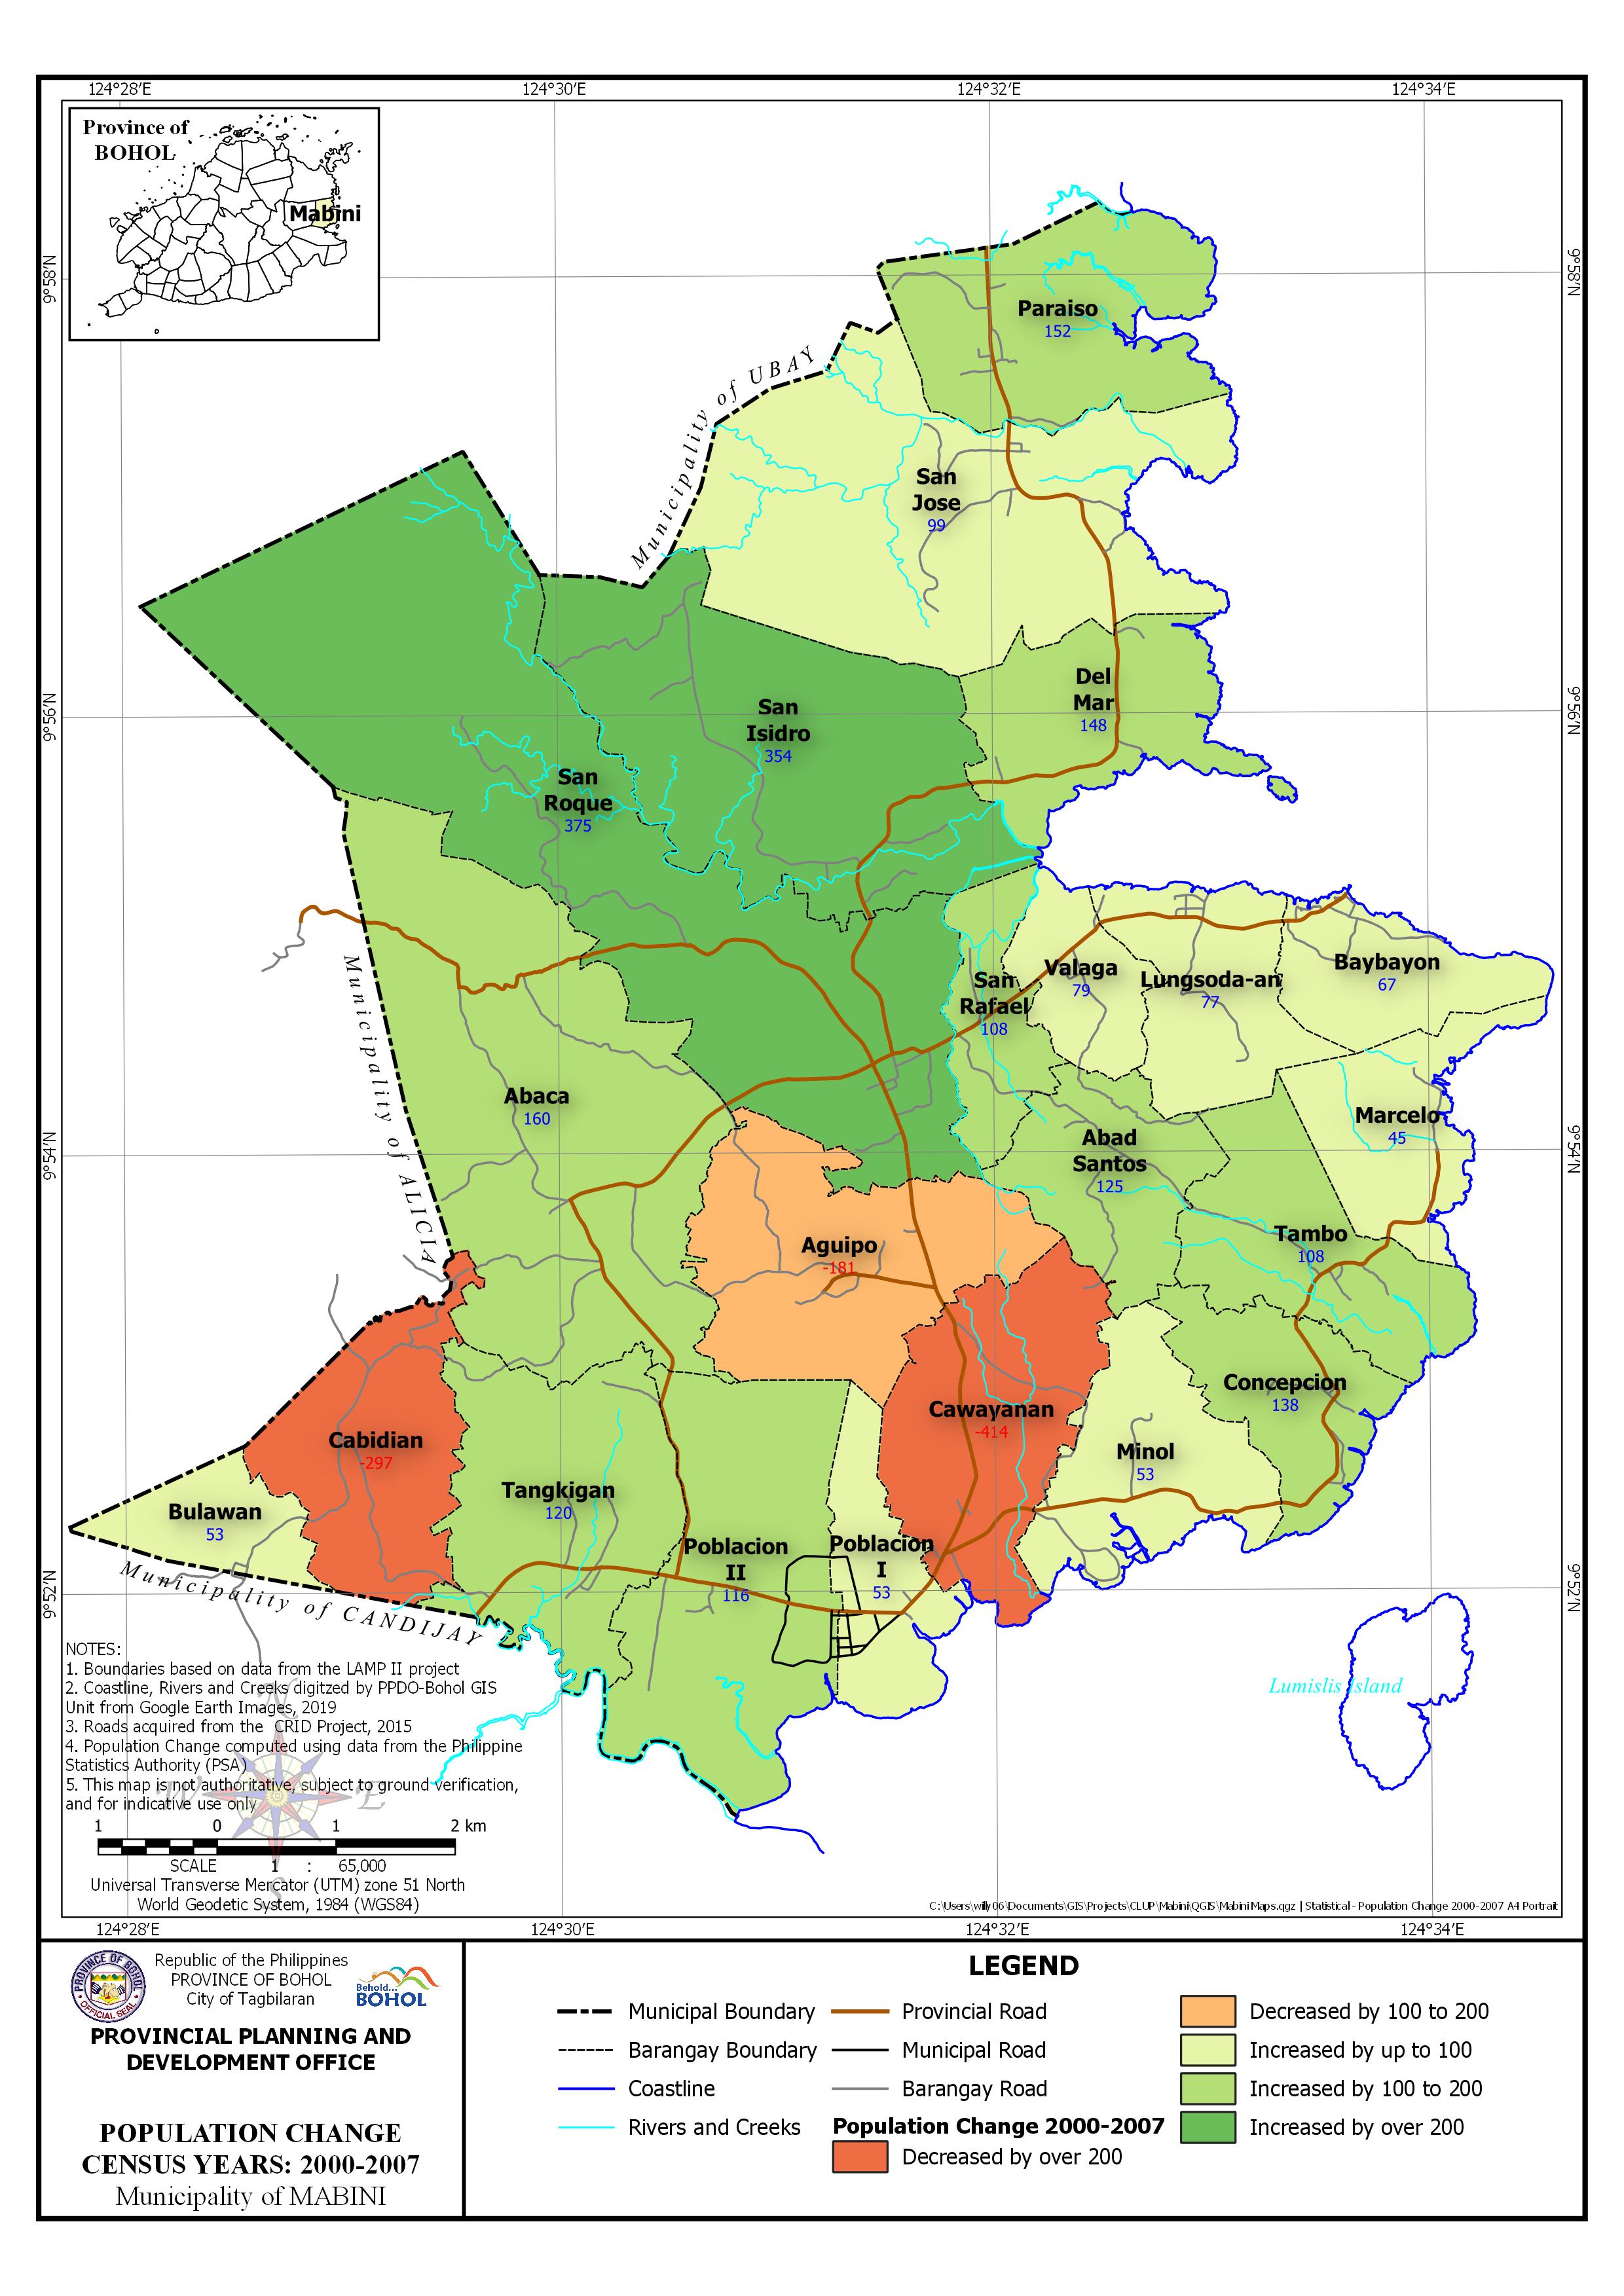 | Census Year: 2000-2007 Download in PDF and JPG format |
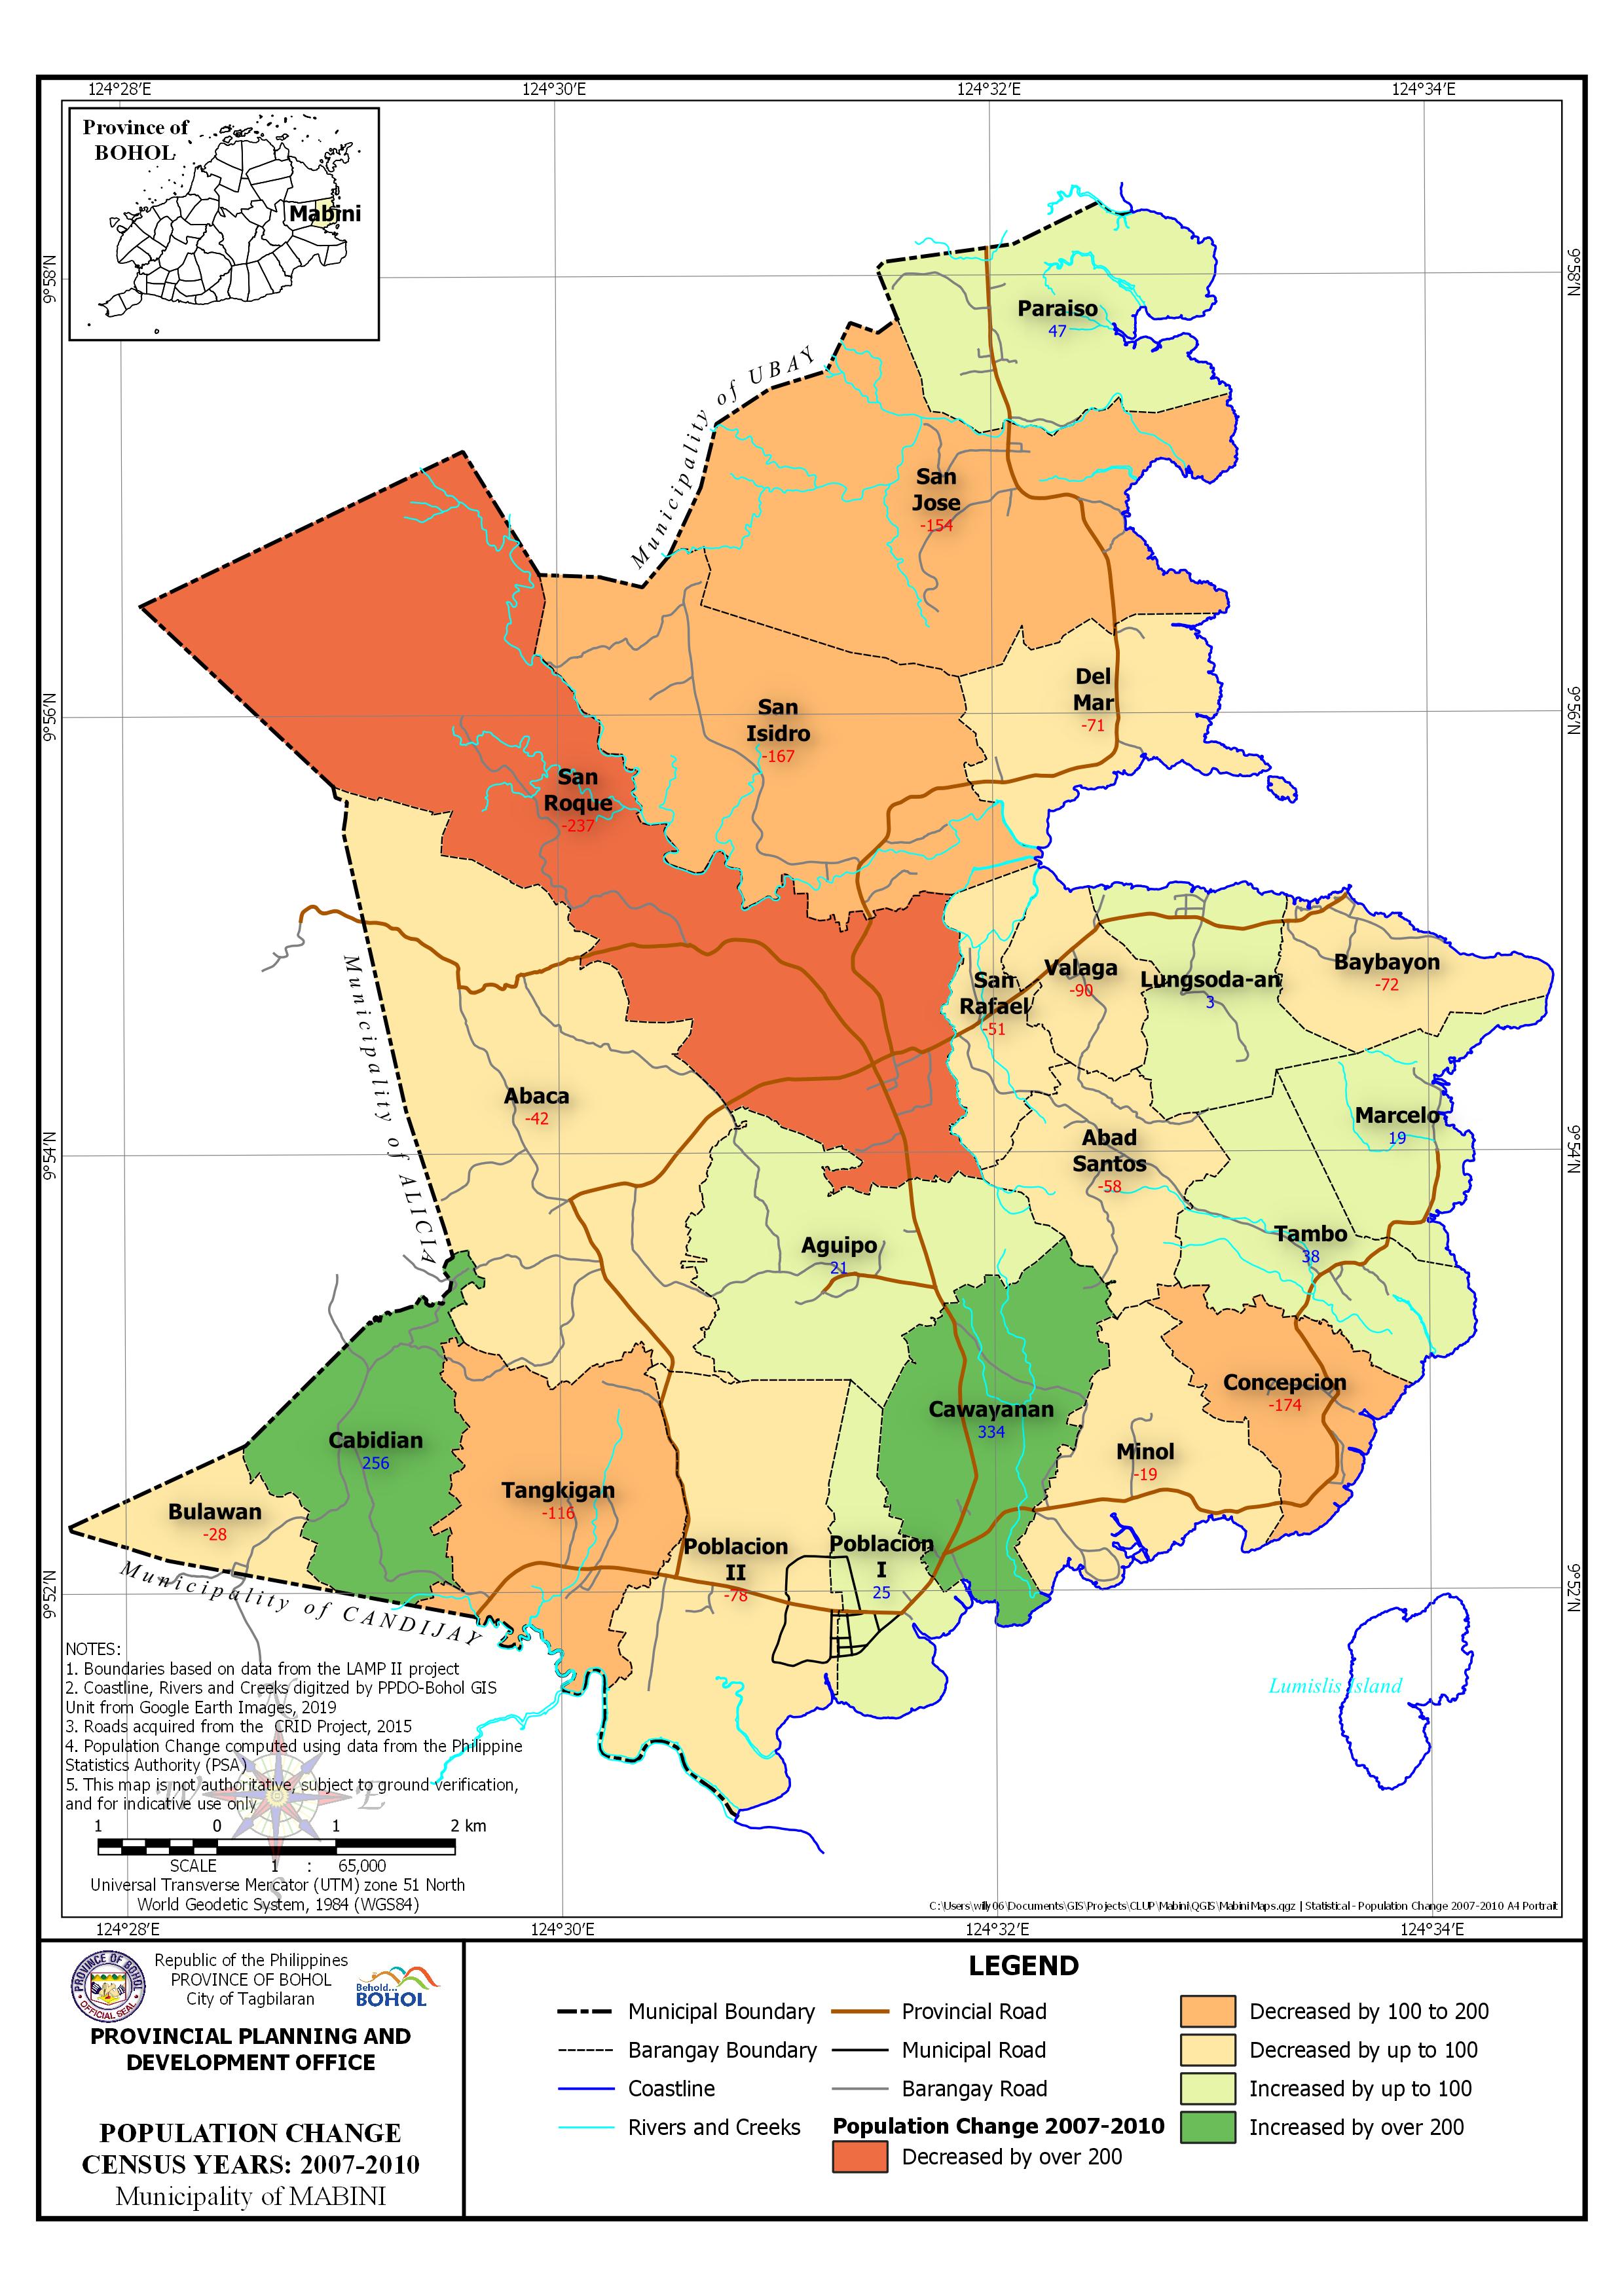 | Census Year: 2007-2010 Download in PDF and JPG format |
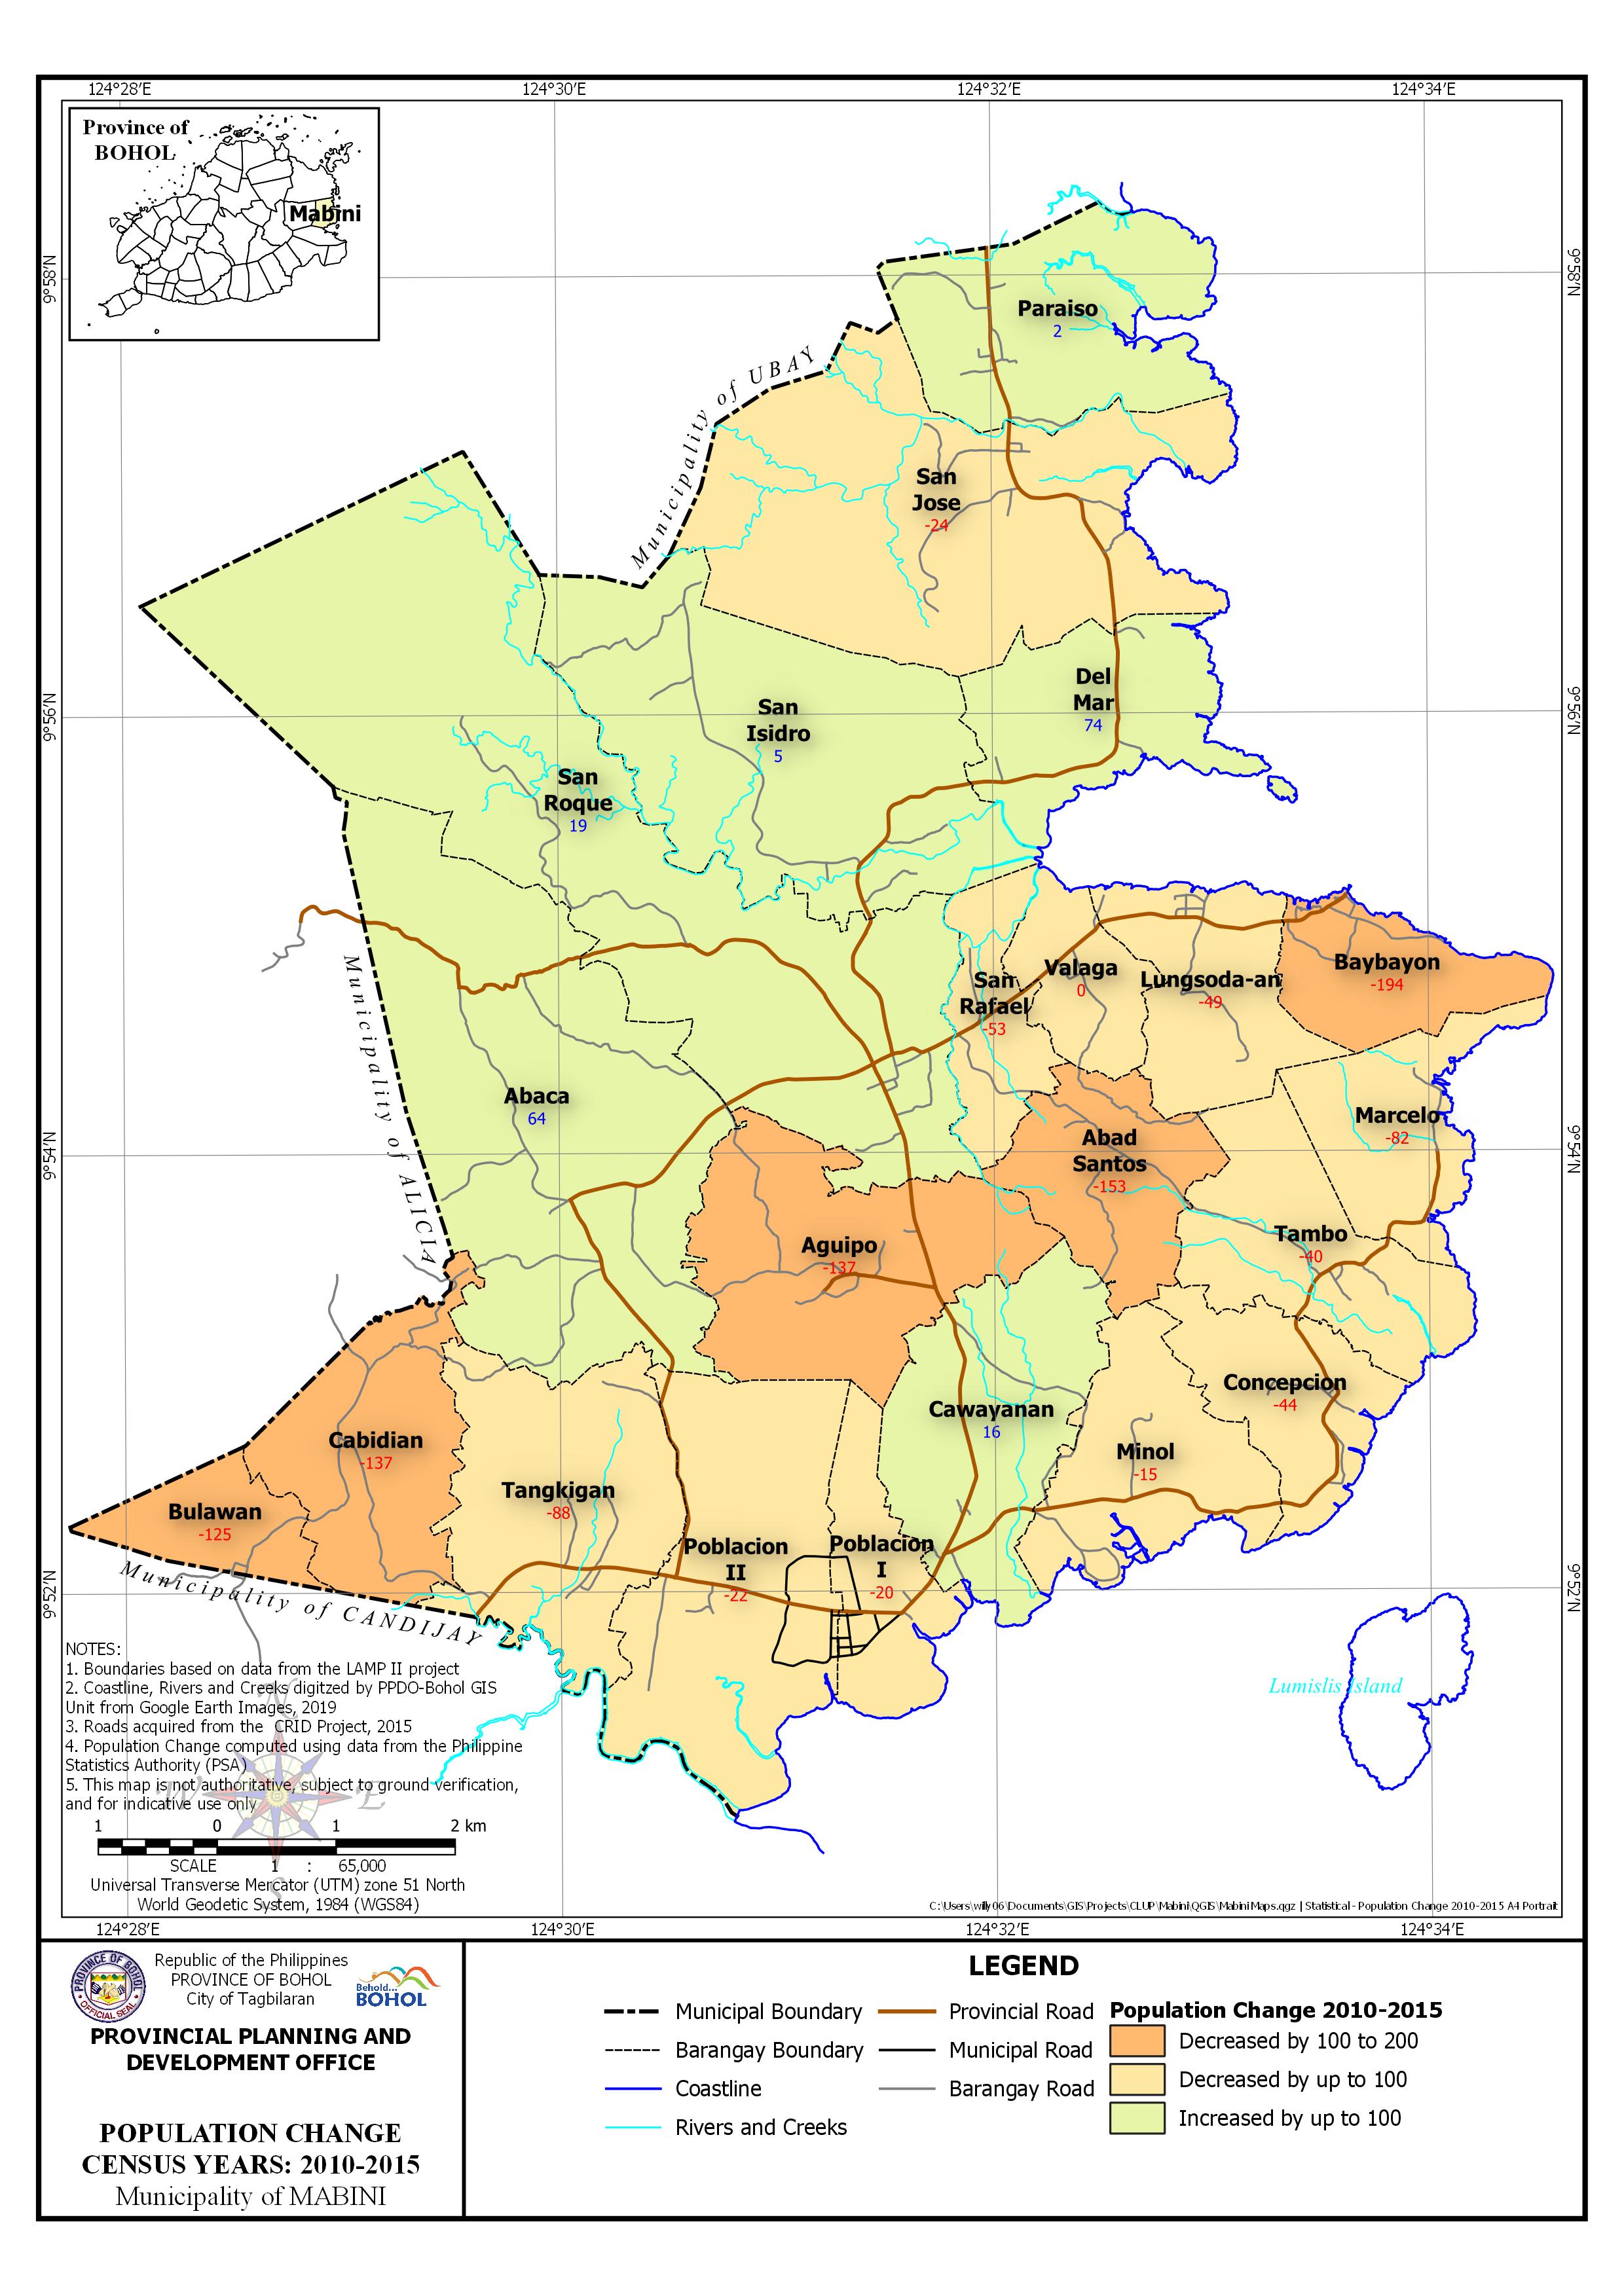 | Census Year: 2010-2015 Download in PDF and JPG format |
| Barangay | Census Years | ||||
| 1990 – 1995 | 1995 – 2000 | 2000 – 2007 | 2007 – 2010 | 2010 – 2015 | |
| Abaca | 84 | 243 | 160 | -42 | 64 |
| Abad Santos | 94 | 70 | 125 | -58 | -153 |
| Aguipo | -109 | 286 | -181 | 21 | -137 |
| Baybayon | 63 | 341 | 67 | -72 | -194 |
| Bulawan | -68 | 133 | 53 | -28 | -125 |
| Cabidian | 2 | 210 | -297 | 256 | -137 |
| Cawayanan | 75 | 225 | -414 | 334 | 16 |
| Concepcion | 102 | 242 | 138 | -174 | -44 |
| Del Mar | 138 | -14 | 148 | -71 | 74 |
| Lungsoda-an | -34 | 263 | 77 | 3 | -49 |
| Marcelo | 36 | 210 | 45 | 19 | -82 |
| Minol | 68 | 339 | 53 | -19 | -15 |
| Paraiso | 5 | 109 | 152 | 47 | 2 |
| Poblacion I | 108 | 131 | 53 | 25 | -20 |
| Poblacion II | 122 | 188 | 116 | -78 | -22 |
| San Isidro | 103 | 131 | 354 | -167 | 5 |
| San Jose | 119 | 203 | 99 | -154 | -24 |
| San Rafael | 140 | 72 | 108 | -51 | -53 |
| San Roque | 290 | 207 | 375 | -237 | 19 |
| Tambo | 3 | 56 | 108 | 38 | -40 |
| Tangkigan | 59 | 116 | 120 | -116 | -88 |
| Valaga | 116 | 119 | 79 | -90 | |
| MUNICIPAL | 1,516 | 3,880 | 1,538 | -614 | -1,003 |