
LIQUEFACTION HAZARD MAP, 2016 update
Download in JPG or in PDF formats
LIQUEFACTION HAZARD MAP, 2008

Download in JPG or in PDF formats
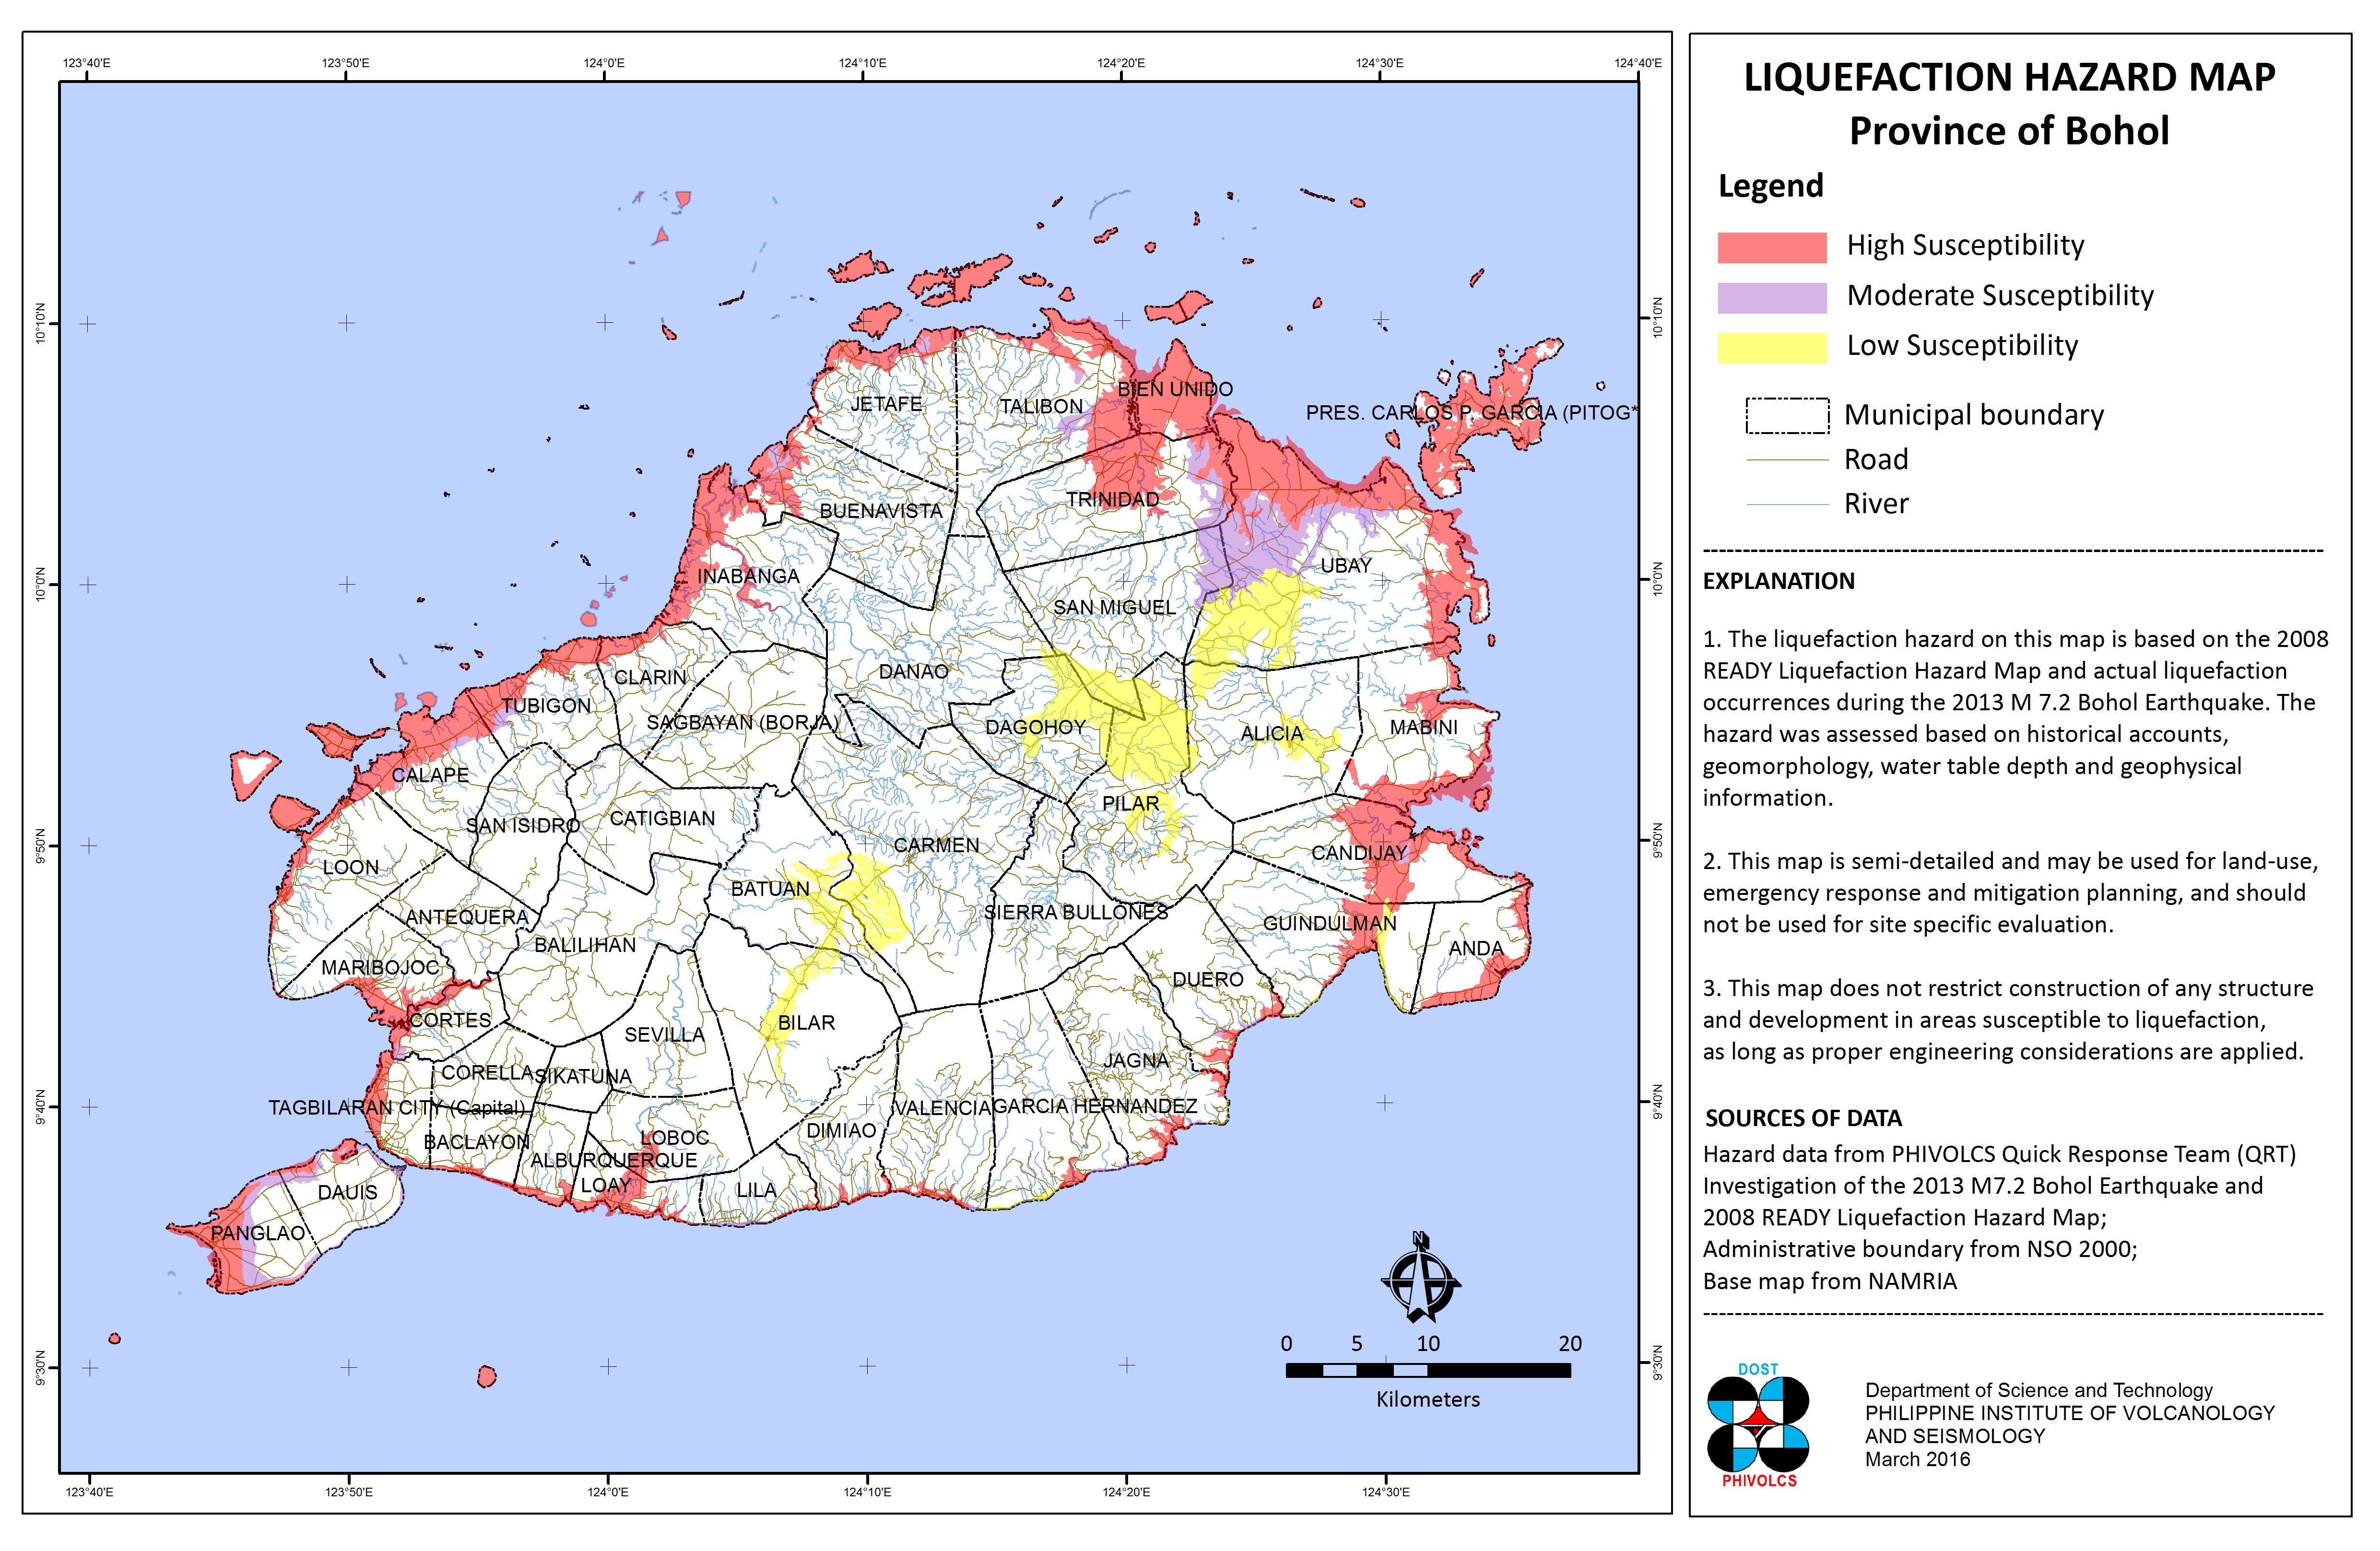
The Liquefaction Hazard Map shows areas susceptible to liquefaction categorized as follows: High, Moderate, and, Low Susceptibility. The map was based on the geology, presence of active faults, historical accounts of liquefaction, geomorphology and hydrology of the area and preliminary microtremor survey data utilized to validate type of underlying materials.
Soil liquefaction occurs when, because of the shaking during an earthquake, water-saturated granular materials (such as sand) temporarily loses its strength and transforms from solid to liquid. Soil liquefaction may cause rigid structures, like buildings and bridges, to tilt or sink into the liquefied deposit. (Wikipedia)
This map is semi-detailed and may be used for land use, emergency response and mitigation planning, and should not be used for site specific evaluation. The liquefaction hazard map do not restrict construction of any structures and development in areas susceptible to liquefaction as long as proper engineering considerations are applied.
The hazard data is acquired from Philippine Institute of Volcanology and Seismology (PhIVolcS) 2008. Administrative boundary is from National Statistics Office (NSO), 2000. Topographic map 1:50,000 scale is from the National Mapping and Resource Information Authority (NAMRIA). This Liquefaction Hazard Map is acquired from the Hazards Mapping and Assessment for Effective Community-Based Disaster Risk Management (READY) Project through PhIVolcS.
Available in JPG and PDF, this map may be downloaded and used for free provided that: a.) no alterations are made to the map; b.) proper citations be referred to the sources mentioned above; and, c.) all logos appearing on the map should also appear on your document.