
Download in PDF and JPG format
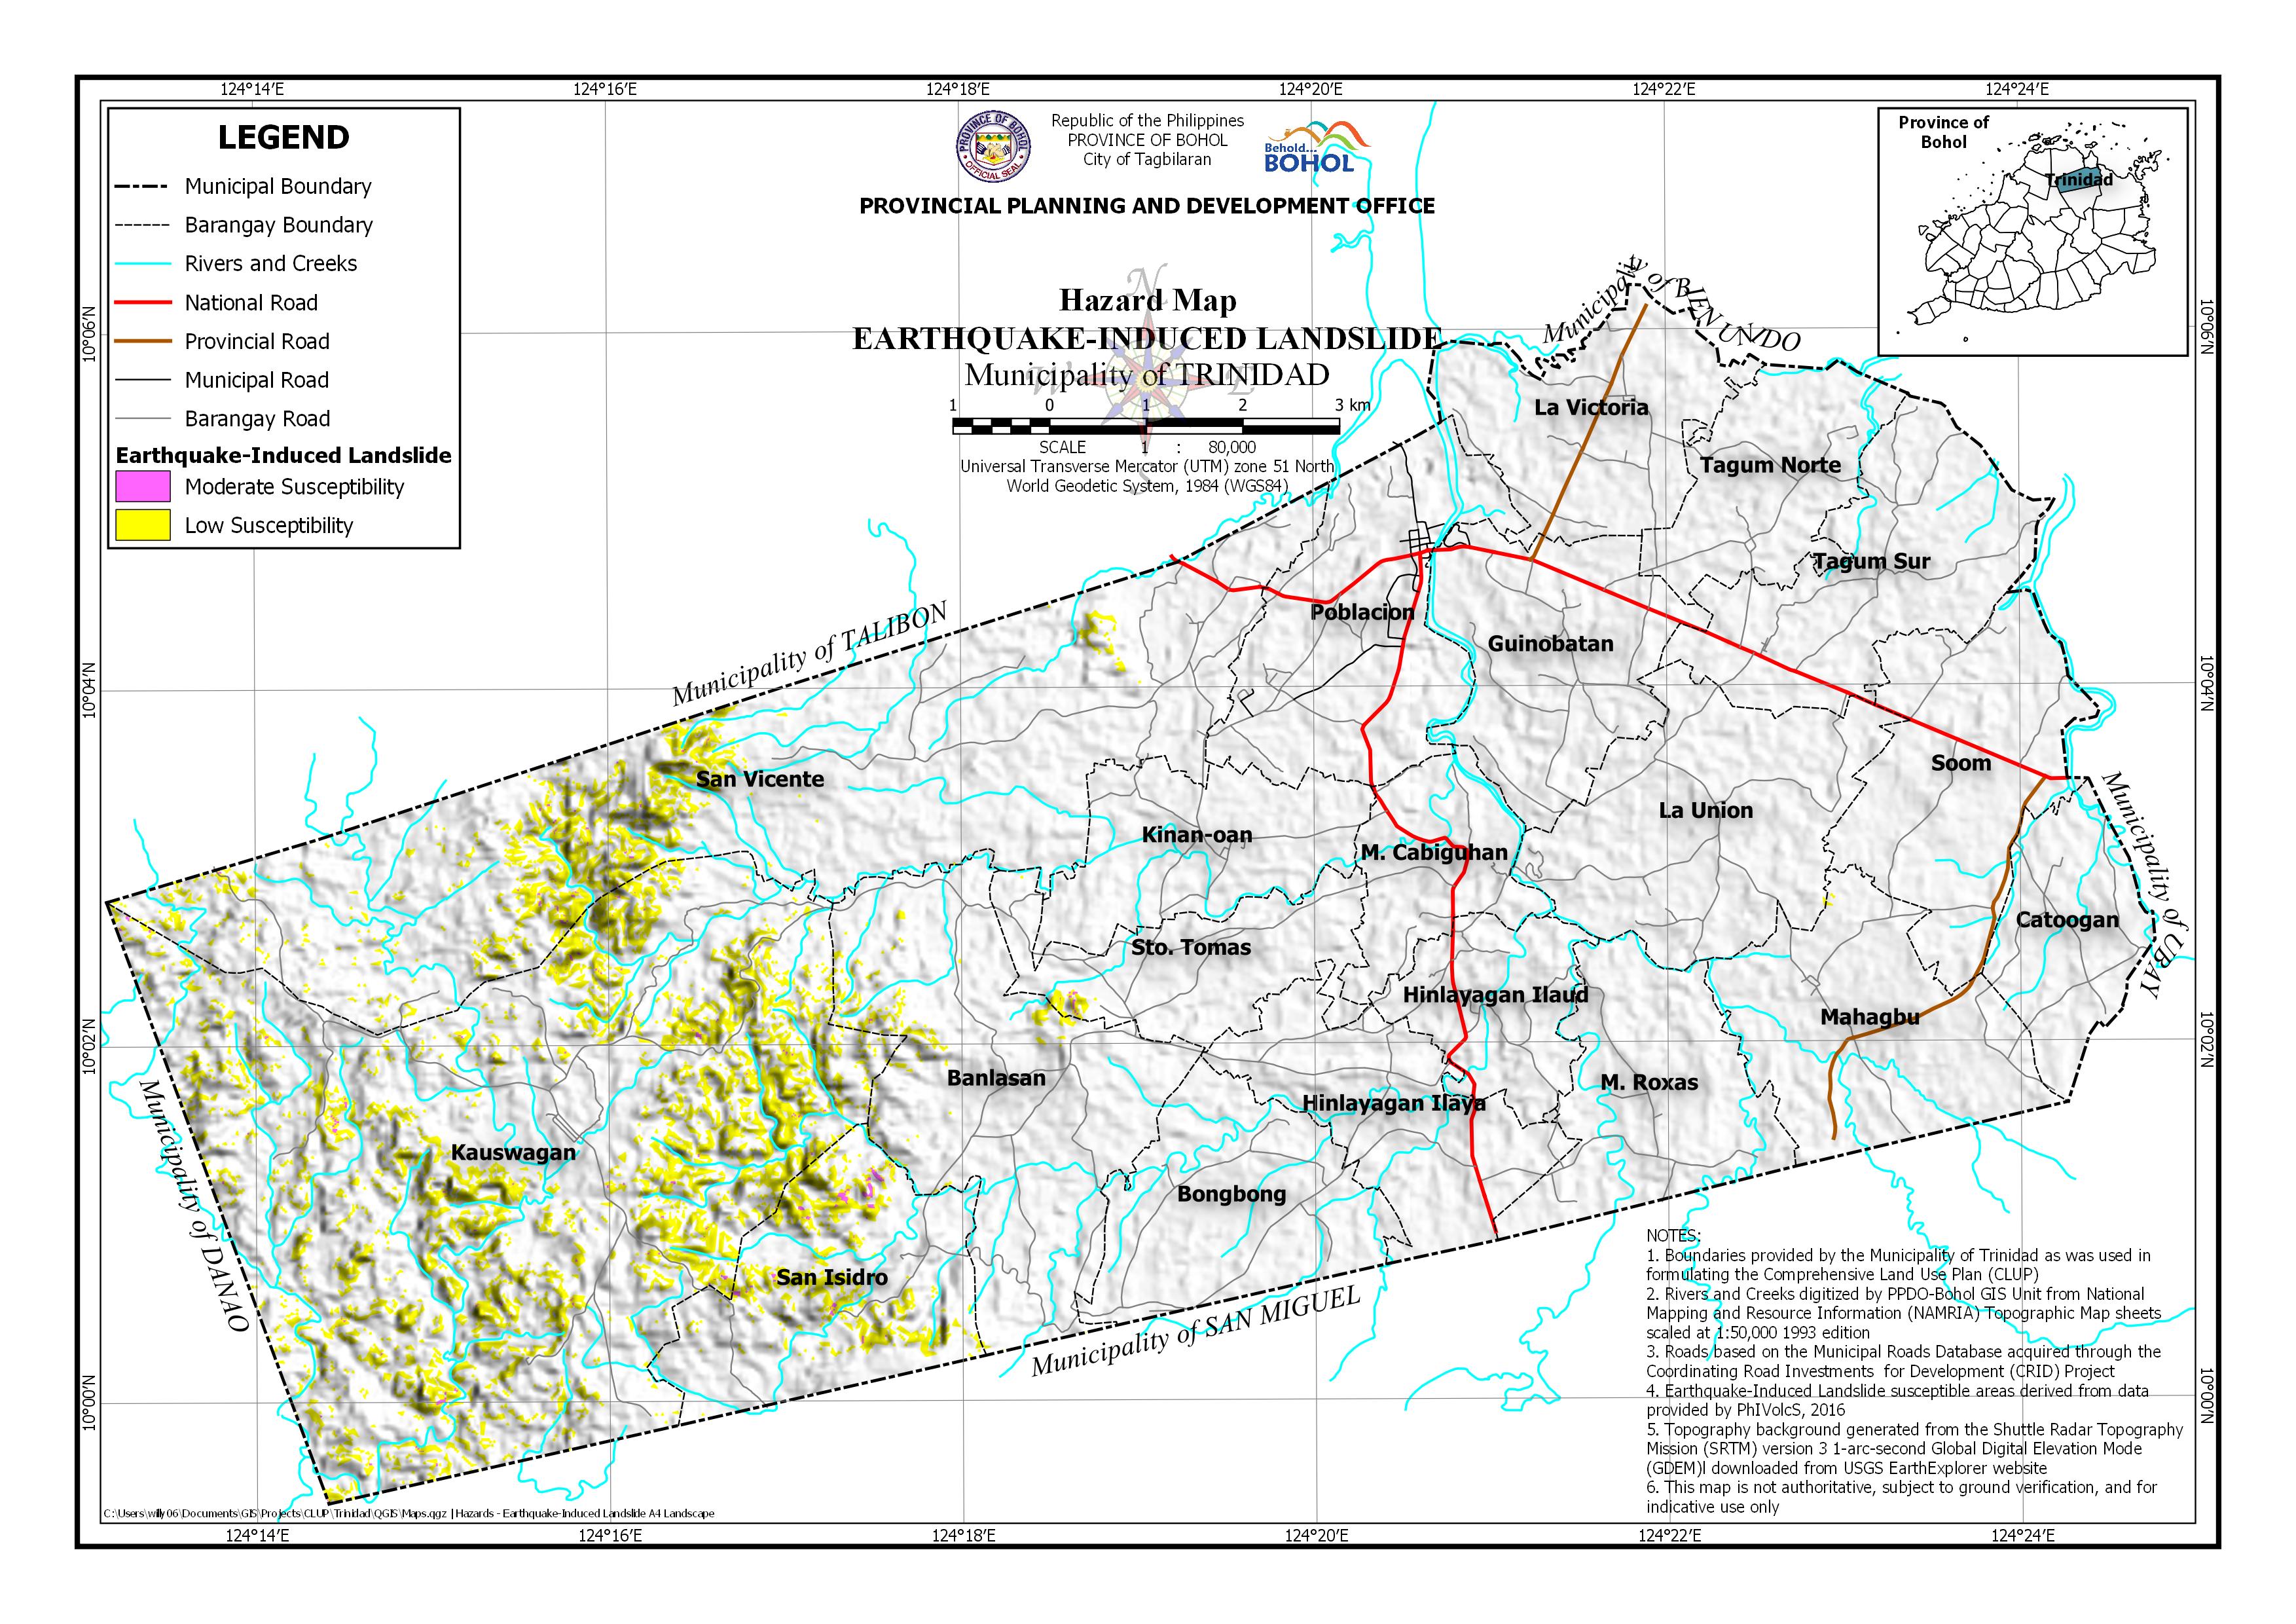
AREA EXPOSED TO EARTHQUAKE-INDUCED LANDSLIDE HAZARD BY BARANGAY
| Barangay | Area | Barangay Area Exposed to Moderate Susceptibility | Barangay Area Exposed to Low Susceptibility | ||
| (Hectares) | (Hectares) | (Percentage) | (Hectares) | (Percentage) | |
| Banlasan | 988.739 | 0.215 | 0.02% | 14.015 | 1.42% |
| Bongbong | 540.748 | ||||
| Catoogan | 335.1 | ||||
| Guinobatan | 563.906 | ||||
| Hinlayagan Ilaud | 306.645 | ||||
| Hinlayagan Ilaya | 486.672 | ||||
| Kauswagan | 3,091.78 | 8.797 | 0.29% | 370.499 | 11.98% |
| Kinan-oan | 439.893 | ||||
| La Union | 724.351 | 0.129 | 0.02% | ||
| La Victoria | 516.037 | ||||
| M. Cabiguhan | 306.975 | ||||
| M. Roxas | 512.497 | ||||
| Mahagbu | 627.355 | 0.179 | 0.03% | ||
| Poblacion | 671.786 | ||||
| San Isidro | 620.653 | 4.966 | 0.80% | 61.143 | 9.85% |
| San Vicente | 2,233.06 | 2.982 | 0.13% | 110.599 | 4.95% |
| Soom | 616.046 | ||||
| Sto. Tomas | 401.716 | 0.75 | 0.19% | 3.957 | 0.99% |
| Tagum Norte | 392.375 | ||||
| Tagum Sur | 613.829 | ||||
| Total | 14,990.16 | 17.709 | 0.12% | 560.521 | 3.74% |