
Download in PDF and JPG format
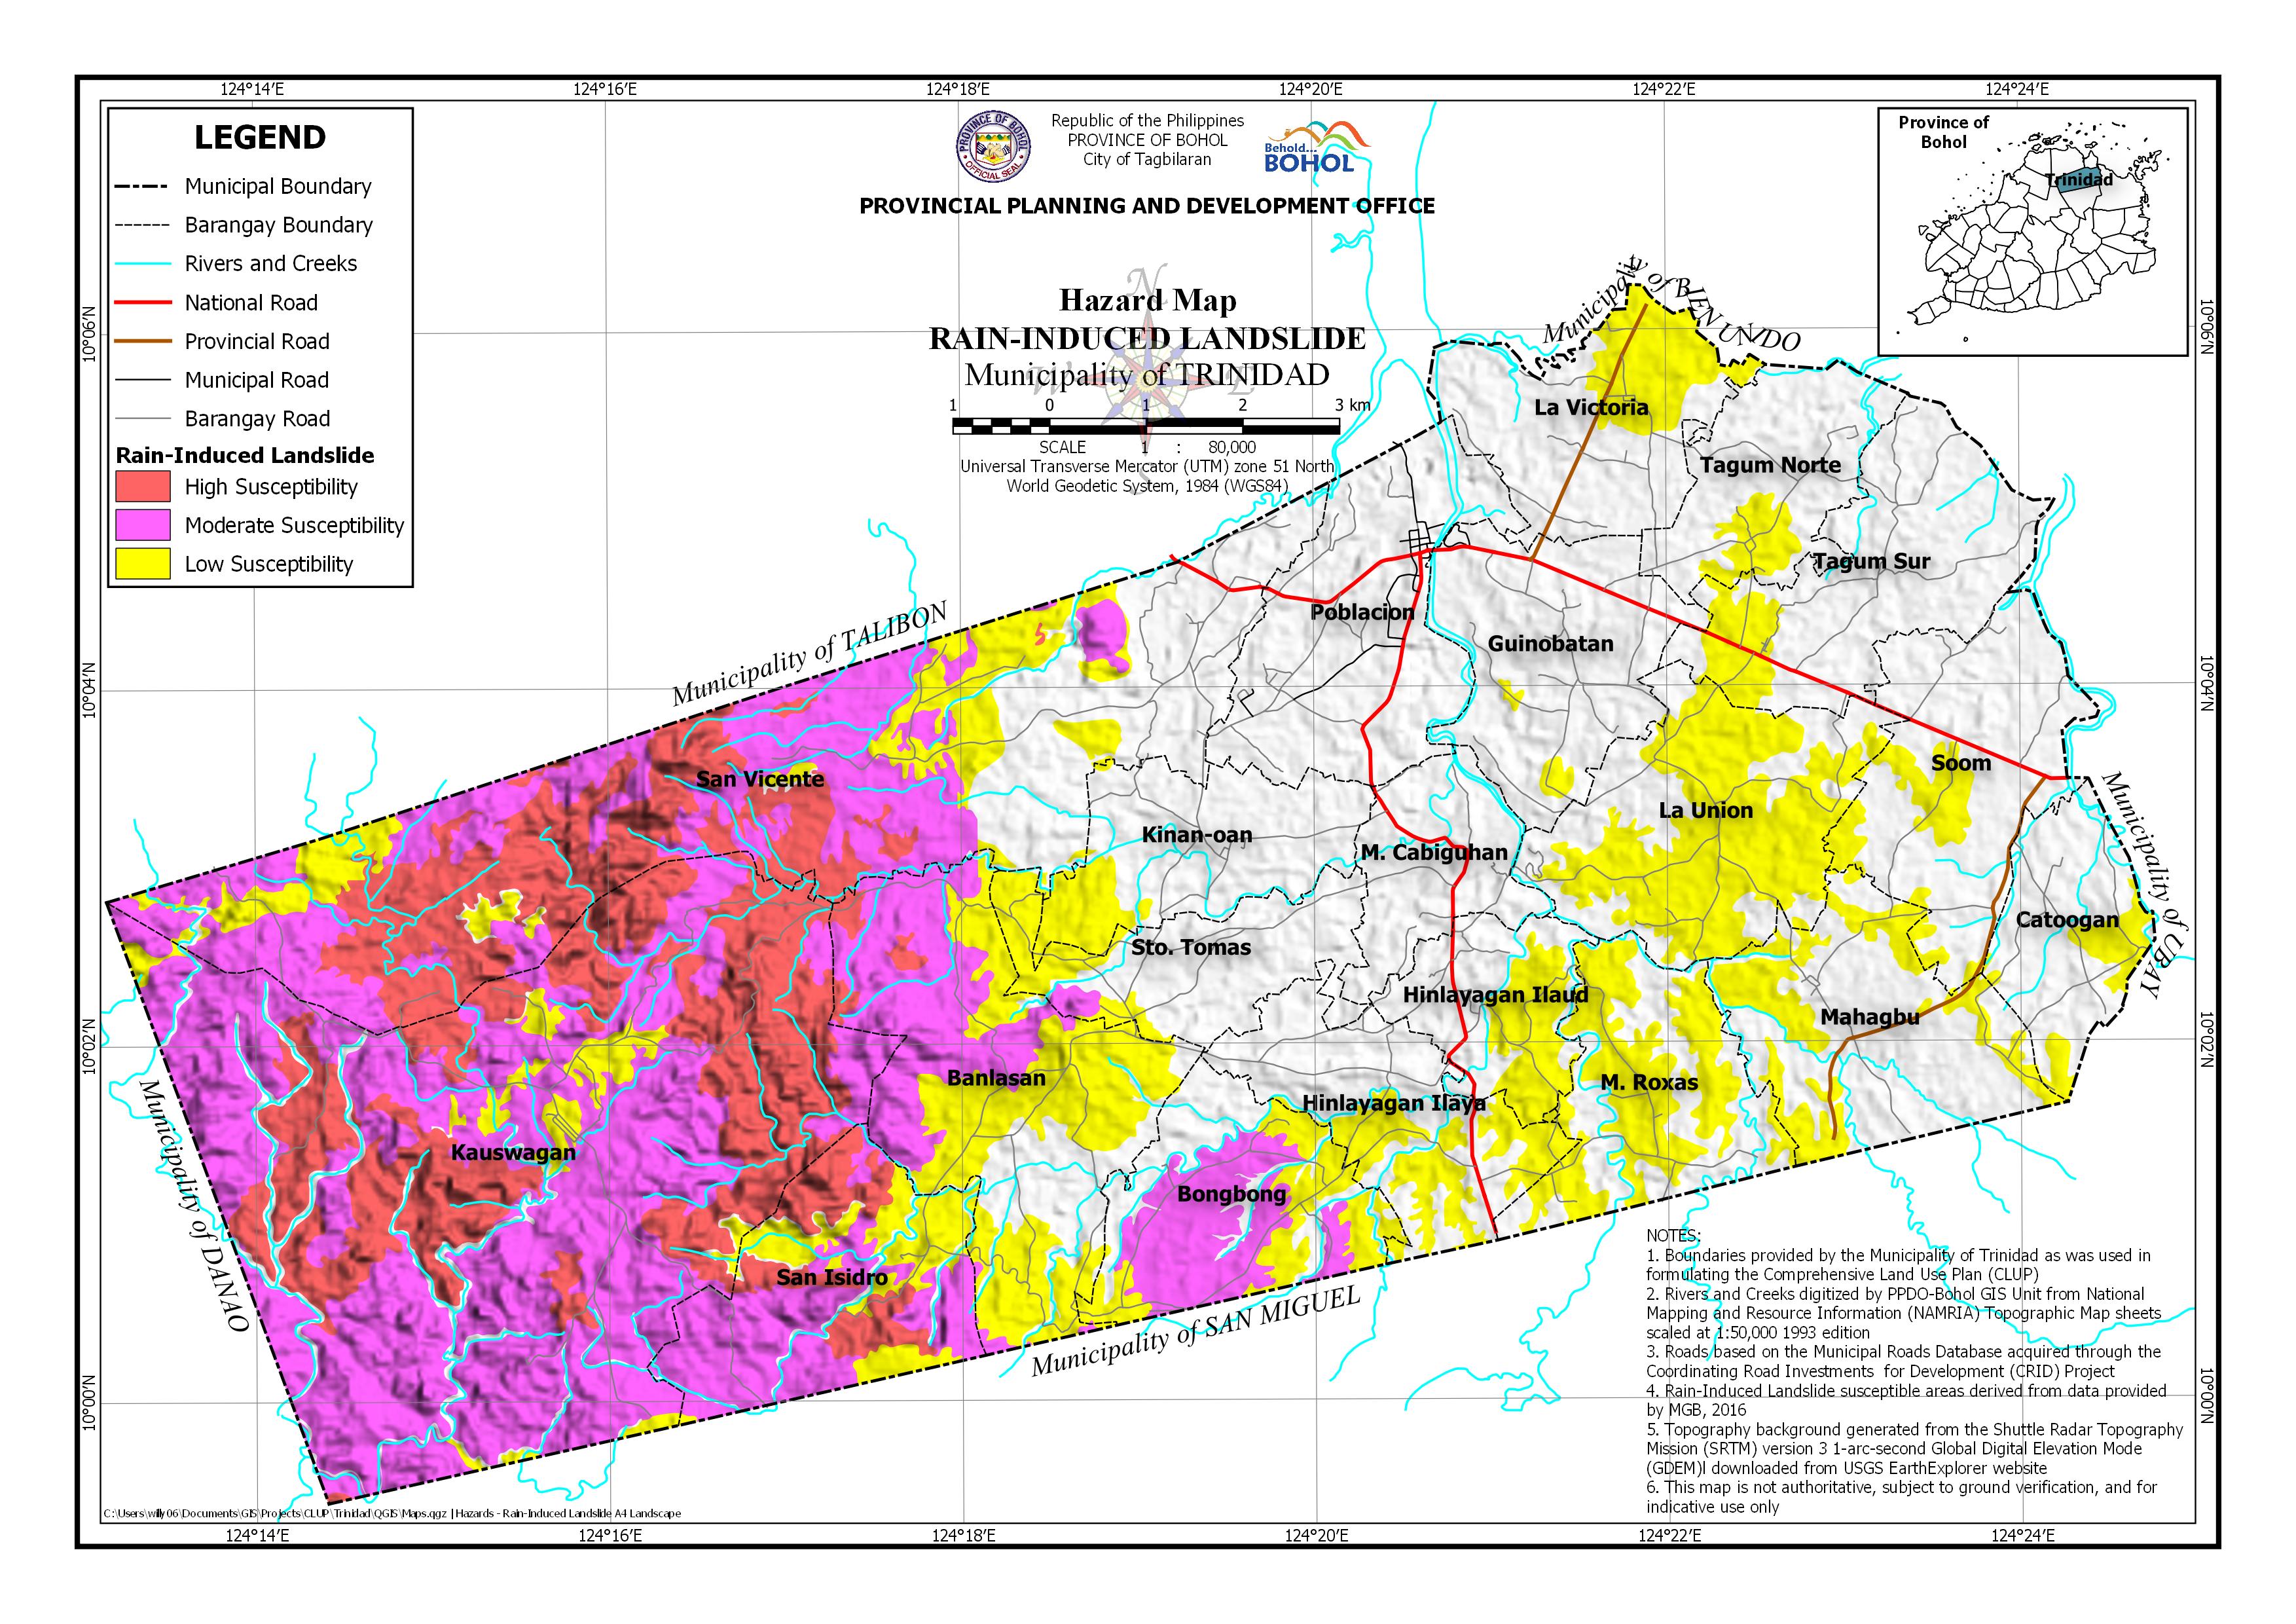
AREA EXPOSED TO RAIN-INDUCED LANDSLIDE HAZARD BY BARANGAY
| Barangay | Area | Barangay Area Exposed to High Susceptibility | Barangay Area Exposed to Moderate Susceptibility | Barangay Area Exposed to Low Susceptibility | |||
| (Hectares) | (Hectares) | (Percentage) | (Hectares) | (Percentage) | (Hectares) | (Percentage) | |
| Banlasan | 988.739 | 31.463 | 3.18% | 334.356 | 33.82% | 431.295 | 43.62% |
| Bongbong | 540.748 | 230.78 | 42.68% | 135.458 | 25.05% | ||
| Catoogan | 335.1 | 55.08 | 16.44% | ||||
| Guinobatan | 563.906 | 14.79 | 2.62% | ||||
| Hinlayagan Ilaud | 306.645 | 110.498 | 36.04% | ||||
| Hinlayagan Ilaya | 486.672 | 143.386 | 29.46% | ||||
| Kauswagan | 3,091.78 | 1,031.62 | 33.37% | 1,757.22 | 56.84% | 133.701 | 4.32% |
| Kinan-oan | 439.893 | 70.671 | 16.07% | ||||
| La Union | 724.351 | 448.328 | 61.89% | ||||
| La Victoria | 516.037 | 143.074 | 27.73% | ||||
| M. Cabiguhan | 306.975 | ||||||
| M. Roxas | 512.497 | 264.788 | 51.67% | ||||
| Mahagbu | 627.355 | 172.582 | 27.51% | ||||
| Poblacion | 671.786 | ||||||
| San Isidro | 620.653 | 140.684 | 22.67% | 290.72 | 46.84% | 148.068 | 23.86% |
| San Vicente | 2,233.06 | 623.512 | 27.92% | 722.058 | 32.34% | 313.919 | 14.06% |
| Soom | 616.046 | 90.25 | 14.65% | ||||
| Sto. Tomas | 401.716 | 13.058 | 3.25% | 84.583 | 21.06% | ||
| Tagum Norte | 392.375 | 52.264 | 13.32% | ||||
| Tagum Sur | 613.829 | 76.629 | 12.48% | ||||
| Total | 14,990.16 | 1,827.28 | 12.19% | 3,348.19 | 22.34% | 2,889.36 | 19.28% |