
Download in PDF and JPG format
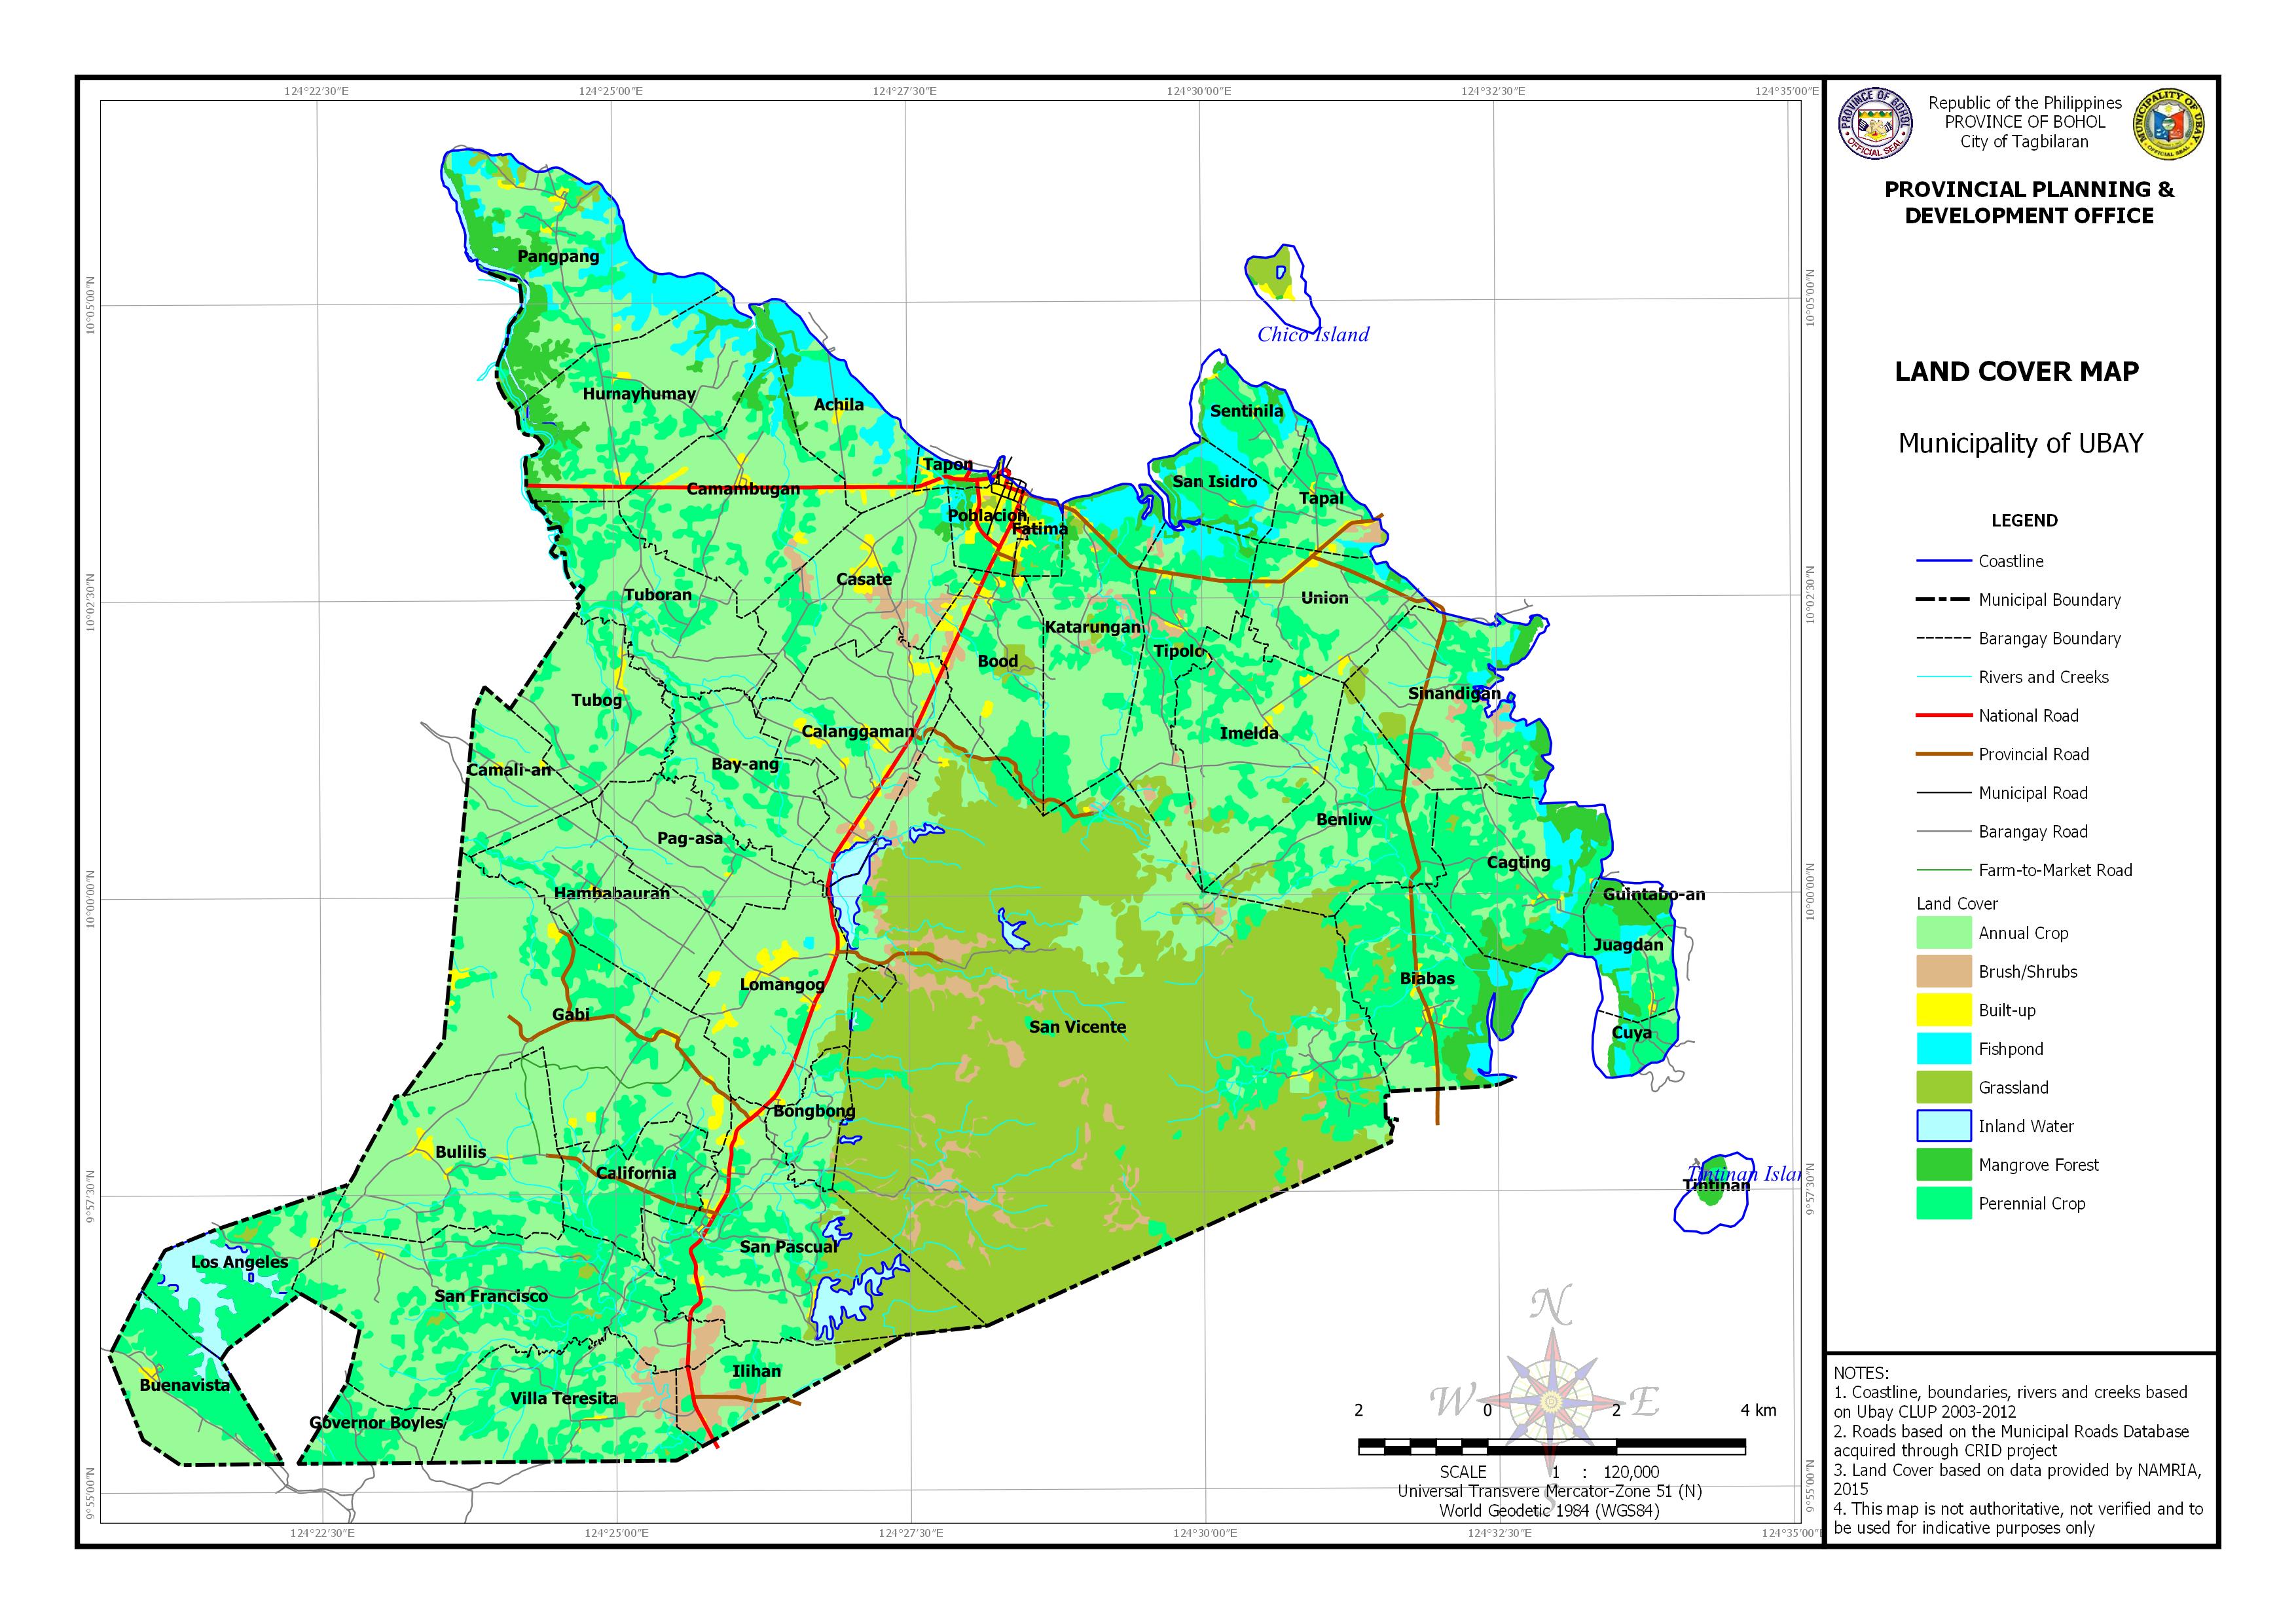
AREA EXPOSED TO LAND COVER BY BARANGAY
| Barangay | Area | Annual Crop | Brush/Shrubs | Built-up | Fishpond | Grassland | Inland Water | Mangrove Forest | Perennial Crop | ||||||||
| (Hectares) | (Hectares) | Percentage | (Hectares) | Percentage | (Hectares) | Percentage | (Hectares) | Percentage | (Hectares) | Percentage | (Hectares) | Percentage | (Hectares) | Percentage | (Hectares) | Percentage | |
| Achila | 368.967 | 168.378 | 45.64% | 0.170 | 12.396 | 137.334 | 37.22% | 2.03212964 | 24.08525706 | 6.53% | 23.310 | 6.32% | |||||
| Bay-ang | 415.145 | 351.225 | 84.60% | 0.798 | 63.123 | 15.21% | |||||||||||
| Benliw | 601.747 | 314.817 | 52.32% | 1.301 | 1.169 | 44.562 | 7.41% | 239.902 | 39.87% | ||||||||
| Biabas | 651.773 | 140.789 | 21.60% | 0.078 | 18.097 | 50.071 | 7.68% | 31.877 | 0.787 | 89.883 | 13.79% | 320.067 | 49.11% | ||||
| Bongbong | 171.884 | 126.736 | 73.73% | 0.871 | 20.528 | 11.94% | 0.070 | 23.679 | 13.78% | ||||||||
| Bood | 416.584 | 247.825 | 59.49% | 9.734 | 28.010 | 6.72% | 26.617 | 6.39% | 104.396 | 25.06% | |||||||
| Buenavista | 387.243 | 184.904 | 47.75% | 5.030 | 24.532 | 6.34% | 172.779 | 44.62% | |||||||||
| Bulilis | 748.311 | 667.581 | 89.21% | 10.547 | 70.183 | 9.38% | |||||||||||
| Cagting | 599.799 | 152.512 | 25.43% | 0.616 | 4.627 | 78.024 | 13.01% | 10.930 | 93.869 | 15.65% | 252.970 | 42.18% | |||||
| Calanggaman | 626.032 | 529.684 | 84.61% | 20.145 | 33.425 | 5.34% | 23.582 | 19.196 | |||||||||
| California | 326.555 | 147.244 | 45.09% | 0.721 | 178.590 | 54.69% | |||||||||||
| Camali-an | 276.417 | 260.367 | 94.19% | 1.698 | 14.352 | 5.19% | |||||||||||
| Camambugan | 719.742 | 550.169 | 76.44% | 7.062 | 20.415 | 22.134 | 0.109 | 17.895 | 101.957 | 14.17% | |||||||
| Casate | 583.765 | 453.540 | 77.69% | 40.003 | 6.85% | 15.291 | 5.082 | 3.737 | 66.113 | 11.33% | |||||||
| Cuya | 104.240 | 5.427 | 5.21% | 17.686 | 16.97% | 5.906 | 5.67% | 47.592 | 45.66% | ||||||||
| Fatima | 79.998 | 4.945 | 6.18% | 5.351 | 6.69% | 19.921 | 24.90% | 10.634 | 13.29% | 5.176 | 6.47% | 1.392 | 32.578 | 40.72% | |||
| Gabi | 1157.012 | 976.138 | 84.37% | 26.399 | 154.478 | 13.35% | |||||||||||
| Governor Boyles | 187.582 | 96.685 | 51.54% | 90.895 | 48.46% | ||||||||||||
| Guintabo-an | 34.340 | 0.791 | 2.251 | 6.55% | 14.554 | 42.38% | 5.769 | 16.80% | |||||||||
| Hambabauran | 529.788 | 465.530 | 87.87% | 2.582 | 61.675 | 11.64% | |||||||||||
| Humayhumay | 739.160 | 470.463 | 63.65% | 13.733 | 68.912 | 9.32% | 1.483 | 6.175 | 68.095 | 9.21% | 110.300 | 14.92% | |||||
| Ilihan | 276.900 | 141.735 | 51.19% | 69.920 | 25.25% | 2.467 | 0.00% | 21.297 | 7.69% | 41.472 | 14.98% | ||||||
| Imelda | 665.930 | 499.353 | 74.99% | 3.934 | 7.602 | 12.401 | 142.635 | 21.42% | |||||||||
| Juagdan | 229.230 | 33.038 | 14.41% | 4.693 | 45.994 | 20.06% | 38.603 | 16.84% | 85.891 | 37.47% | |||||||
| Katarungan | 662.961 | 354.124 | 53.42% | 26.750 | 6.753 | 54.288 | 8.19% | 19.429 | 23.306 | 178.245 | 26.89% | ||||||
| Lomangog | 619.483 | 516.633 | 83.40% | 1.856 | 37.167 | 6.00% | 2.332 | 37.933 | 6.12% | 0.313 | 23.248 | ||||||
| Los Angeles | 402.969 | 80.171 | 19.90% | 1.294 | 7.666 | 142.573 | 35.38% | 171.265 | 42.50% | ||||||||
| Pag-asa | 384.338 | 367.023 | 95.50% | 0.630 | 16.685 | ||||||||||||
| Pangpang | 802.227 | 312.661 | 38.97% | 0.003 | 11.715 | 189.073 | 23.57% | 20.548 | 37.463 | 145.626 | 18.15% | 85.137 | 10.61% | ||||
| Poblacion | 146.363 | 23.717 | 16.21% | 2.652 | 64.935 | 44.37% | 9.449 | 6.46% | 2.673 | 10.234 | 6.99% | 32.703 | 22.34% | ||||
| San Francisco | 1124.516 | 677.385 | 60.24% | 26.042 | 1.245 | 20.390 | 399.454 | 35.52% | |||||||||
| San Isidro | 196.710 | 12.578 | 6.39% | 2.592 | 89.921 | 45.71% | 20.783 | 10.57% | 66.994 | 34.06% | |||||||
| San Pascual | 995.168 | 442.104 | 44.43% | 4.791 | 31.121 | 259.726 | 26.10% | 68.525 | 6.89% | 188.898 | 18.98% | ||||||
| San Vicente | 5232.845 | 586.346 | 11.21% | 325.610 | 6.22% | 9.905 | 3961.643 | 75.71% | 63.088 | 286.193 | 5.47% | ||||||
| Sentinila | 223.647 | 40.584 | 18.15% | 5.895 | 59.876 | 26.77% | 9.222 | 86.024 | 38.46% | ||||||||
| Sinandigan | 618.453 | 341.897 | 55.28% | 30.633 | 0.023 | 40.251 | 6.51% | 27.331 | 35.566 | 5.75% | 137.163 | 22.18% | |||||
| Tapal | 204.493 | 94.740 | 46.33% | 11.457 | 5.60% | 8.379 | 11.319 | 5.54% | 0.983 | 0.216 | 77.398 | 37.85% | |||||
| Tapon | 48.963 | 4.827 | 9.86% | 1.011 | 21.473 | 43.86% | 5.382 | 10.99% | 0.176 | 4.395 | 8.98% | 11.694 | 23.88% | ||||
| Tintinan | 101.455 | 0.367 | 15.414 | 15.19% | 7.109 | 7.01% | |||||||||||
| Tipolo | 530.348 | 249.207 | 46.99% | 21.946 | 8.510 | 39.814 | 7.51% | 22.584 | 4.509 | 183.779 | 34.65% | ||||||
| Tubog | 451.619 | 390.092 | 86.38% | 5.823 | 55.706 | 12.34% | |||||||||||
| Tuboran | 559.370 | 418.450 | 74.81% | 0.936 | 13.629 | 126.355 | 22.59% | ||||||||||
| Union | 402.419 | 301.780 | 74.99% | 12.917 | 6.643 | 1.243 | 1.955 | 77.701 | 19.31% | ||||||||
| Villa Teresita | 611.564 | 361.600 | 59.13% | 44.515 | 3.417 | 1.163 | 200.857 | 32.84% | |||||||||
| Total | 24849.088 | 12397.418 | 2173.11% | 656.280 | 50.62% | 451.387 | 131.19% | 810.072 | 265.35% | 4558.360 | 147.83% | 367.216 | 48.60% | 618.786 | 175.70% | 4813.198 | 1037.46% |