
Download in PDF and JPG format
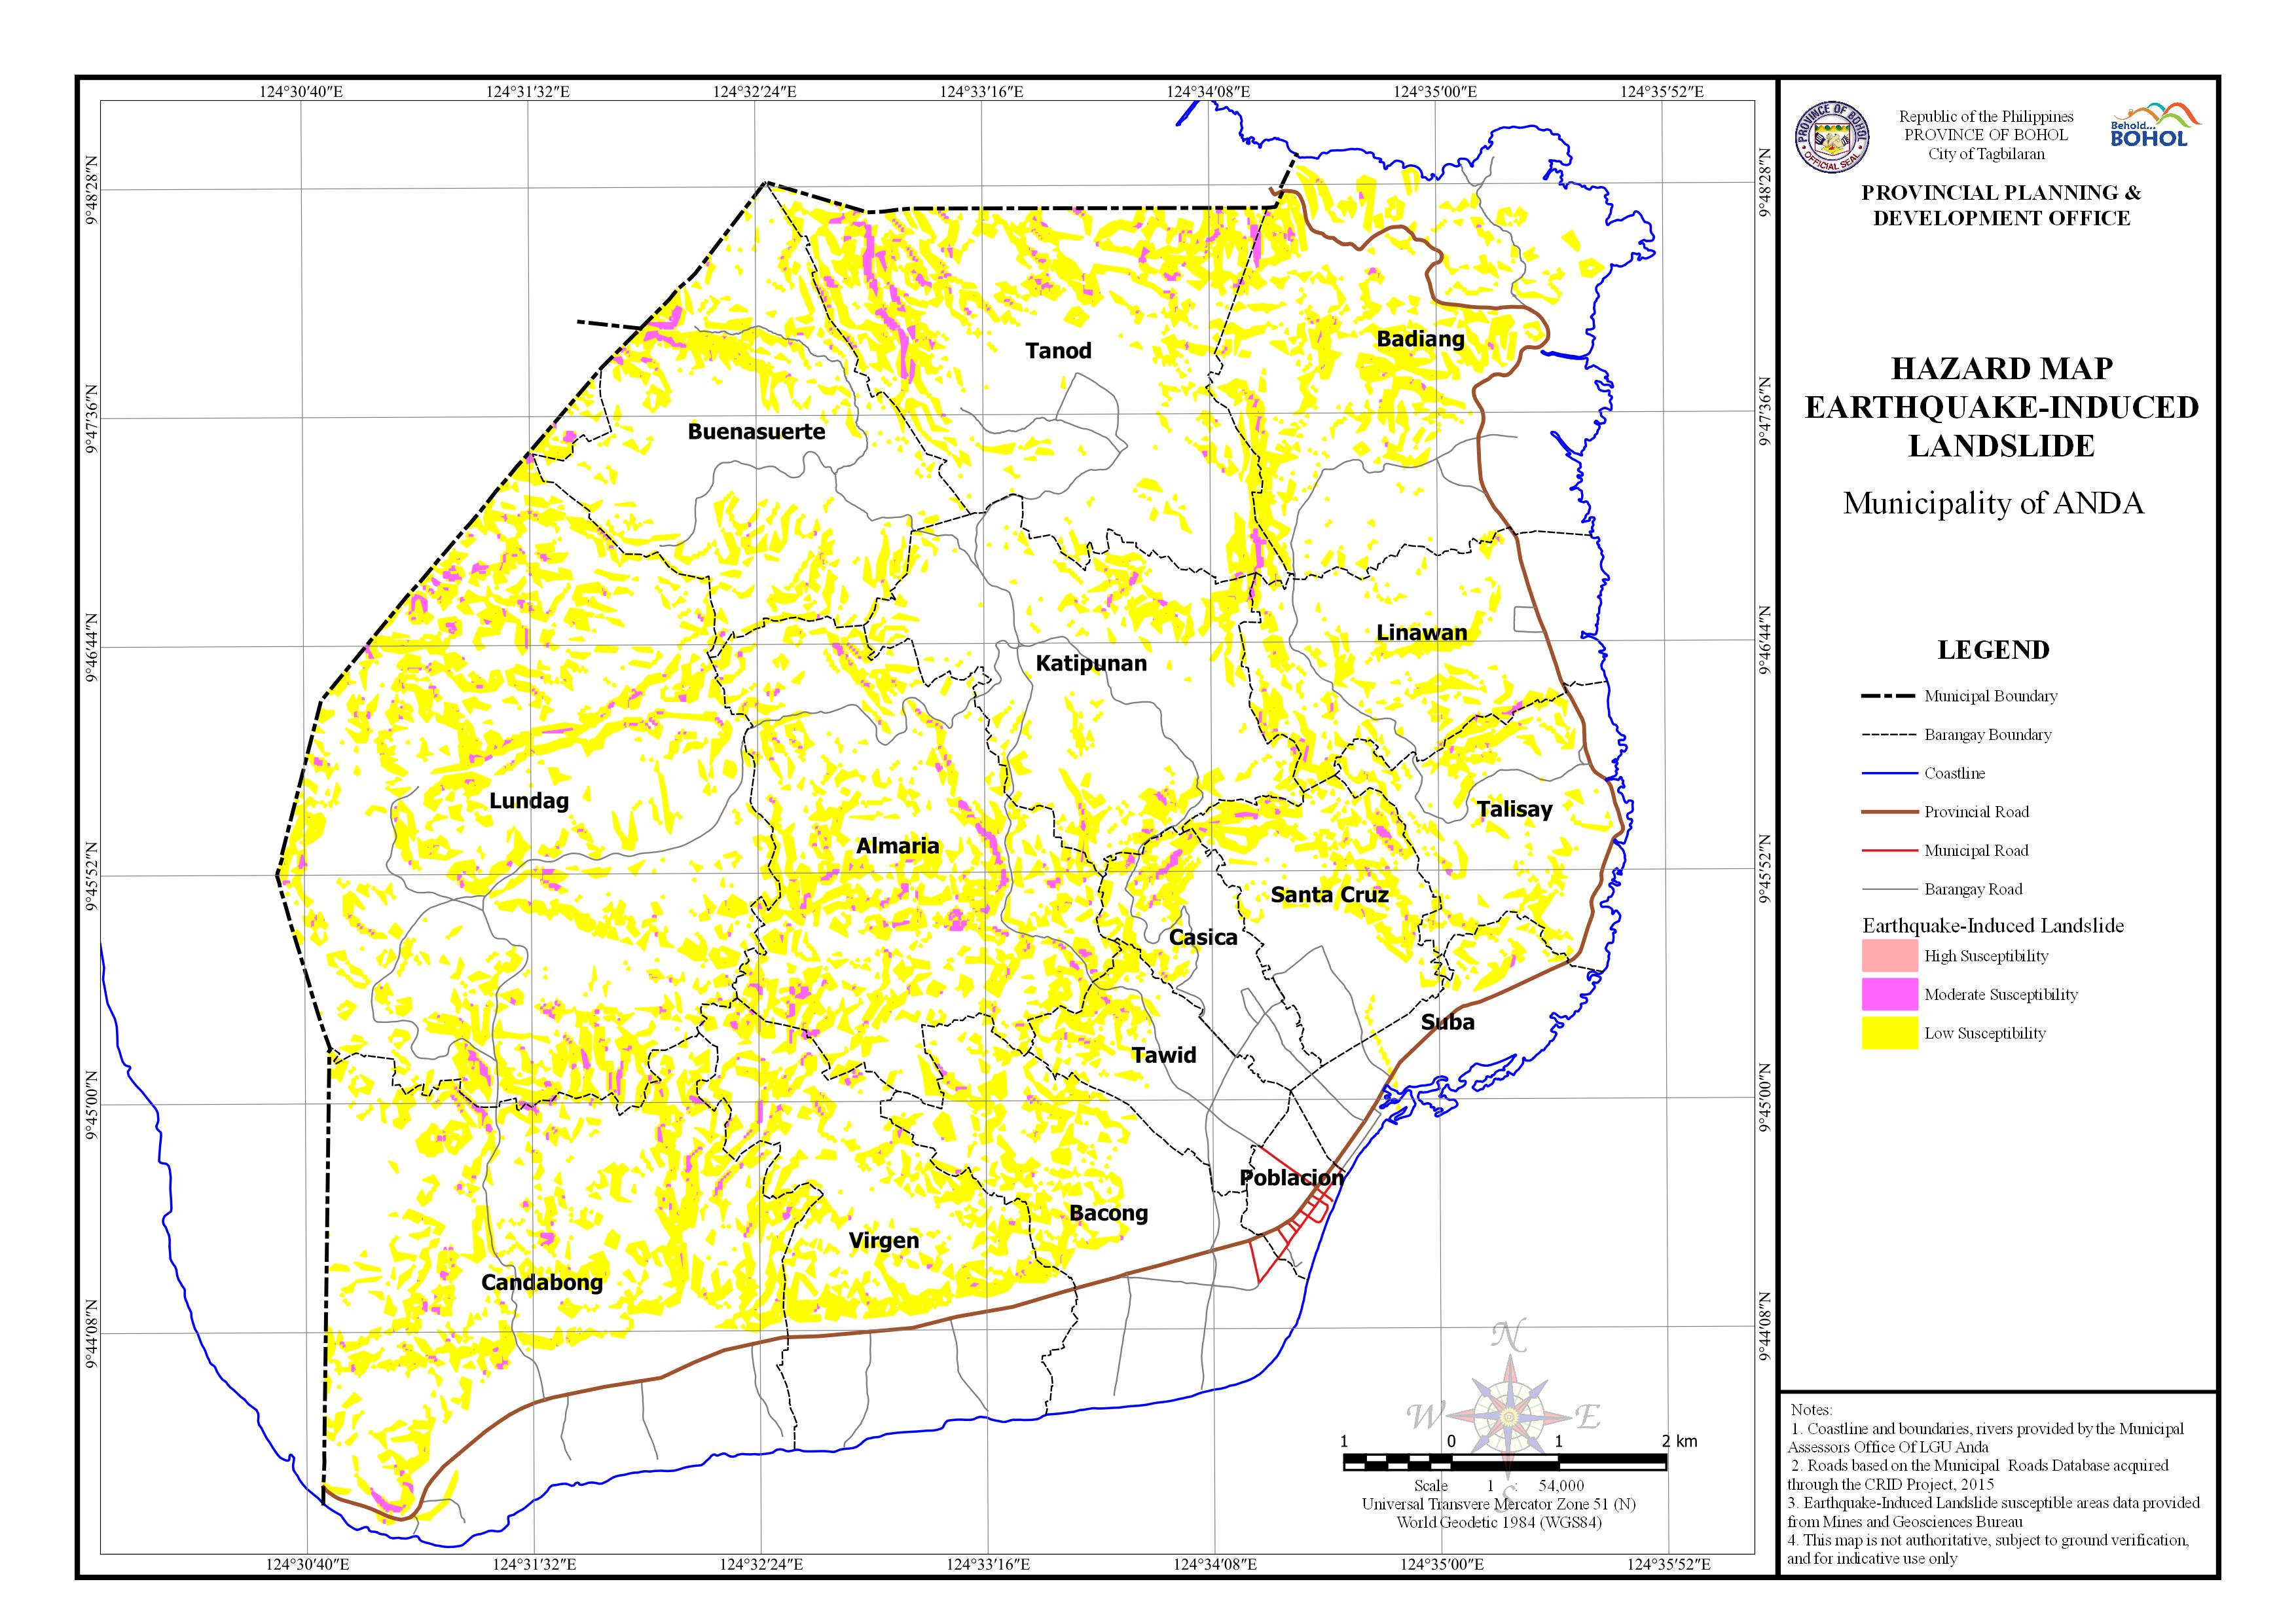
AREA EXPOSED TO EARTHQUAKE-INDUCED LANDSLIDE BY BARANGAY
| Barangay | Area | Area Exposed to High Susceptibility | Area Exposed to Moderate Susceptibility | Area Exposed to Low Susceptibility | Area Not Exposed | ||||
| (Hectares} | (Hectares} | Percentage | (Hectares} | Percentage | (Hectares} | Percentage | (Hectares} | Percentage | |
| Almaria | 586.18 | 17.726 | 3.02% | 140.352 | 23.94% | 428.102 | 73.03% | ||
| Bacong | 384.549 | 1.869 | 0.49% | 43.109 | 11.21% | 339.572 | 88.30% | ||
| Badiang | 681.255 | 5.485 | 0.81% | 96.789 | 14.21% | 578.98 | 84.99% | ||
| Buenasuerte | 483.765 | 5.614 | 1.16% | 65.441 | 13.53% | 412.71 | 85.31% | ||
| Candabong | 913.208 | 13.877 | 1.52% | 146.251 | 16.02% | 753.081 | 82.47% | ||
| Casica | 127.206 | 2.434 | 1.91% | 17.662 | 13.88% | 107.11 | 84.20% | ||
| Katipunan | 437.769 | 3.76 | 0.86% | 47.162 | 10.77% | 386.846 | 88.37% | ||
| Linawan | 308.36 | 3.088 | 1.00% | 38.702 | 12.55% | 266.545 | 86.44% | ||
| Lundag | 1,114.26 | 25.453 | 2.28% | 232.728 | 20.89% | 855.085 | 76.74% | ||
| Poblacion | 51.421 | 51.421 | 100.00% | ||||||
| Santa Cruz | 211.921 | 3.46 | 1.63% | 36.414 | 17.18% | 172.047 | 81.18% | ||
| Suba | 150.647 | 0.222 | 0.15% | 6.646 | 4.41% | 143.779 | 95.44% | ||
| Talisay | 242.032 | 1.351 | 0.56% | 28.81 | 11.90% | 211.87 | 87.54% | ||
| Tanod | 611.43 | 0.04 | 0.01% | 20.569 | 3.36% | 117.36 | 19.19% | 473.464 | 77.44% |
| Tawid | 142.246 | 1.383 | 0.97% | 17.868 | 12.56% | 122.996 | 86.47% | ||
| Virgen | 438.871 | 5.562 | 1.27% | 72.73 | 16.57% | 360.557 | 82.16% | ||
| Total | 6,885.12 | 0.04 | 0.00% | 111.853 | 1.63% | 1,108.02 | 16.09% | 5,664.17 | 82.27% |