
Download in PDF and JPG format
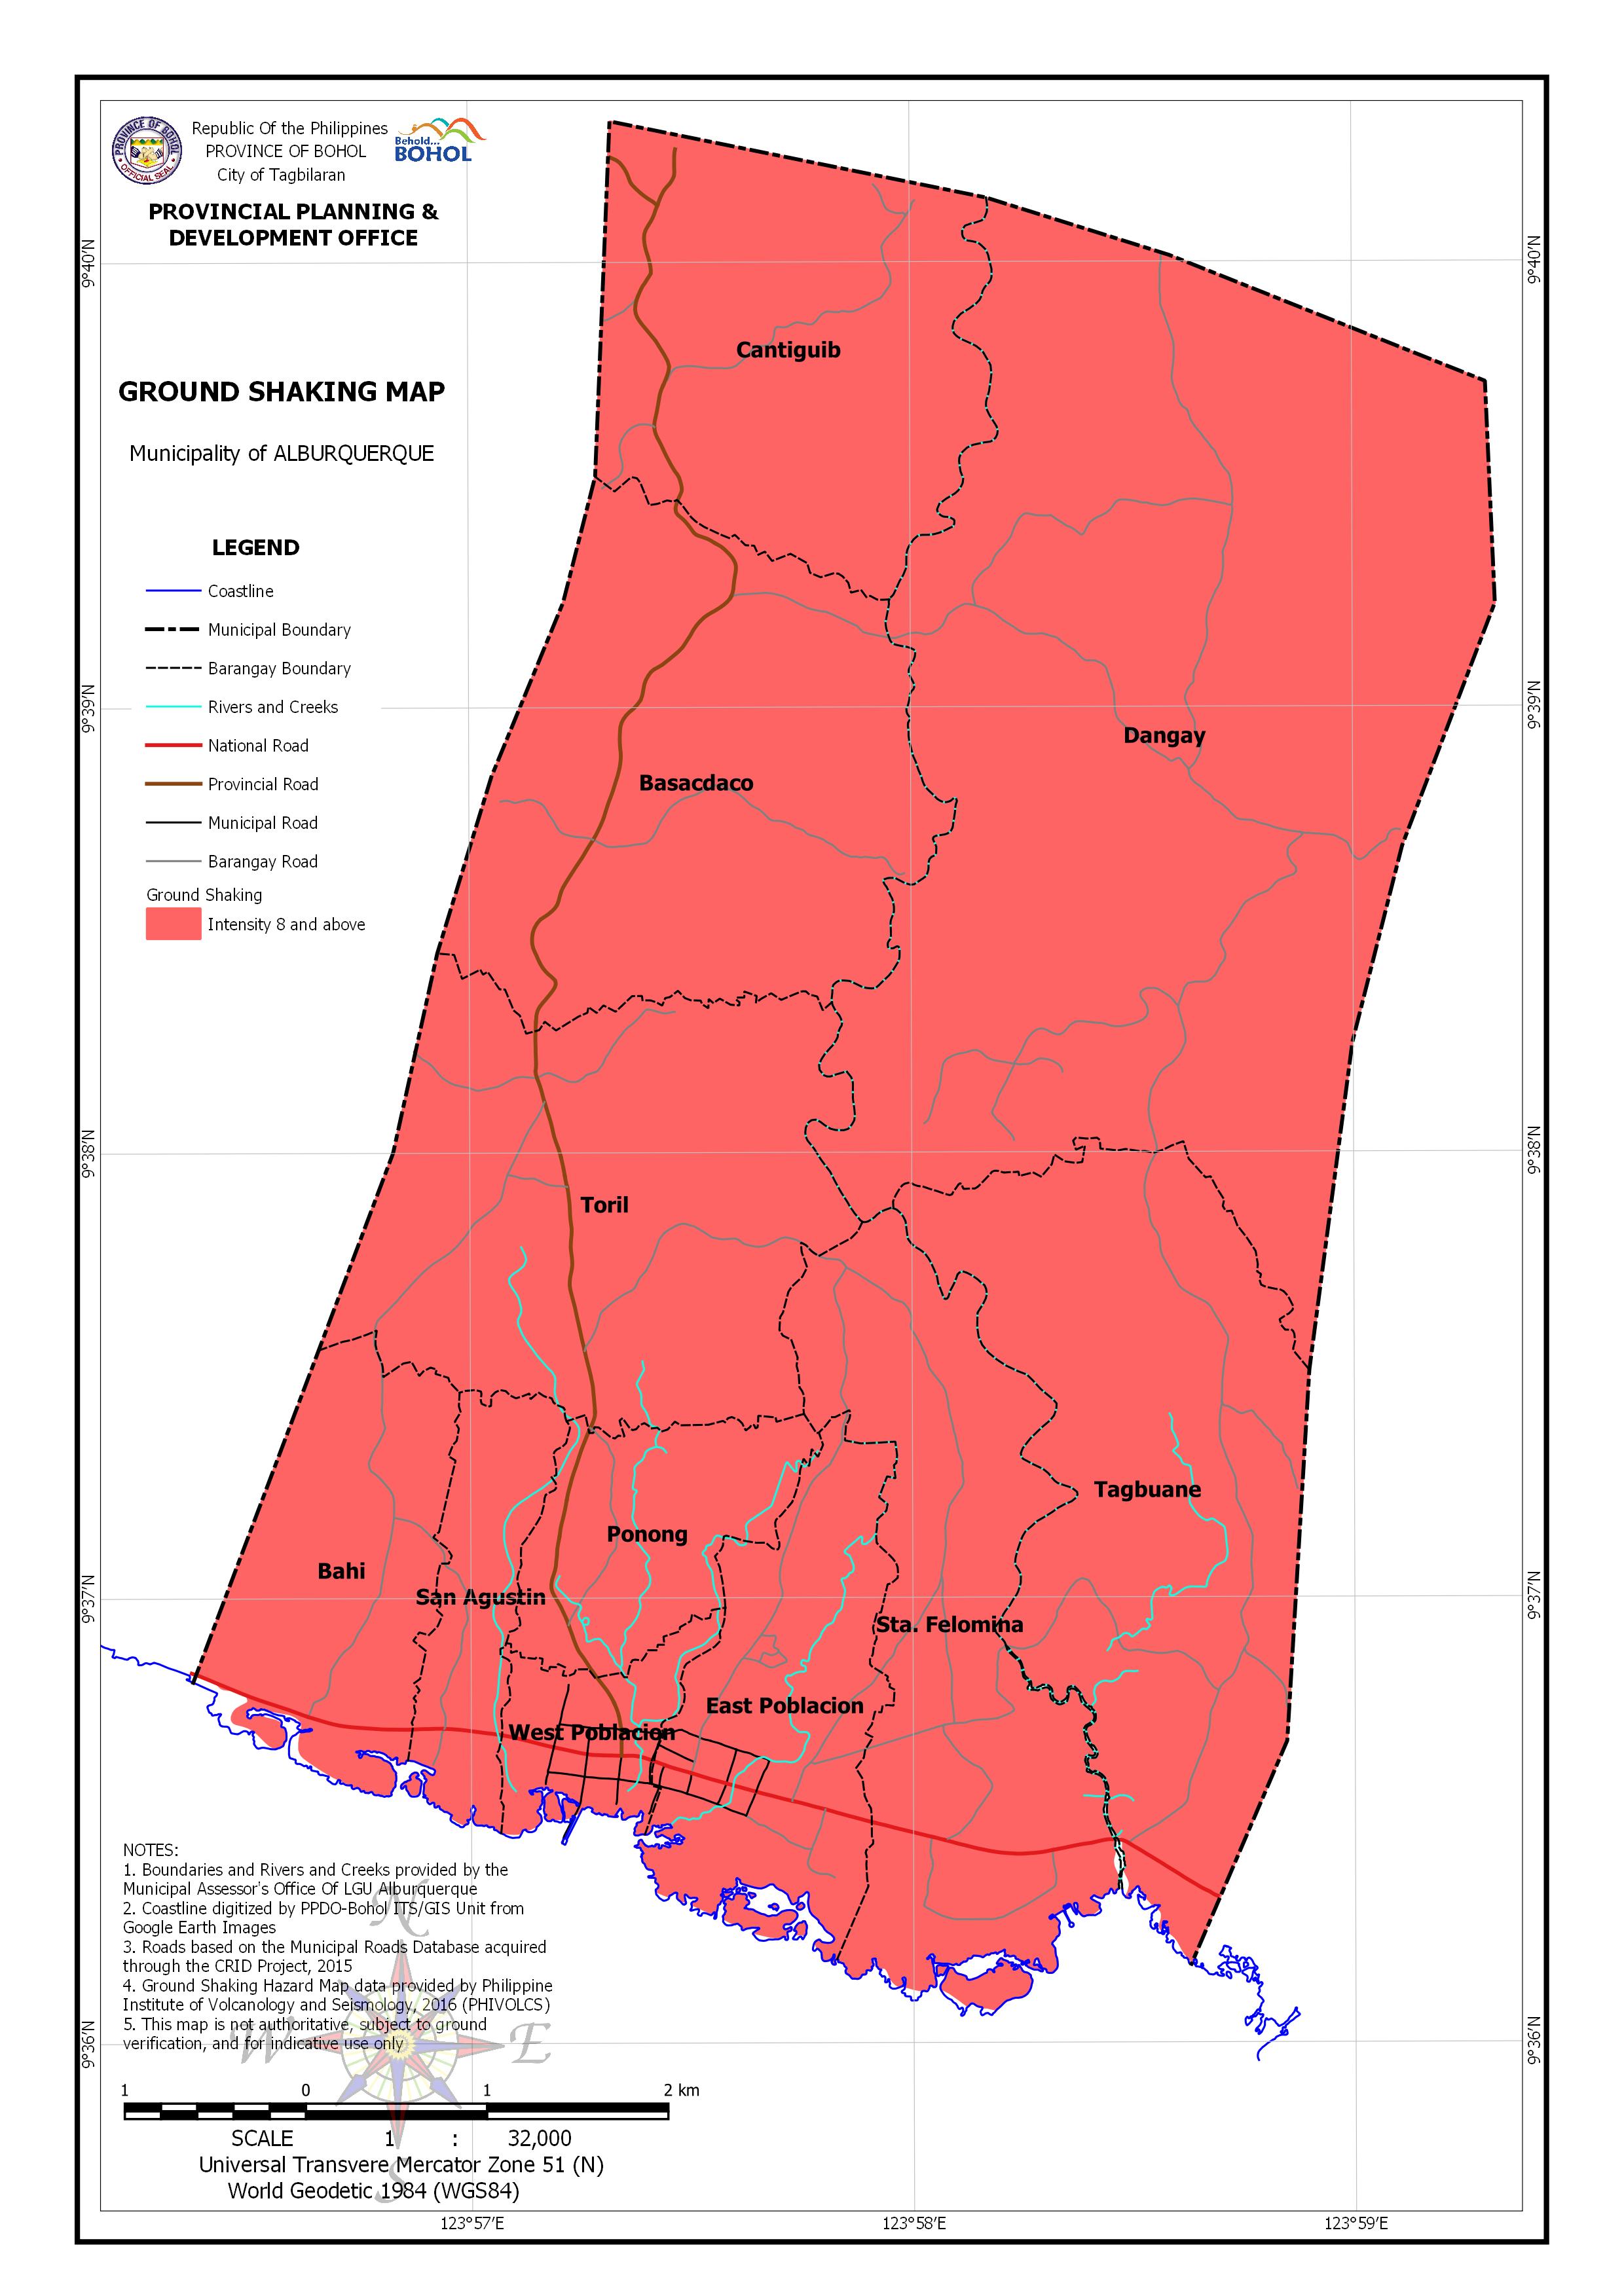
AREA EXPOSED TO GROUND SHAKING BY BARANGAY
| Barangay | Area | Area Exposed to Intensity 8 and above | |
| (Hectares) | (Hectares) | (Percentage) | |
| Bahi | 131.978 | 131.978 | 100.00% |
| Basacdaco | 320.521 | 320.521 | 100.00% |
| Cantiguib | 244.97 | 244.97 | 100.00% |
| Dangay | 815.135 | 815.135 | 100.00% |
| East Poblacion | 141.696 | 141.696 | 100.00% |
| Ponong | 89.032 | 89.032 | 100.00% |
| San Agustin | 65.521 | 65.521 | 100.00% |
| Sta. Felomina | 242.704 | 242.704 | 100.00% |
| Tagbuane | 319.398 | 319.398 | 100.00% |
| Toril | 308.17 | 308.17 | 100.00% |
| West Poblacion | 47.003 | 47.003 | 100.00% |
| Total | 2,726.13 | 2,726.13 | 100.00% |