
Download in PDF and JPG format
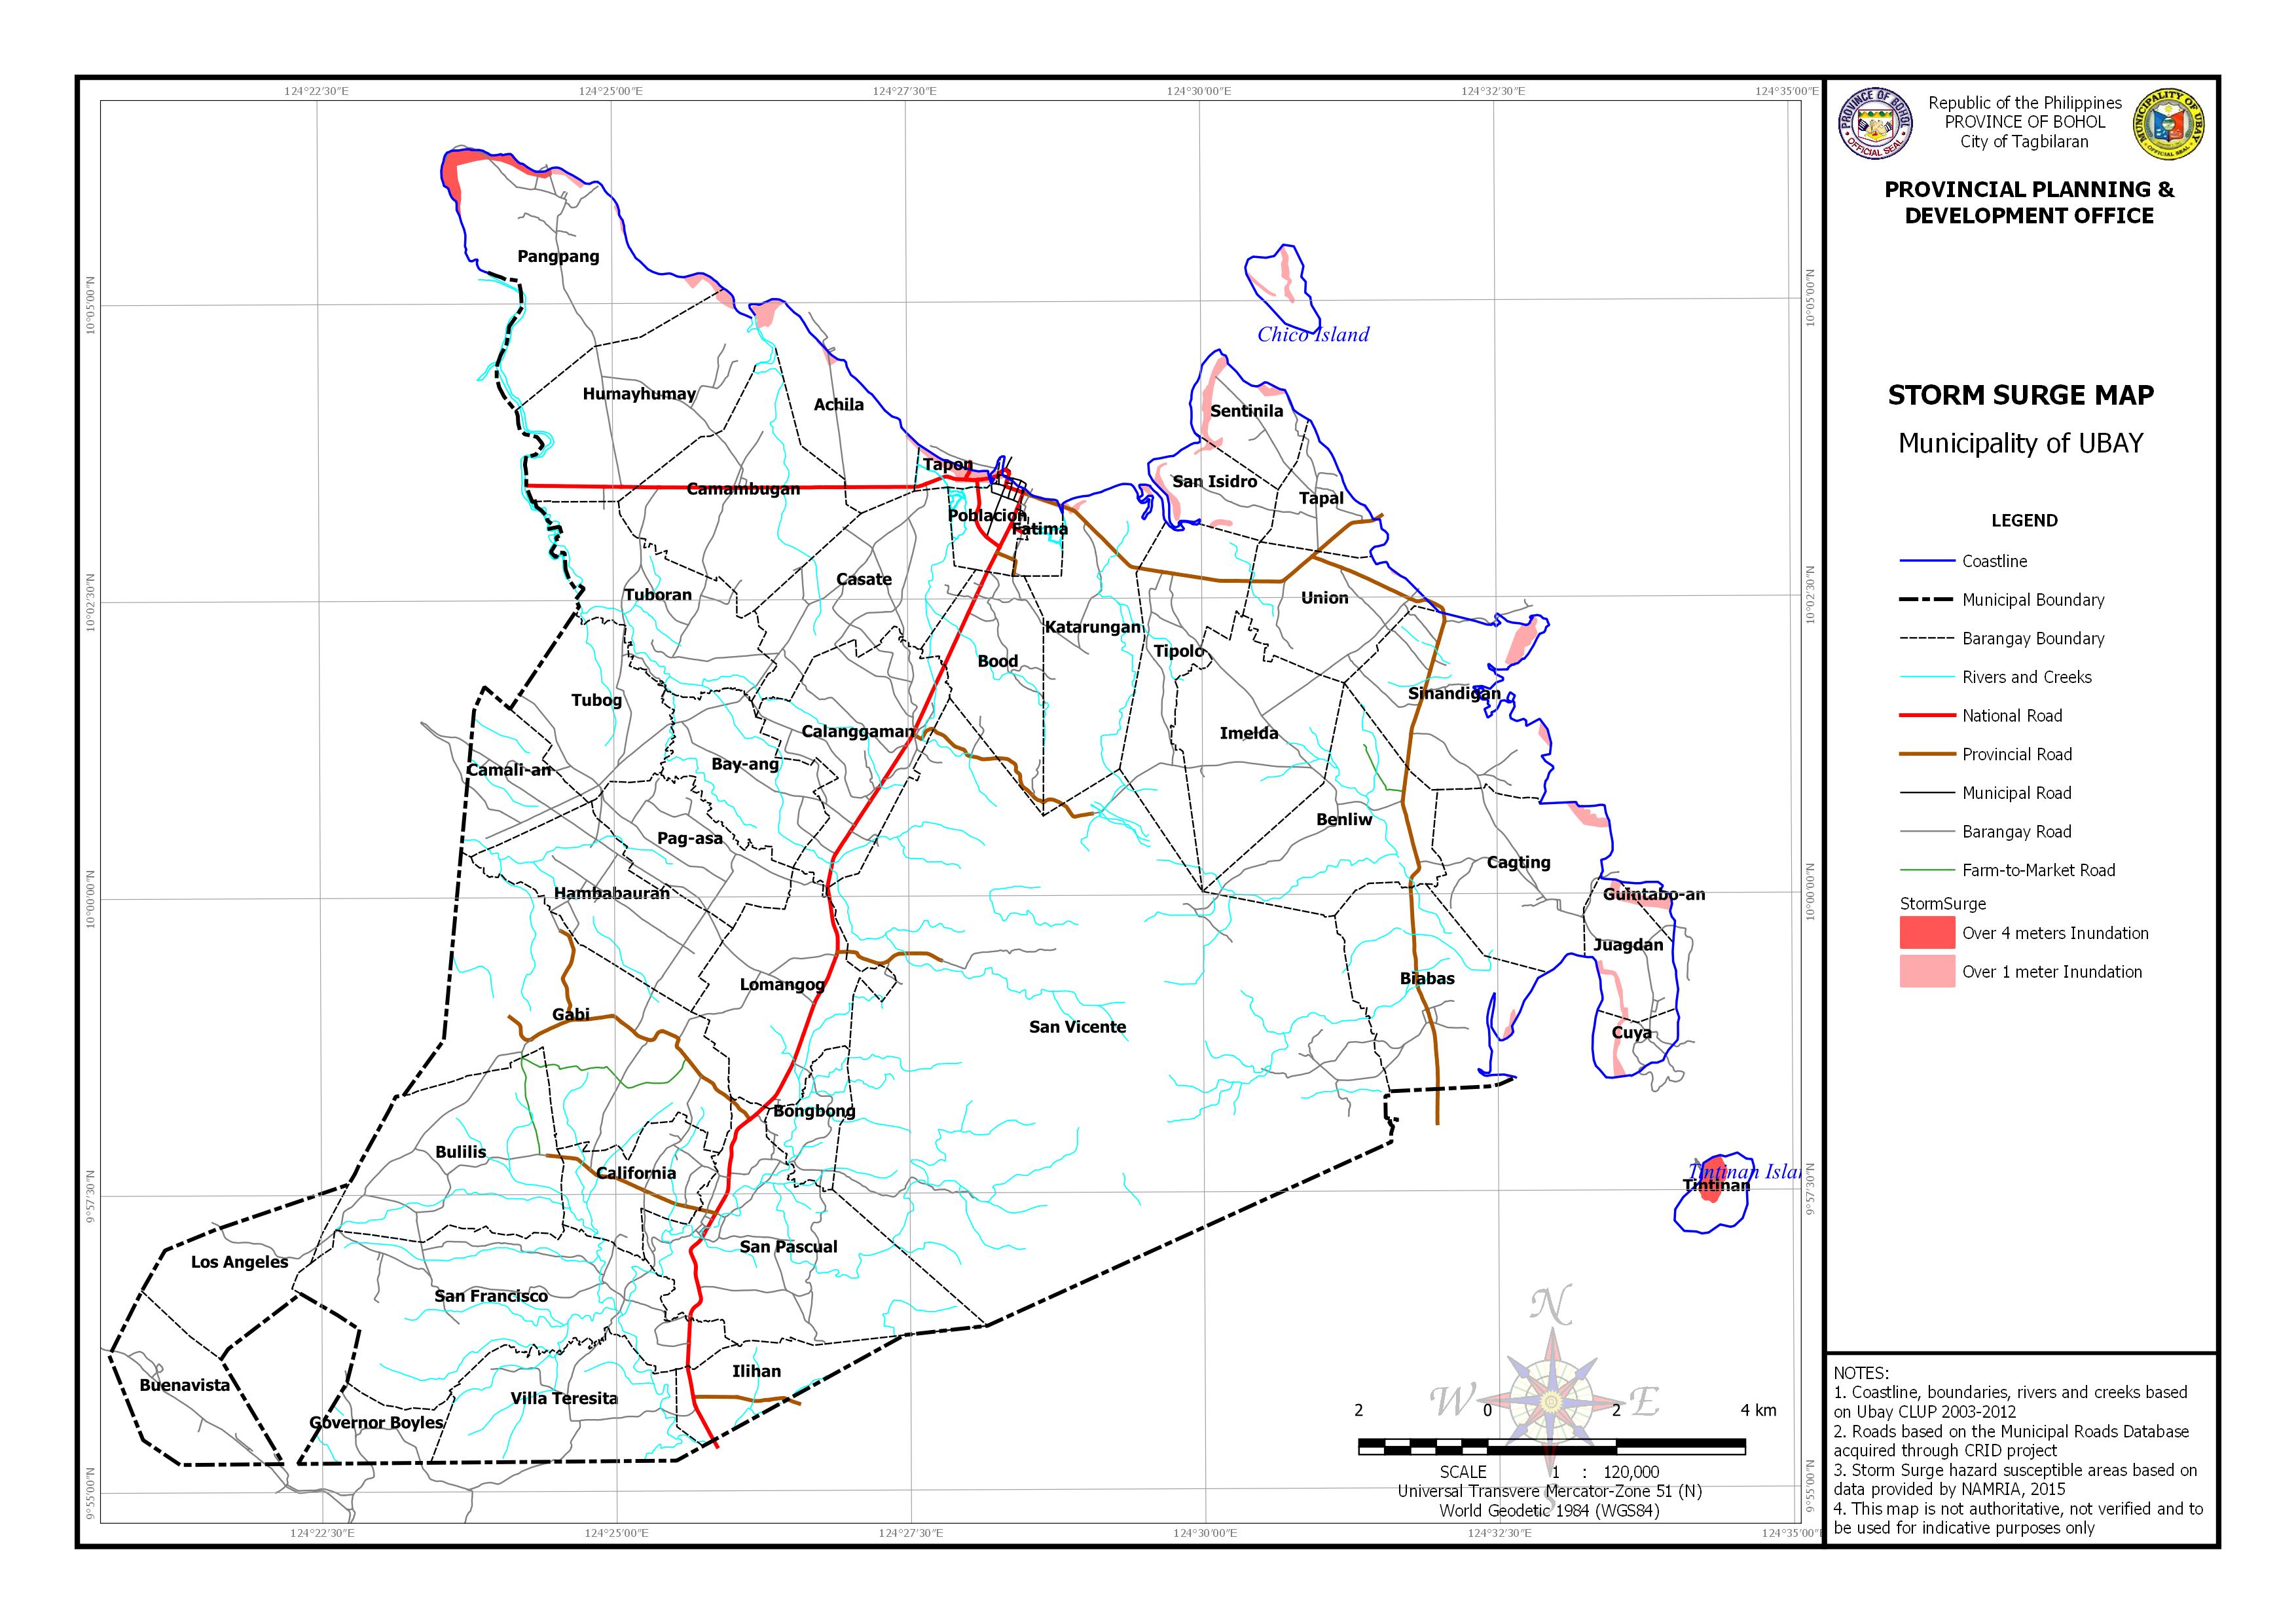
AREA EXPOSED TO STROM SURGE BY BARANGAY
| Barangay | Area | 1 meter Surge | 4 meters Surge | ||
| (Hectares) | (Hectares) | Percentage | (Hectares) | Percentage | |
| Achila | 368.967 | 14.94 | 4.05% | ||
| Biabas | 651.773 | 3.301 | 0.51% | ||
| Cagting | 599.799 | 9.597 | 1.60% | ||
| Cuya | 104.24 | 5.68 | 5.45% | ||
| Fatima | 79.998 | 1.952 | 2.44% | ||
| Guintabo-an | 34.34 | 8.097 | 23.58% | ||
| Humayhumay | 739.16 | 5.058 | 0.68% | ||
| Juagdan | 229.23 | 11.721 | 5.11% | ||
| Katarungan | 662.961 | 3.332 | 0.50% | ||
| Pangpang | 802.227 | 11.834 | 1.48% | 33.114 | 4.13% |
| Poblacion | 146.363 | 1.21 | 0.83% | ||
| San Isidro | 196.71 | 9.491 | 4.83% | ||
| Sentinila | 223.647 | 17.594 | 7.87% | ||
| Sinandigan | 618.453 | 18.36 | 2.97% | ||
| Tapal | 204.493 | 0.174 | 0.09% | ||
| Tapon | 48.963 | 16.664 | 34.03% | ||
| Tintinan | 101.455 | 20.806 | 20.51% | ||
| Tipolo | 530.348 | 0.02 | 0.00% | ||
| Union | 402.419 | 0.348 | 0.09% | ||
| Total | 25218.055 | 139.372 | 96.09% | 53.919 | 24.63% |