
Download in PDF and JPG format
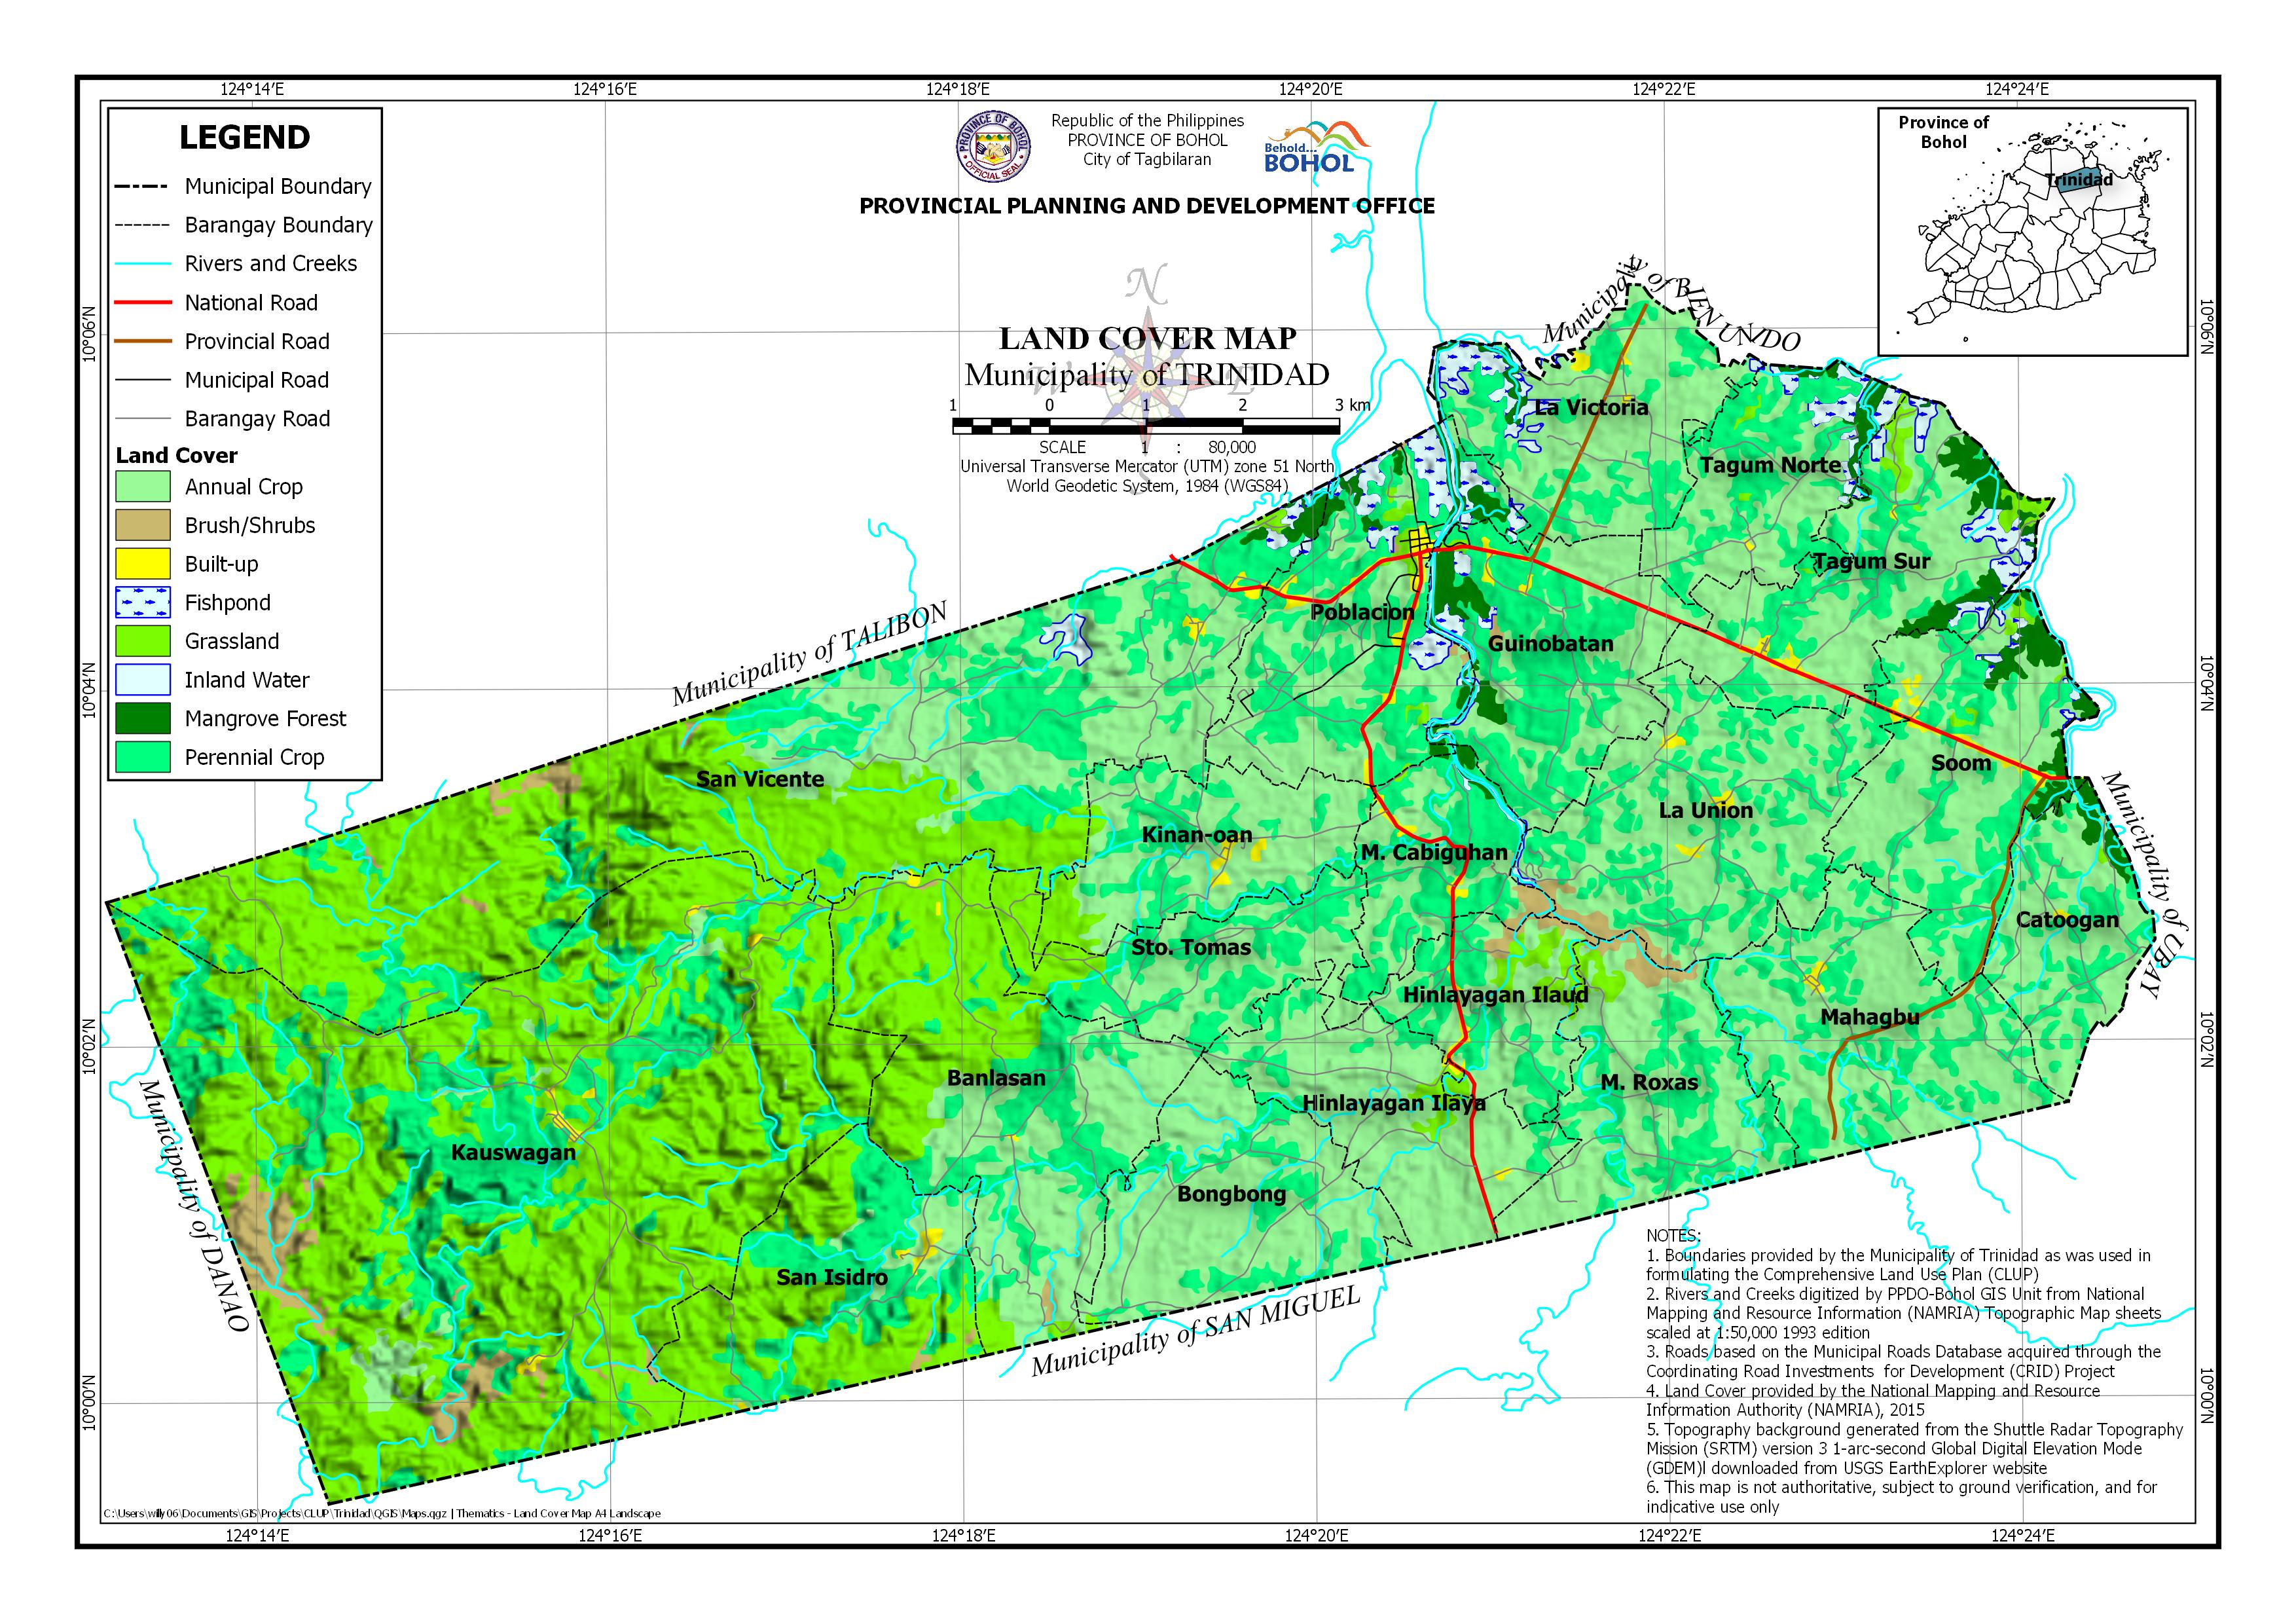
AREA PER LAND COVER BY BARANGAY
| Barangay | Area | Annual Crop | Brush/Shrubs | Built-up | Fishpond | Grassland | Inland Water | Mangrove Forest | Perennial Crop | ||||||||
| (Hectares) | (Hectares) | (Percentage) | (Hectares) | (Percentage) | (Hectares) | (Percentage) | (Hectares) | (Percentage) | (Hectares) | (Percentage) | (Hectares) | (Percentage) | (Hectares) | (Percentage) | (Hectares) | (Percentage) | |
| Banlasan | 988.739 | 363.458 | 36.76% | 5.474 | 0.55% | 3.254 | 0.33% | 403.806 | 40.84% | 212.747 | 21.52% | ||||||
| Bongbong | 540.748 | 442.024 | 81.74% | 0.002 | 0.00% | 1.058 | 0.20% | 97.665 | 18.06% | ||||||||
| Catoogan | 335.1 | 226.431 | 67.57% | 1.443 | 0.43% | 1.329 | 0.40% | 19.111 | 5.70% | 86.785 | 25.90% | ||||||
| Guinobatan | 563.906 | 218.903 | 38.82% | 3.287 | 0.58% | 9.372 | 1.66% | 15.094 | 2.68% | 3.267 | 0.58% | 11.039 | 1.96% | 32.416 | 5.75% | 270.527 | 47.97% |
| Hinlayagan Ilaud | 306.645 | 149.97 | 48.91% | 13.027 | 4.25% | 6.523 | 2.13% | 38.421 | 12.53% | 98.705 | 32.19% | ||||||
| Hinlayagan Ilaya | 486.672 | 415.261 | 85.33% | 2.674 | 0.55% | 16.91 | 3.48% | 51.827 | 10.65% | ||||||||
| Kauswagan | 3,091.78 | 66.346 | 2.15% | 135.342 | 4.38% | 14.142 | 0.46% | 2,073.40 | 67.06% | 802.555 | 25.96% | ||||||
| Kinan-oan | 439.893 | 276.964 | 62.96% | 8.24 | 1.87% | 36.364 | 8.27% | 118.325 | 26.90% | ||||||||
| La Union | 724.351 | 473.118 | 65.32% | 22.274 | 3.08% | 9.492 | 1.31% | 2.908 | 0.40% | 216.559 | 29.90% | ||||||
| La Victoria | 516.037 | 320.767 | 62.16% | 5.446 | 1.06% | 44.002 | 8.53% | 5.005 | 0.97% | 10.022 | 1.94% | 130.795 | 25.35% | ||||
| M. Cabiguhan | 306.975 | 111.85 | 36.44% | 11.401 | 3.71% | 8.25 | 2.69% | 1.203 | 0.39% | 6.416 | 2.09% | 6.571 | 2.14% | 161.284 | 52.54% | ||
| M. Roxas | 512.497 | 322.527 | 62.93% | 19.612 | 3.83% | 14.759 | 2.88% | 155.599 | 30.36% | ||||||||
| Mahagbu | 627.355 | 431.038 | 68.71% | 4.424 | 0.71% | 191.894 | 30.59% | ||||||||||
| Poblacion | 671.786 | 257.065 | 38.27% | 3.551 | 0.53% | 29.729 | 4.43% | 74.387 | 11.07% | 16.379 | 2.44% | 12.016 | 1.79% | 31.36 | 4.67% | 247.299 | 36.81% |
| San Isidro | 620.653 | 56.707 | 9.14% | 7.375 | 1.19% | 6.935 | 1.12% | 327.419 | 52.75% | 222.217 | 35.80% | ||||||
| San Vicente | 2,233.06 | 550.588 | 24.66% | 29.053 | 1.30% | 10.001 | 0.45% | 12.449 | 0.56% | 1,131.02 | 50.65% | 13.694 | 0.61% | 13.965 | 0.63% | 472.29 | 21.15% |
| Soom | 616.046 | 351.483 | 57.06% | 17.801 | 2.89% | 9.779 | 1.59% | 9.609 | 1.56% | 0.995 | 0.16% | 47.721 | 7.75% | 178.658 | 29.00% | ||
| Sto. Tomas | 401.716 | 175.191 | 43.61% | 70.748 | 17.61% | 155.777 | 38.78% | ||||||||||
| Tagum Norte | 392.375 | 176.76 | 45.05% | 0.977 | 0.25% | 38.025 | 9.69% | 5.248 | 1.34% | 1.467 | 0.37% | 20.478 | 5.22% | 149.421 | 38.08% | ||
| Tagum Sur | 613.829 | 335.184 | 54.61% | 10.576 | 1.72% | 47.216 | 7.69% | 27.089 | 4.41% | 50.537 | 8.23% | 143.228 | 23.33% | ||||
| Total | 14,990.16 | 5,721.63 | 38.17% | 250.397 | 1.67% | 149.28 | 1.00% | 240.953 | 1.61% | 4,178.02 | 27.87% | 53.54 | 0.36% | 232.181 | 1.55% | 4,164.16 | 27.78% |