
Download in PDF and JPG format
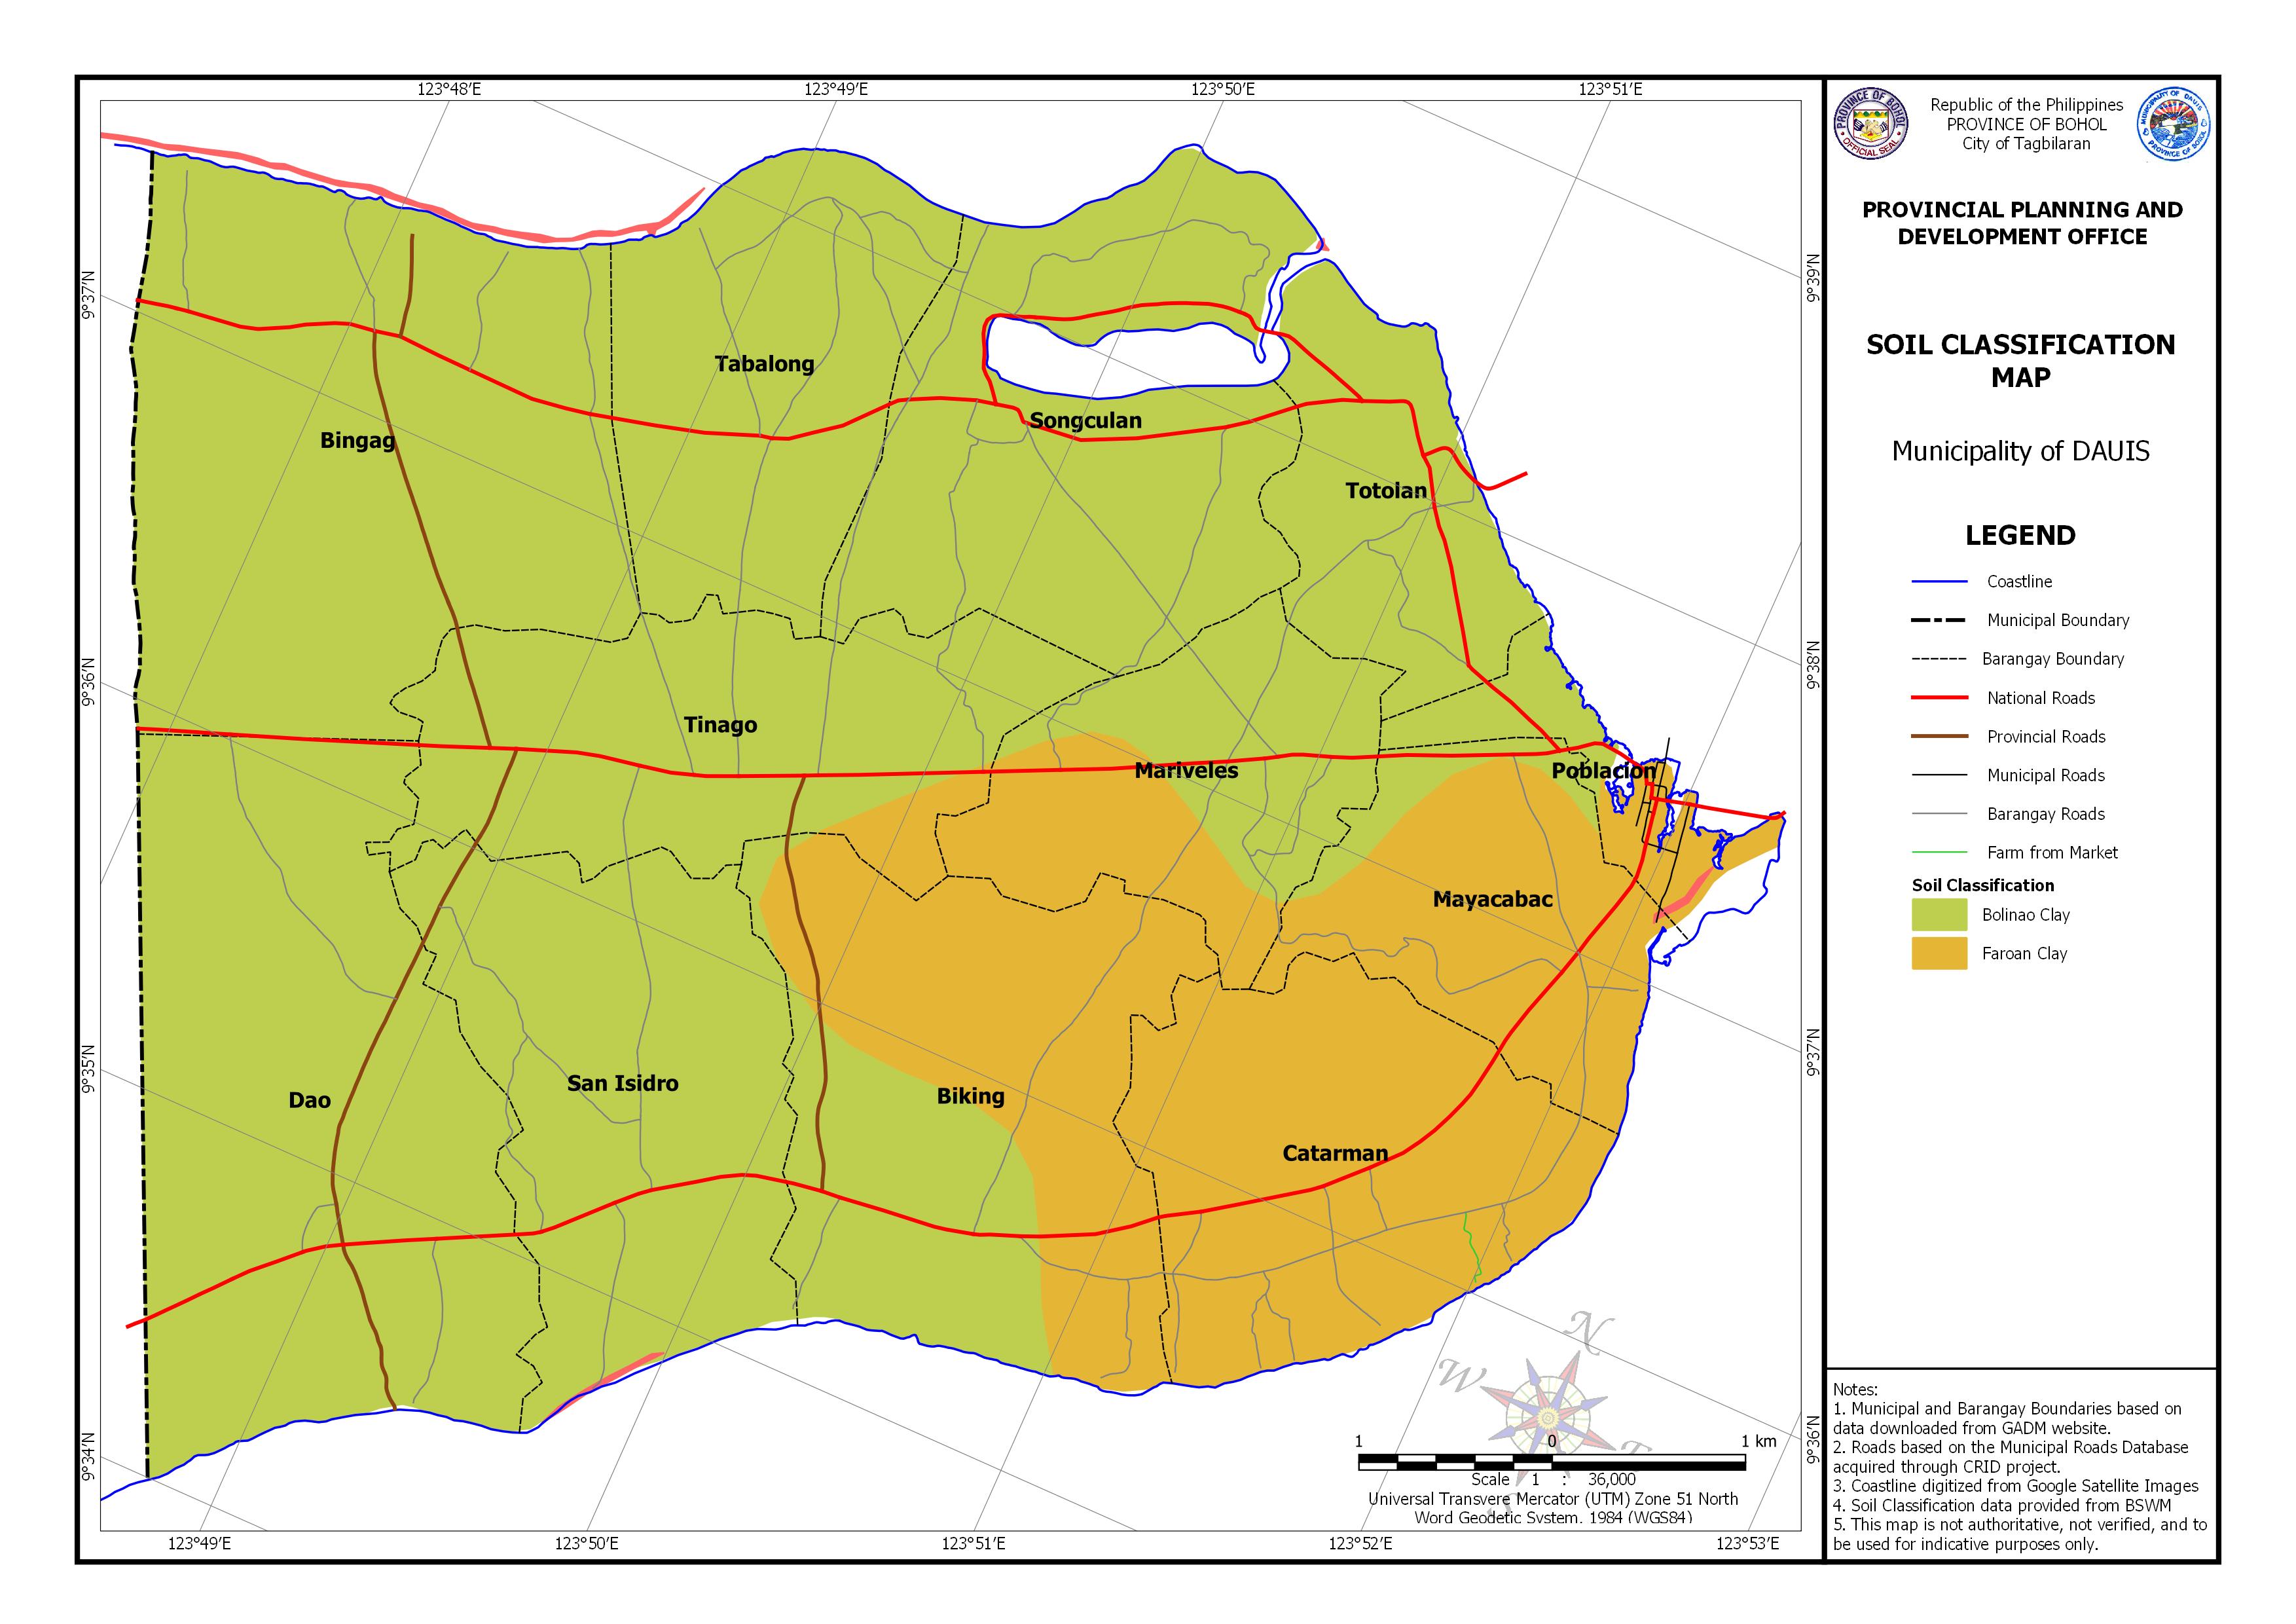
AREA EXPOSED TO SOIL CLASSIFICATION BY BARANGAY
| Barangay | Area | Bolinao Clay | Faroan Clay | ||
| (Hectares) | (Hectares) | Percentage | (Hectares) | Percentage | |
| Biking | 489.508 | 189.051 | 38.62% | 299.115 | 61.11% |
| Bingag | 637.543 | 637.471 | 99.99% | ||
| Catarman | 380.868 | 379.988 | 99.77% | ||
| Dao | 619.836 | 618.887 | 99.85% | ||
| Mariveles | 259.407 | 149.711 | 57.71% | 109.697 | 42.29% |
| Mayacabac | 245.55 | 34.136 | 13.90% | 208.869 | 85.06% |
| Poblacion | 88.749 | 40.603 | 45.75% | 35.821 | 40.36% |
| San Isidro | 409.841 | 407.215 | 99.36% | ||
| Songculan | 425.78 | 422.753 | 99.29% | ||
| Tabalong | 319.378 | 319.299 | 99.98% | ||
| Tinago | 376.656 | 351.639 | 93.36% | 25.016 | 6.64% |
| Totolan | 201.105 | 198.688 | 98.80% | ||
| Total | 4454.22 | 3369.453 | 846.60% | 1058.505 | 335.23% |