
Download in PDF and JPG format
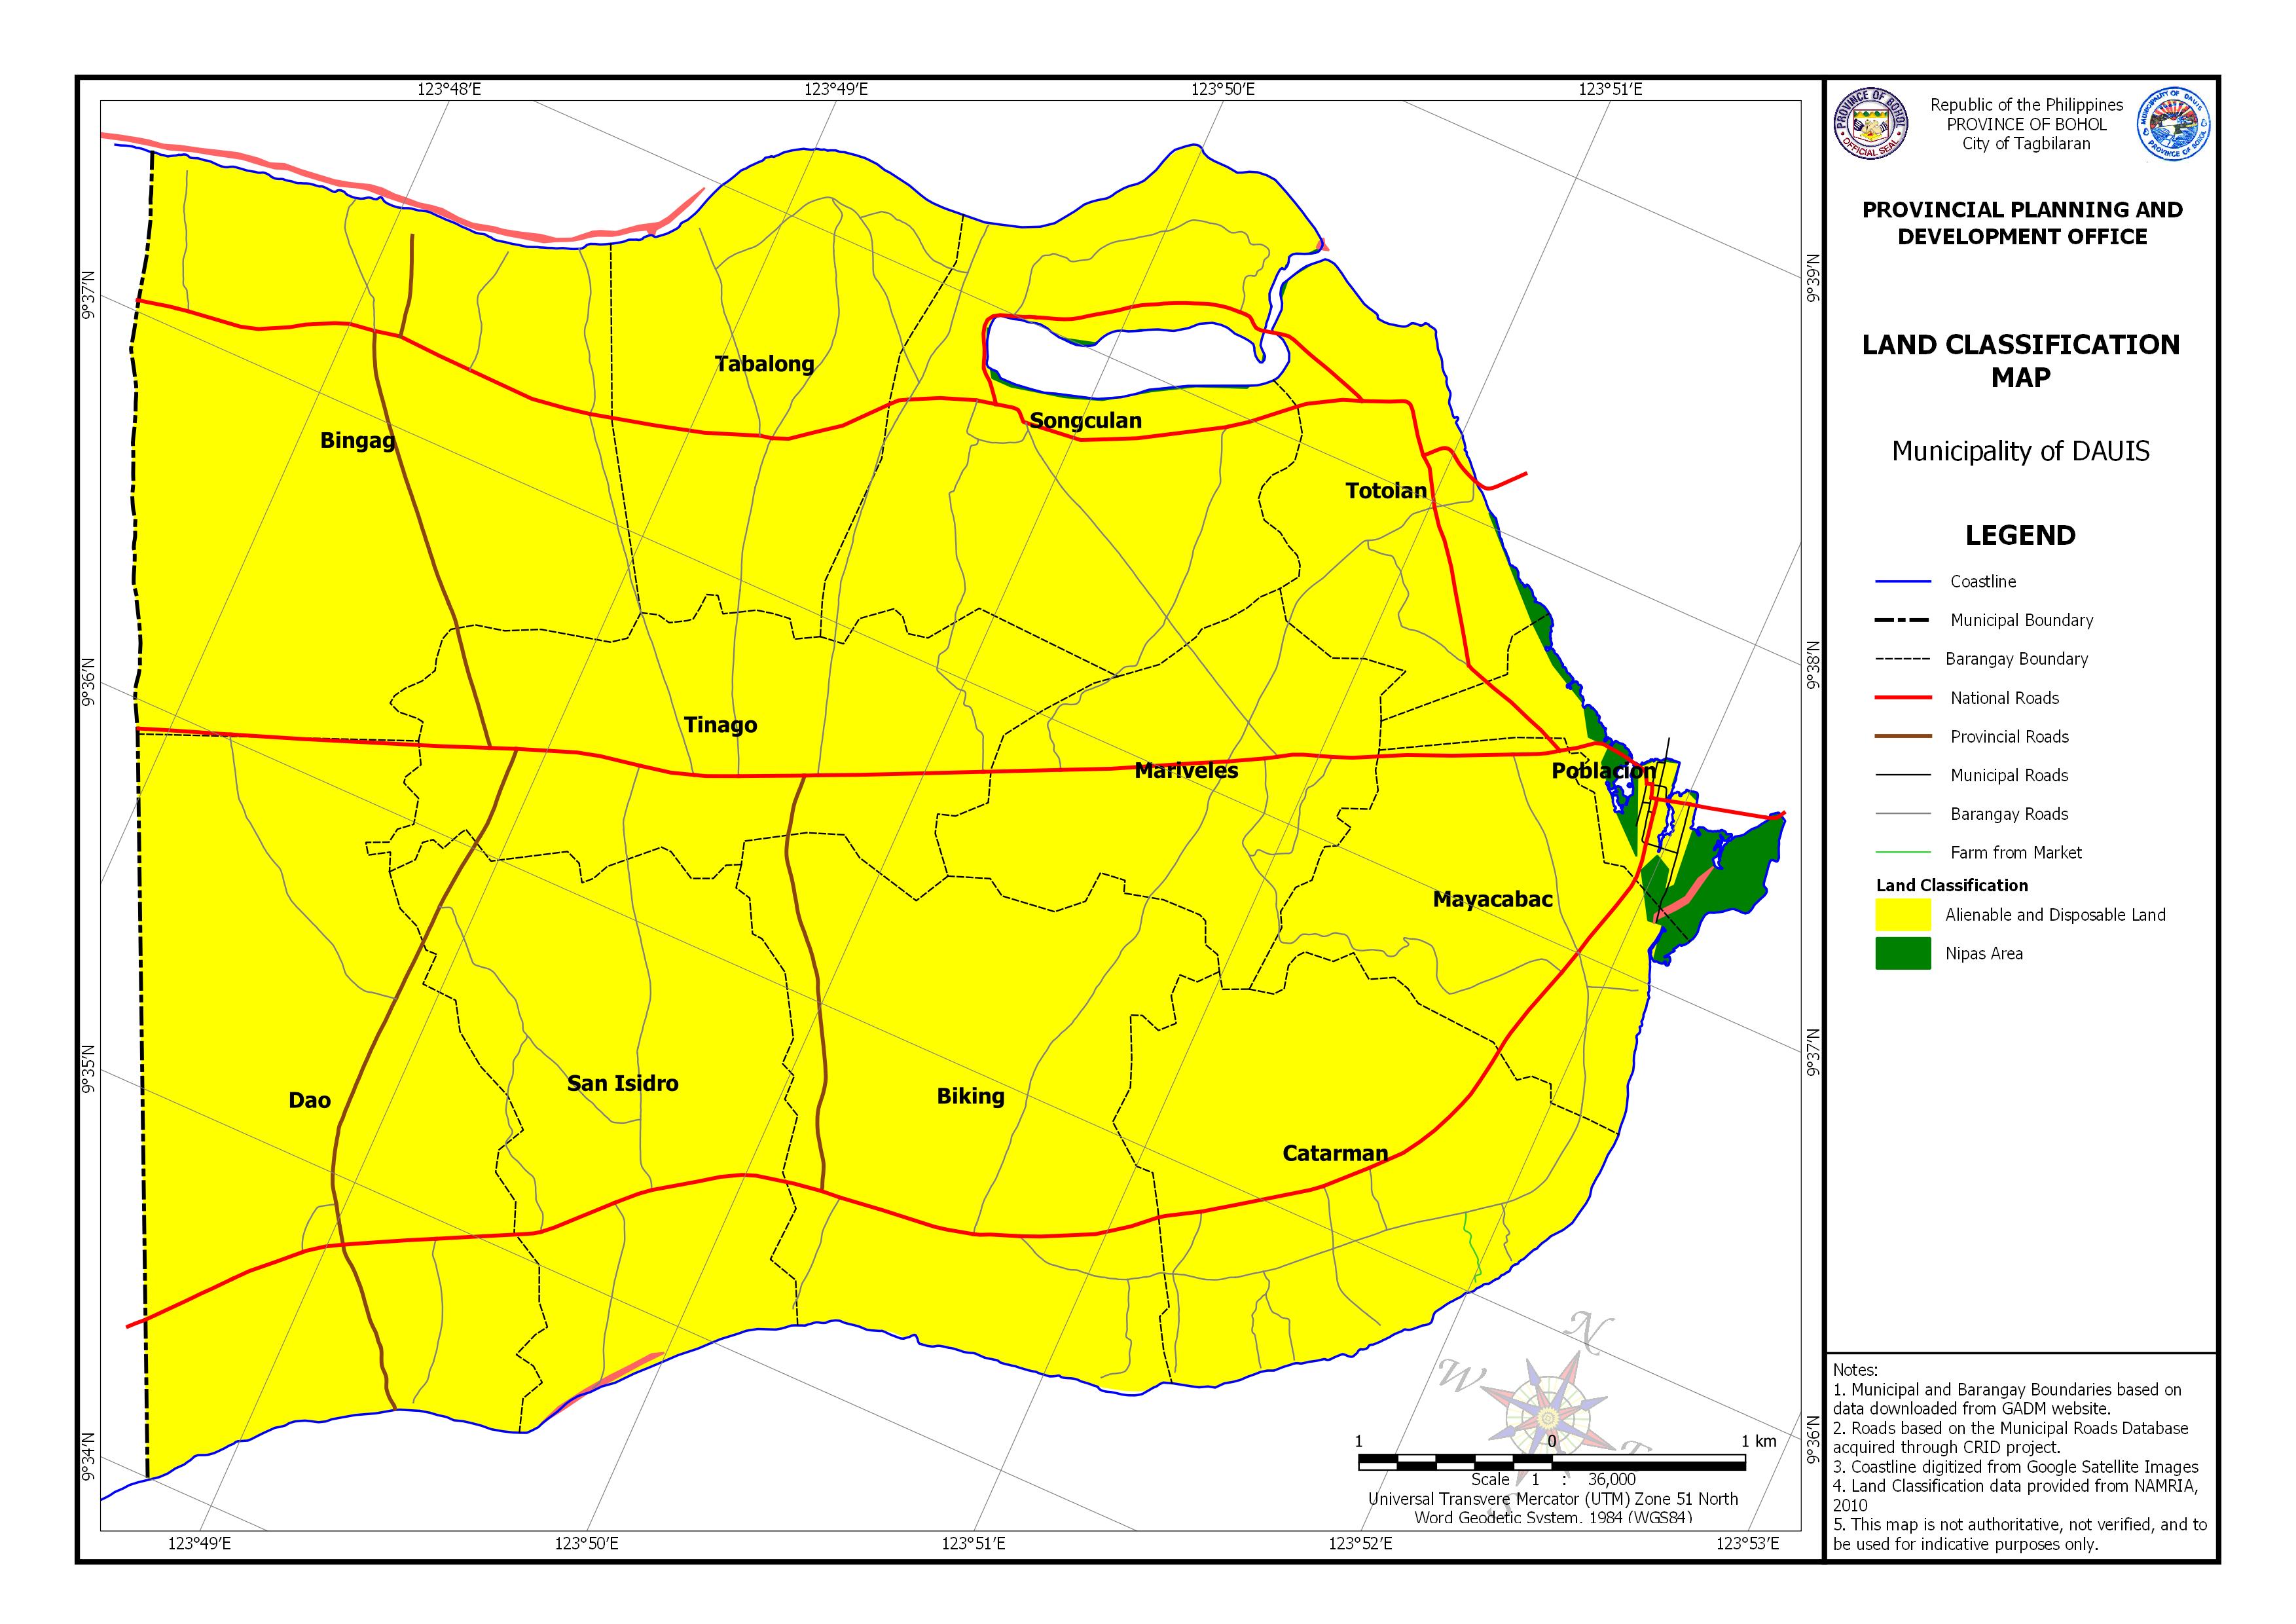
AREA EXPOSED TO LAND CLASSIFICATION BY BARANGAY
| Barangay | Area | Area Exposed to Alien and Disposable Land | Area Exposed to Nipas Area | ||
| (Hectares) | (Hectares) | Percentage | (Hectares) | Percentage | |
| Biking | 489.508 | 488.537 | 99.80% | ||
| Bingag | 637.543 | 637.532 | 100.00% | ||
| Catarman | 380.868 | 380.79 | 99.98% | ||
| Dao | 619.836 | 619.836 | 100.00% | ||
| Mariveles | 259.407 | 259.407 | 100.00% | ||
| Mayacabac | 245.55 | 242.369 | 98.71% | 3.181 | 0.013 |
| Poblacion | 88.749 | 55.892 | 62.98% | 32.789 | 0.369 |
| San Isidro | 409.841 | 409.8 | 99.99% | ||
| Songculan | 425.78 | 421.763 | 99.06% | 3.745 | 0.009 |
| Tabalong | 319.378 | 319.376 | 100.00% | ||
| Tinago | 376.656 | 376.656 | 100.00% | ||
| Totolan | 201.105 | 198.865 | 98.89% | 2.285 | 0.011 |
| Total | 4454.22 | 4410.823 | 1159.39% | 42 | 40.26% |