
Download in PDF and JPG format
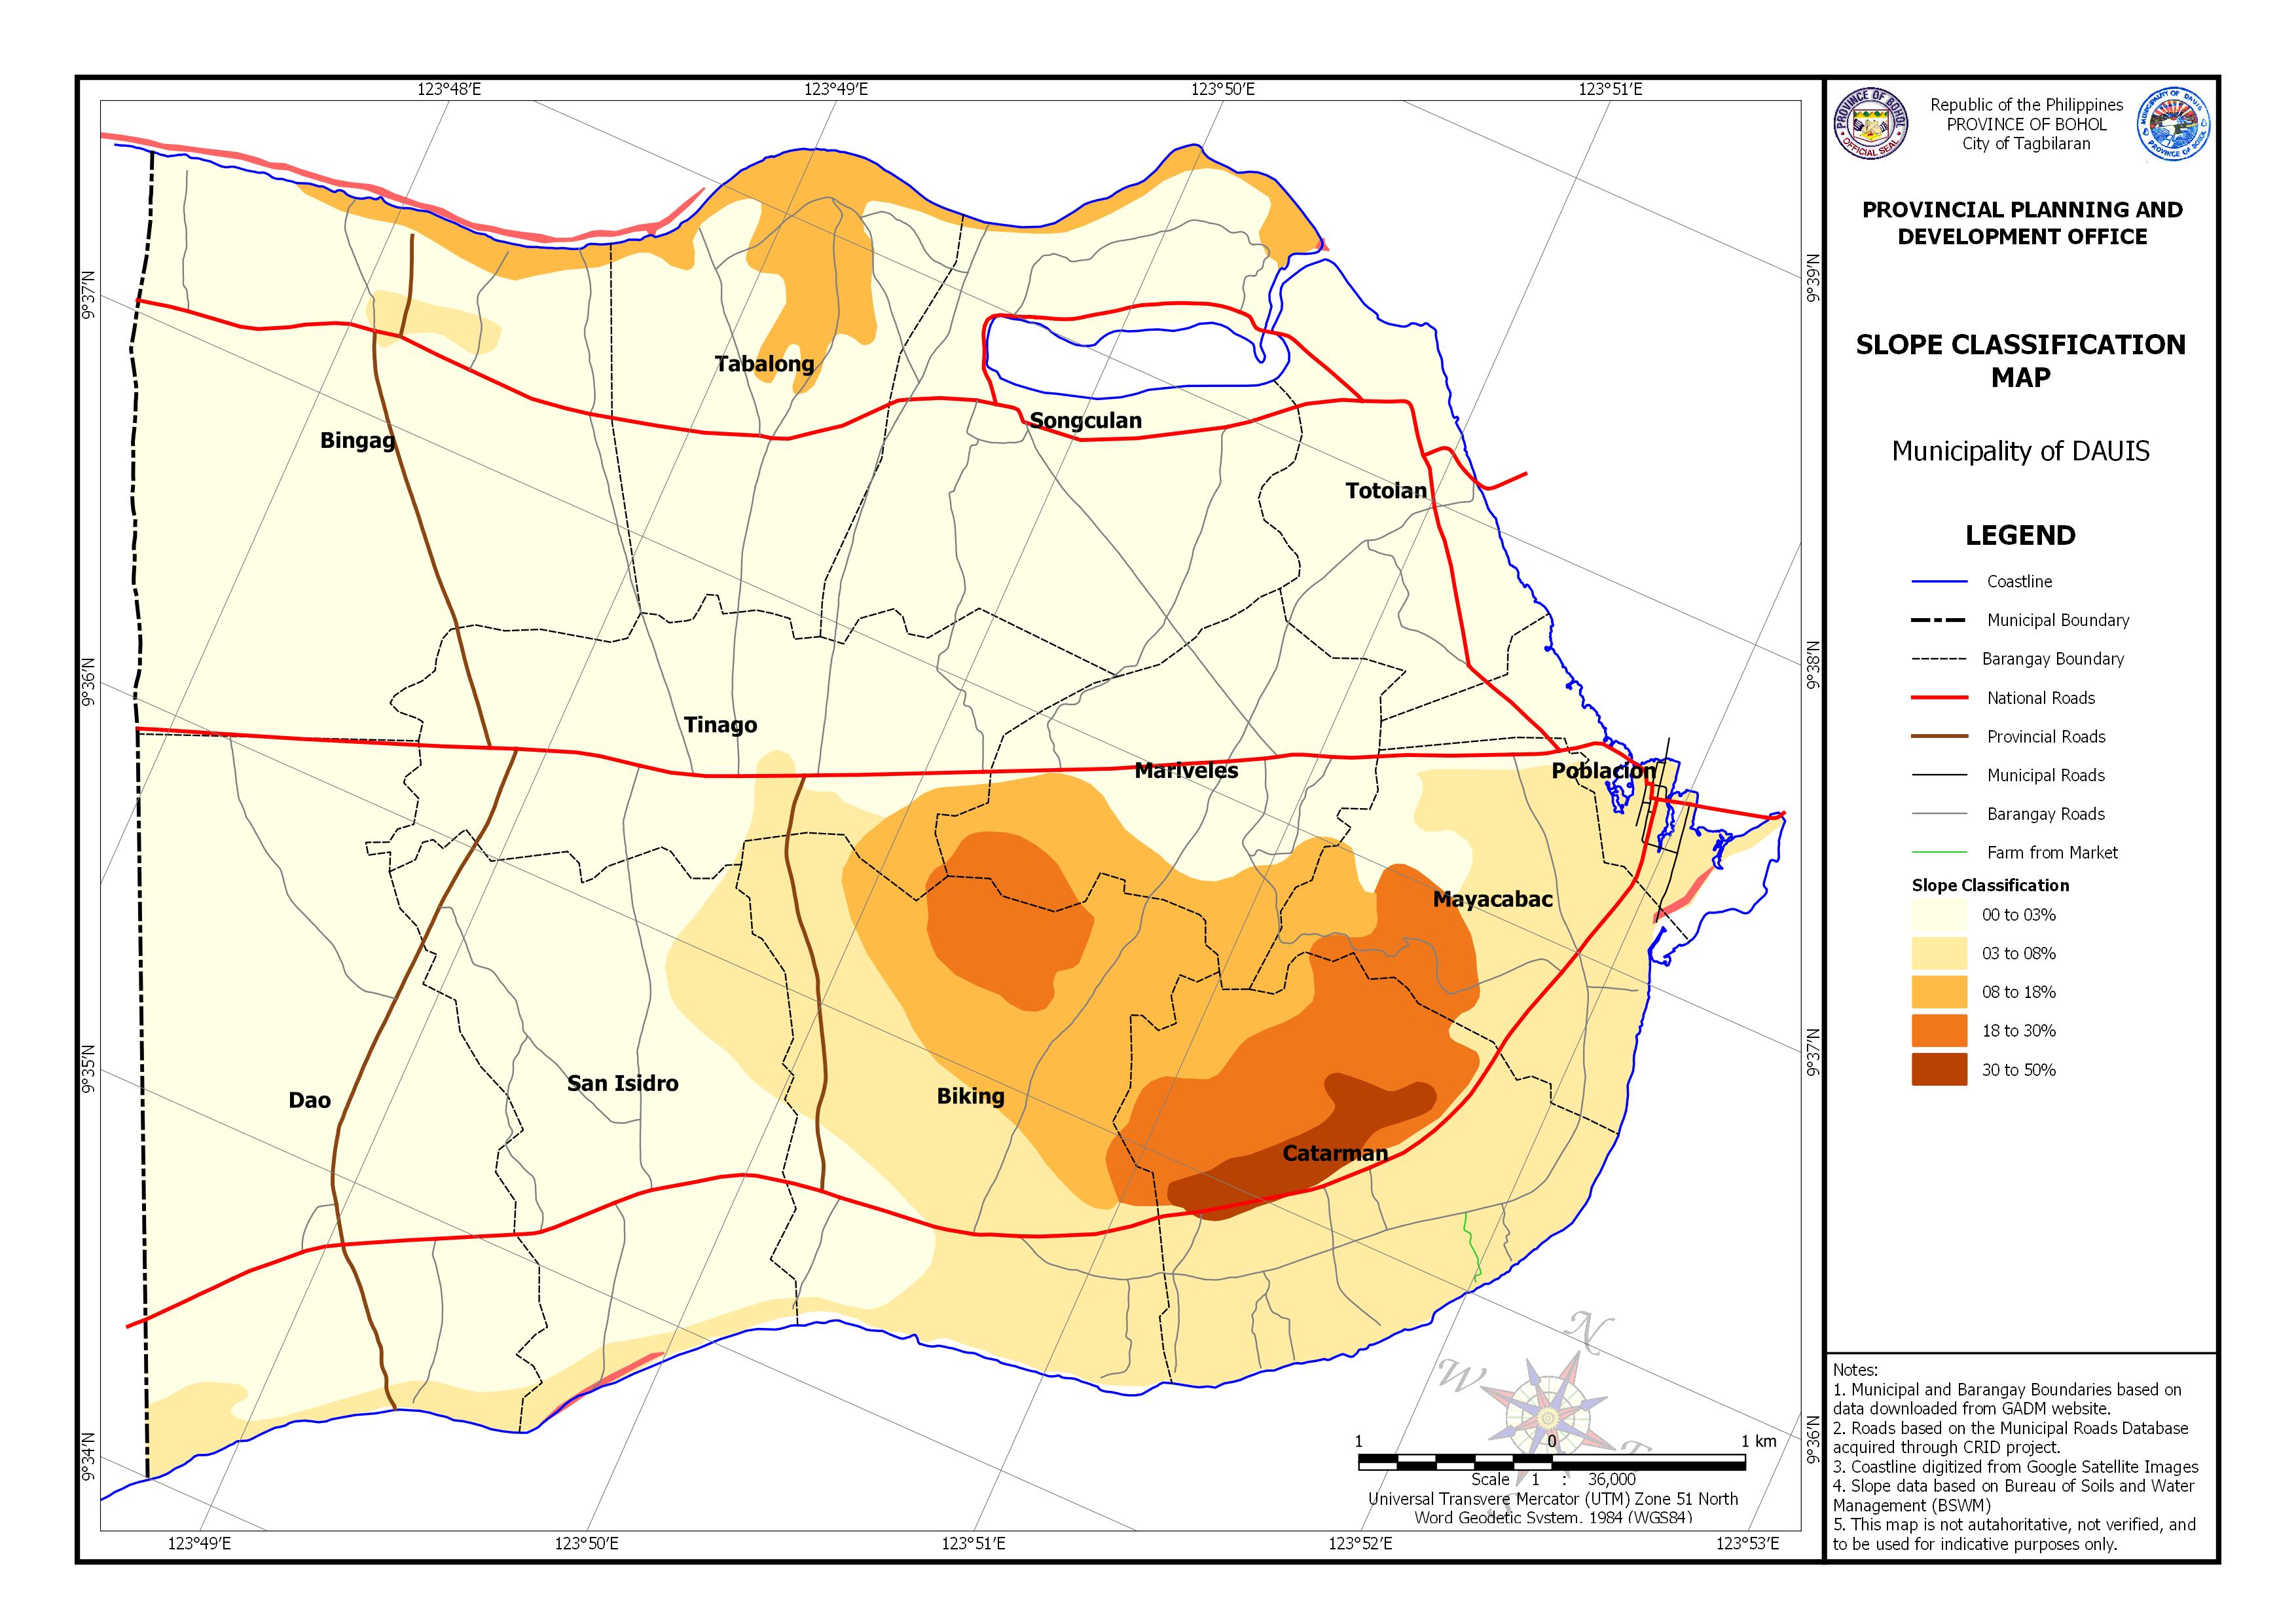
AREA EXPOSED TO SLOPE CLASSIFICATION BY BARANGAY
| Barangay | Area | 0 to 3% Slope | 3 to 8% Slope | 8 to 18% Slope | 18 to 30% Slope | 30 to 50% Slope | |||||
| (Hectares) | (Hectares) | Percentage | (Hectares) | Percentage | (Hectares) | Percentage | (Hectares) | Percentage | (Hectares) | Percentage | |
| Biking | 489.508 | 52.737 | 10.77% | 245.321 | 50.12% | 138.231 | 28.24% | 46.294 | 9.46% | ||
| Bingag | 637.543 | 602.105 | 94.44% | 14.216 | 2.23% | 21.221 | 3.33% | ||||
| Catarman | 380.868 | 206.899 | 54.32% | 32.764 | 8.60% | 100.670 | 26.43% | 39.499 | 10.37% | ||
| Dao | 619.836 | 581.677 | 93.84% | 37.335 | 6.02% | ||||||
| Mariveles | 259.407 | 174.565 | 67.29% | 67.688 | 26.09% | 17.153 | 6.61% | ||||
| Mayacabac | 245.550 | 37.019 | 15.08% | 147.919 | 60.24% | 21.413 | 8.72% | 36.408 | 14.83% | ||
| Poblacion | 88.749 | 39.746 | 44.79% | 34.628 | 39.02% | ||||||
| San Isidro | 409.841 | 339.968 | 82.95% | 67.215 | 16.40% | ||||||
| Songculan | 425.780 | 402.783 | 94.60% | 20.545 | 4.83% | ||||||
| Tabalong | 319.378 | 241.408 | 75.59% | 77.970 | 24.41% | ||||||
| Tinago | 376.656 | 338.286 | 89.81% | 18.662 | 4.96% | 18.758 | 4.98% | 0.949 | 0.25% | ||
| Totolan | 201.105 | 201.020 | 99.96% | ||||||||
| Total | 4454.220 | 3011.314 | 769.12% | 772.194 | 233.30% | 398.590 | 109.20% | 201.475 | 57.58% | 39.499 | 10.37% |