
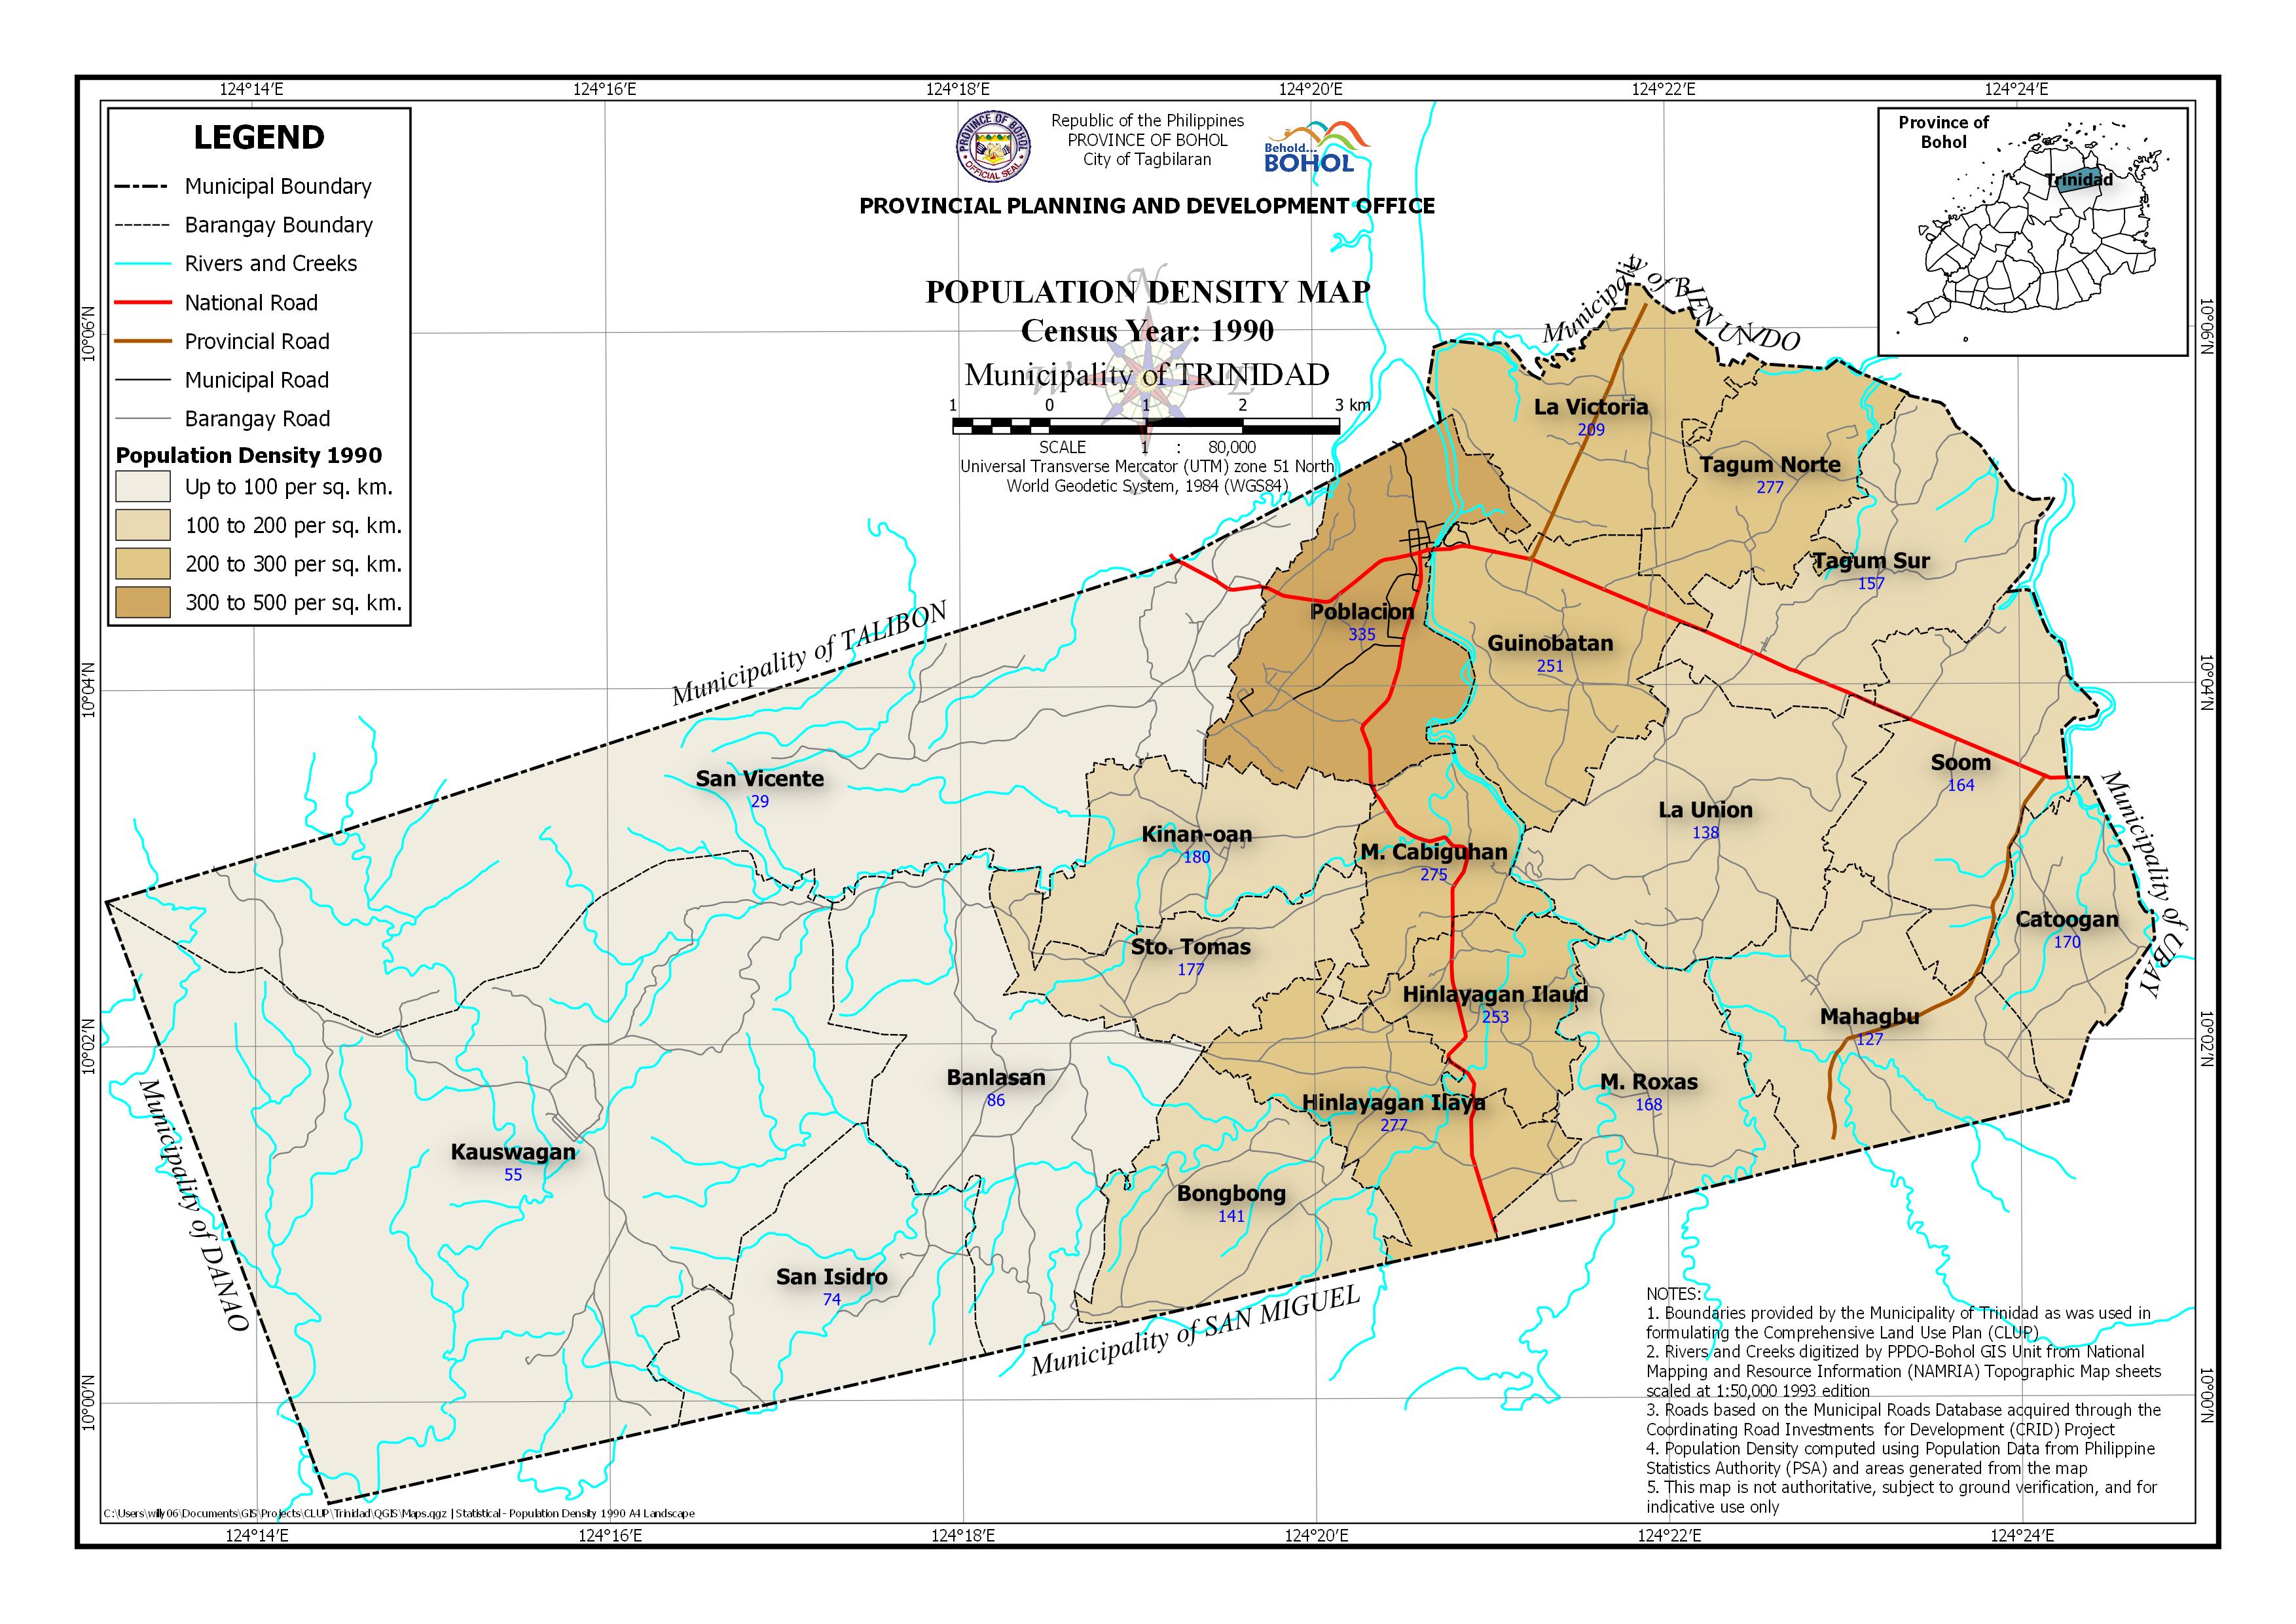
 | Census Year: 1990 Download in PDF and JPG format |
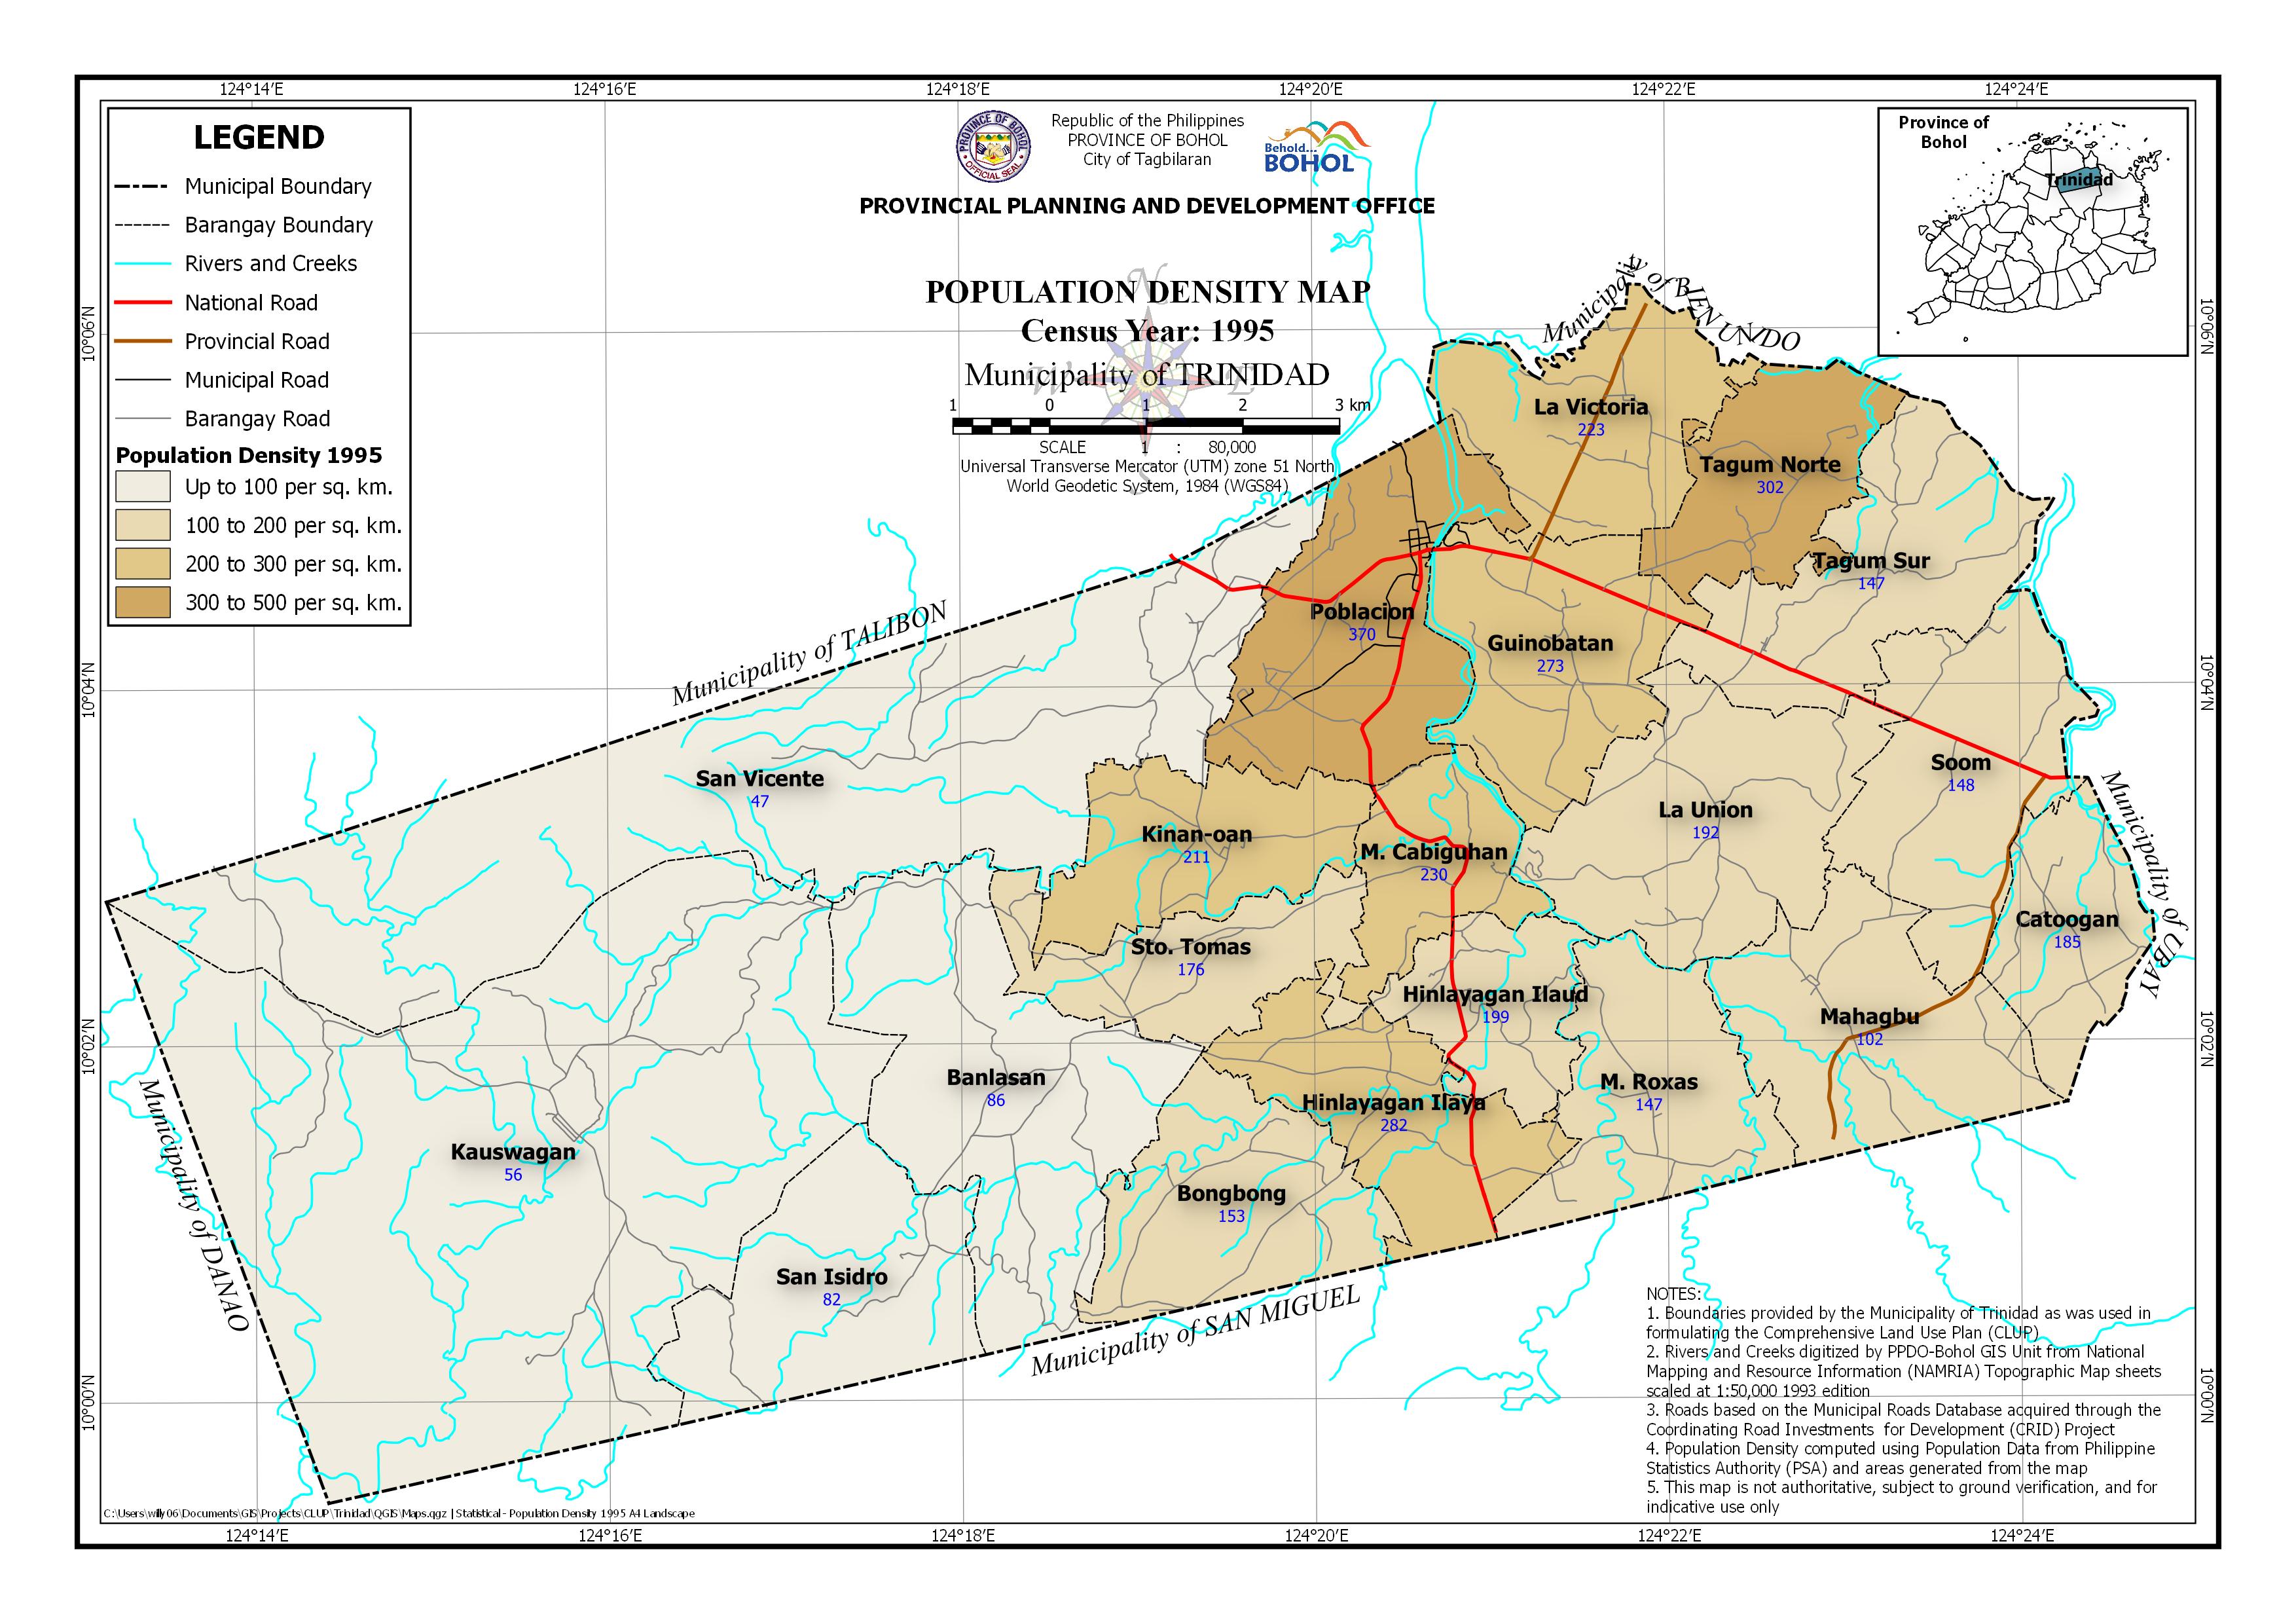 | Census Year: 1995 Download in PDF and JPG format |
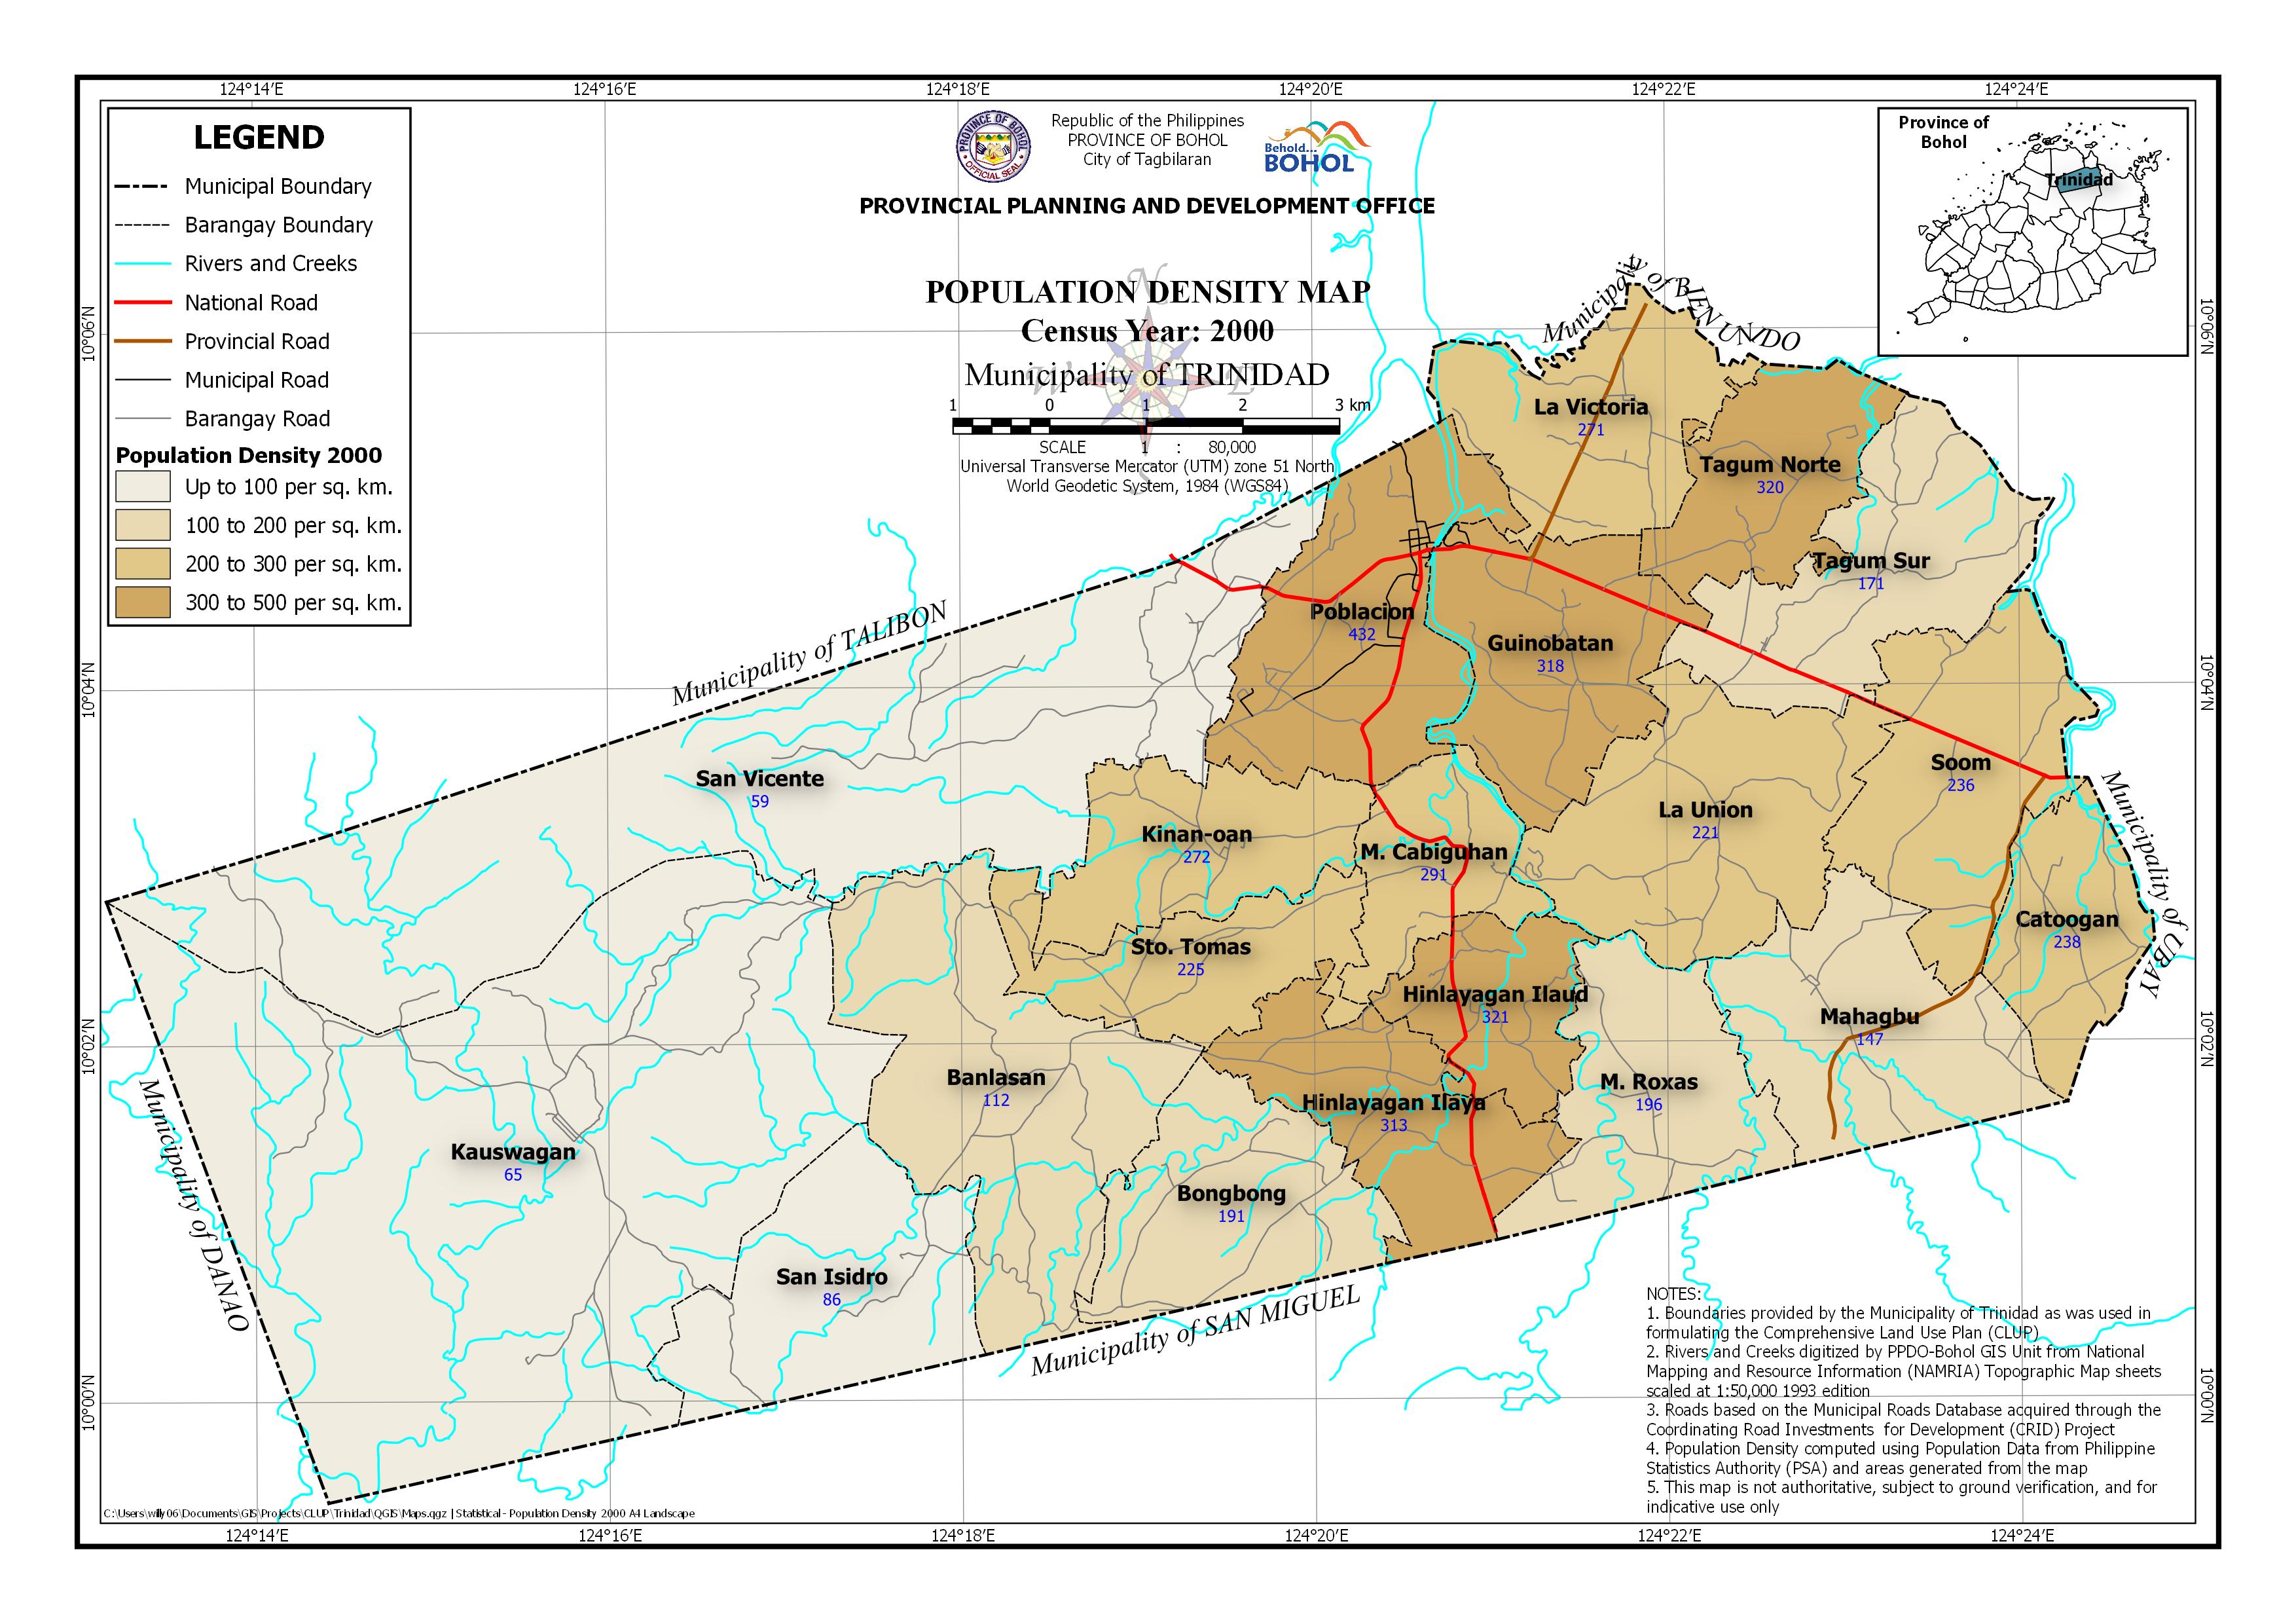 | Census Year: 2000 Download in PDF and JPG format |
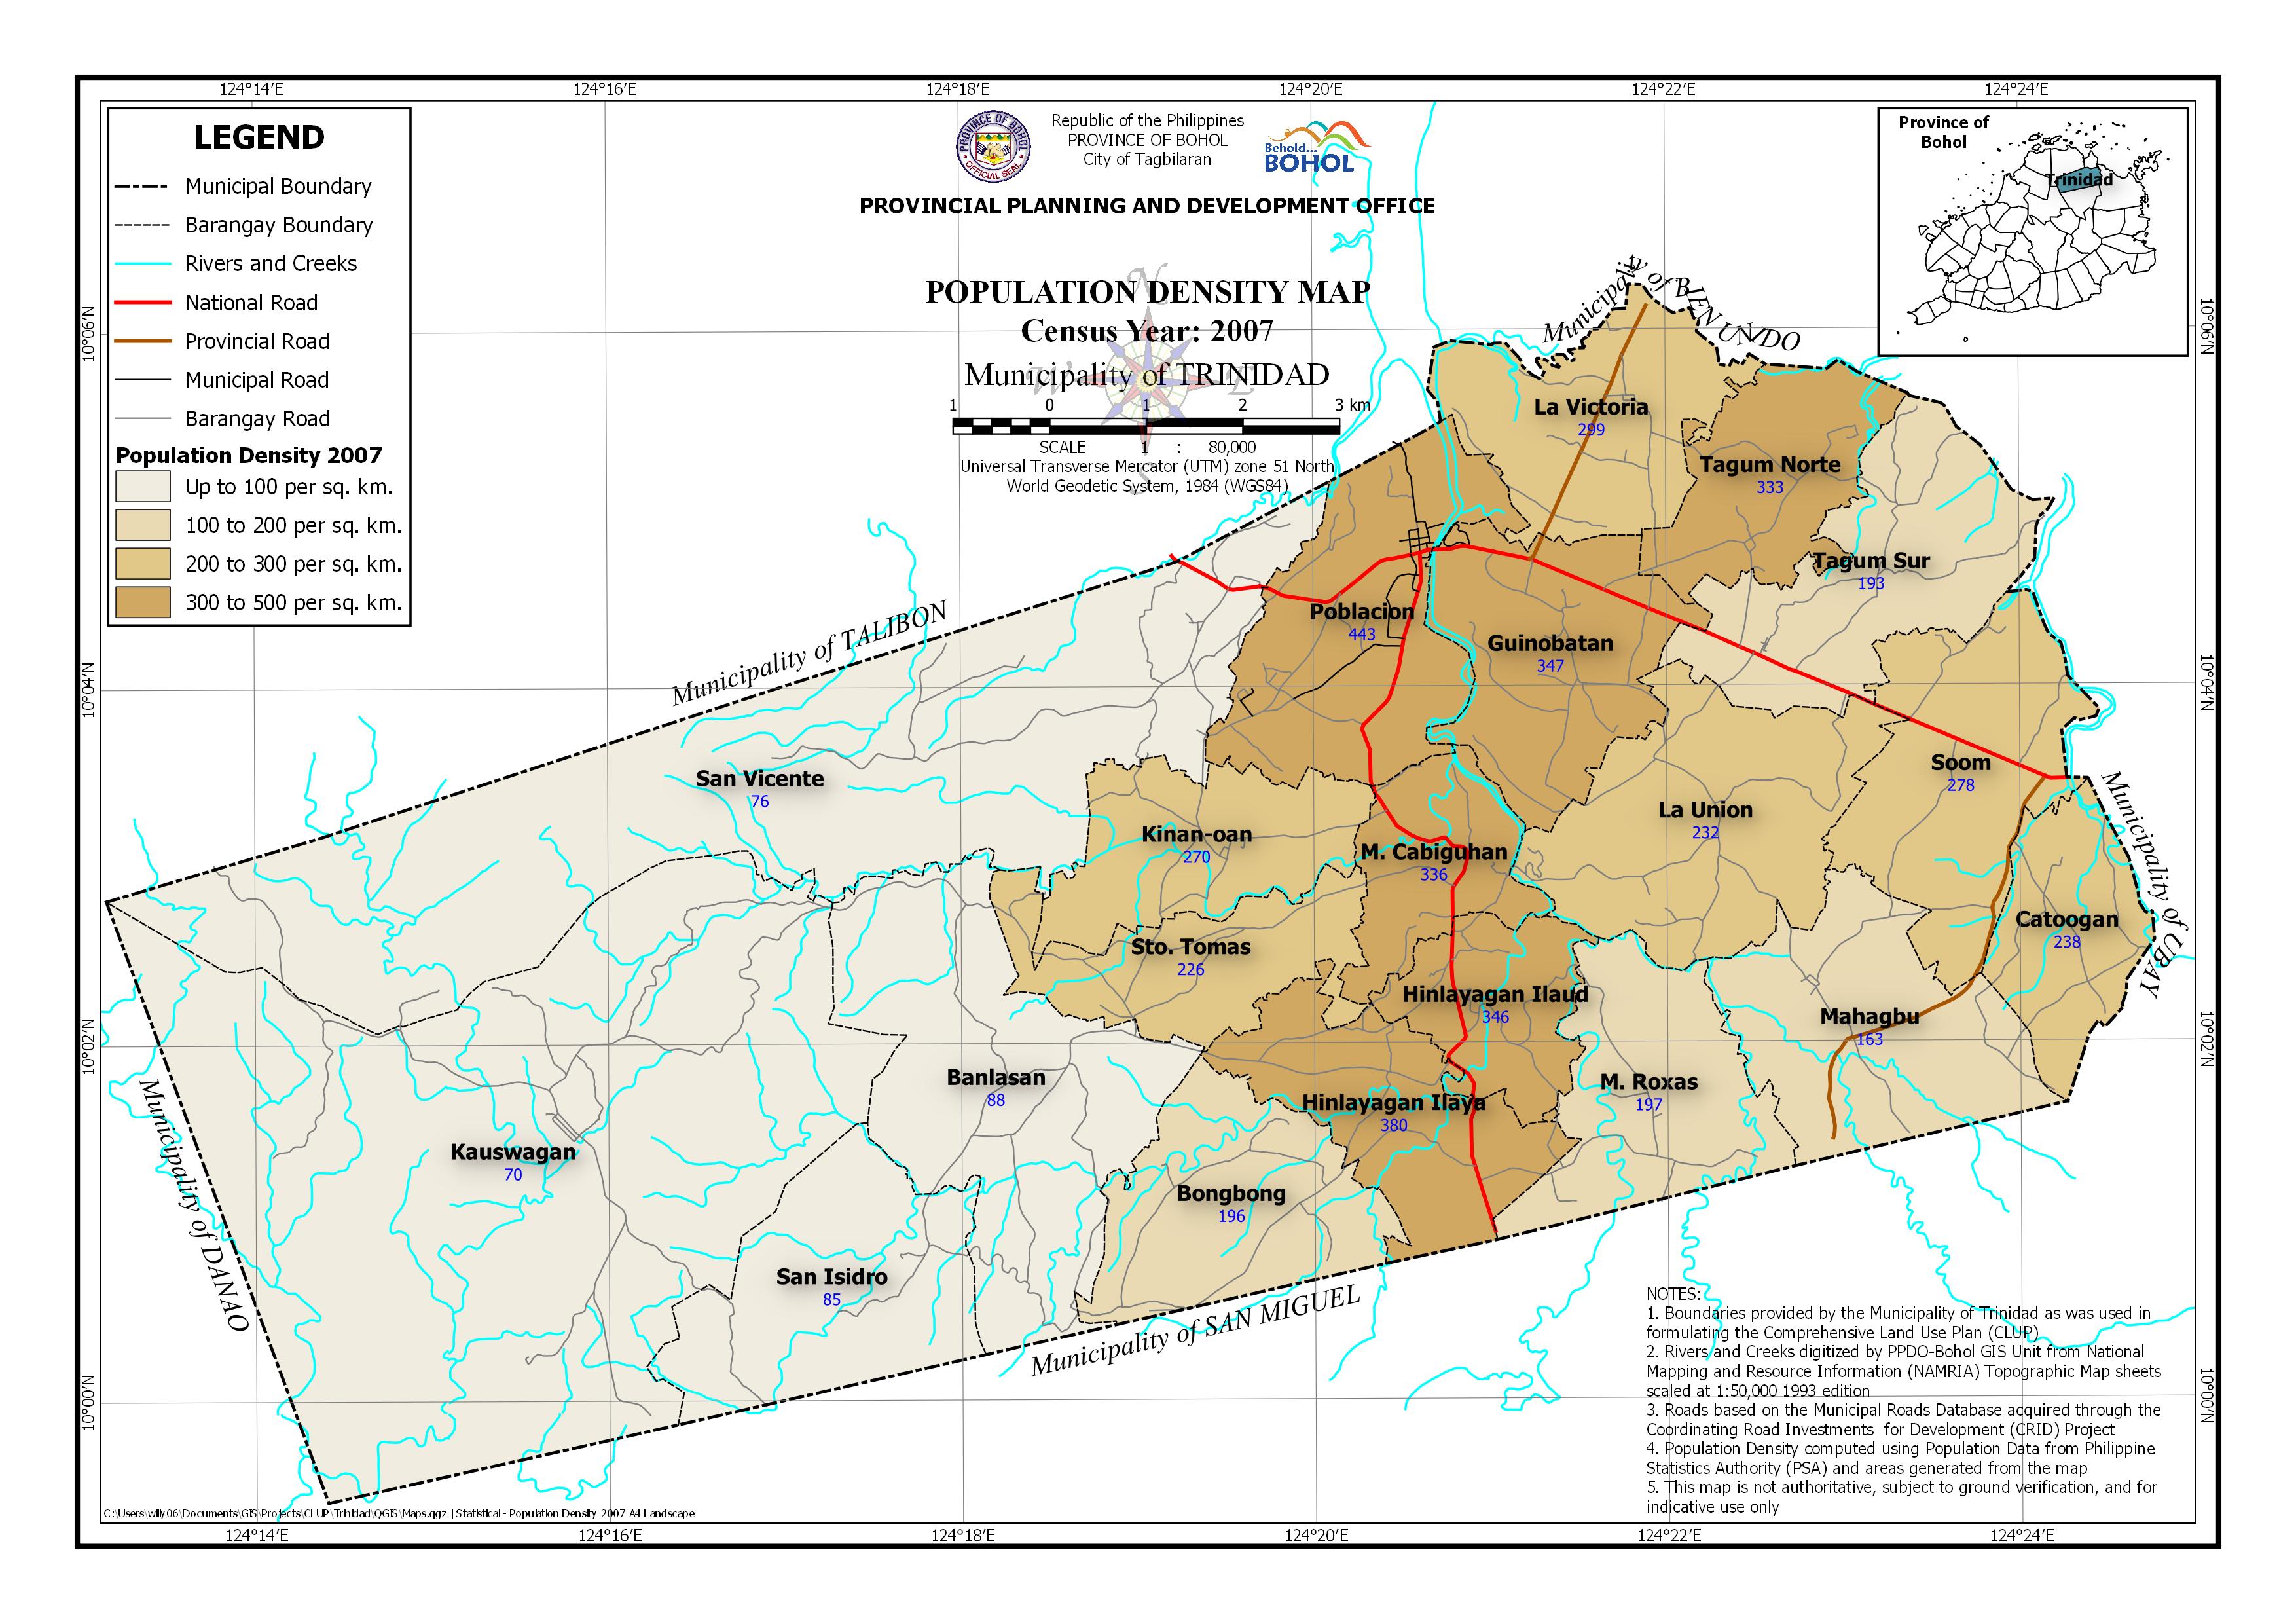 | Census Year: 2007 Download in PDF and JPG format |
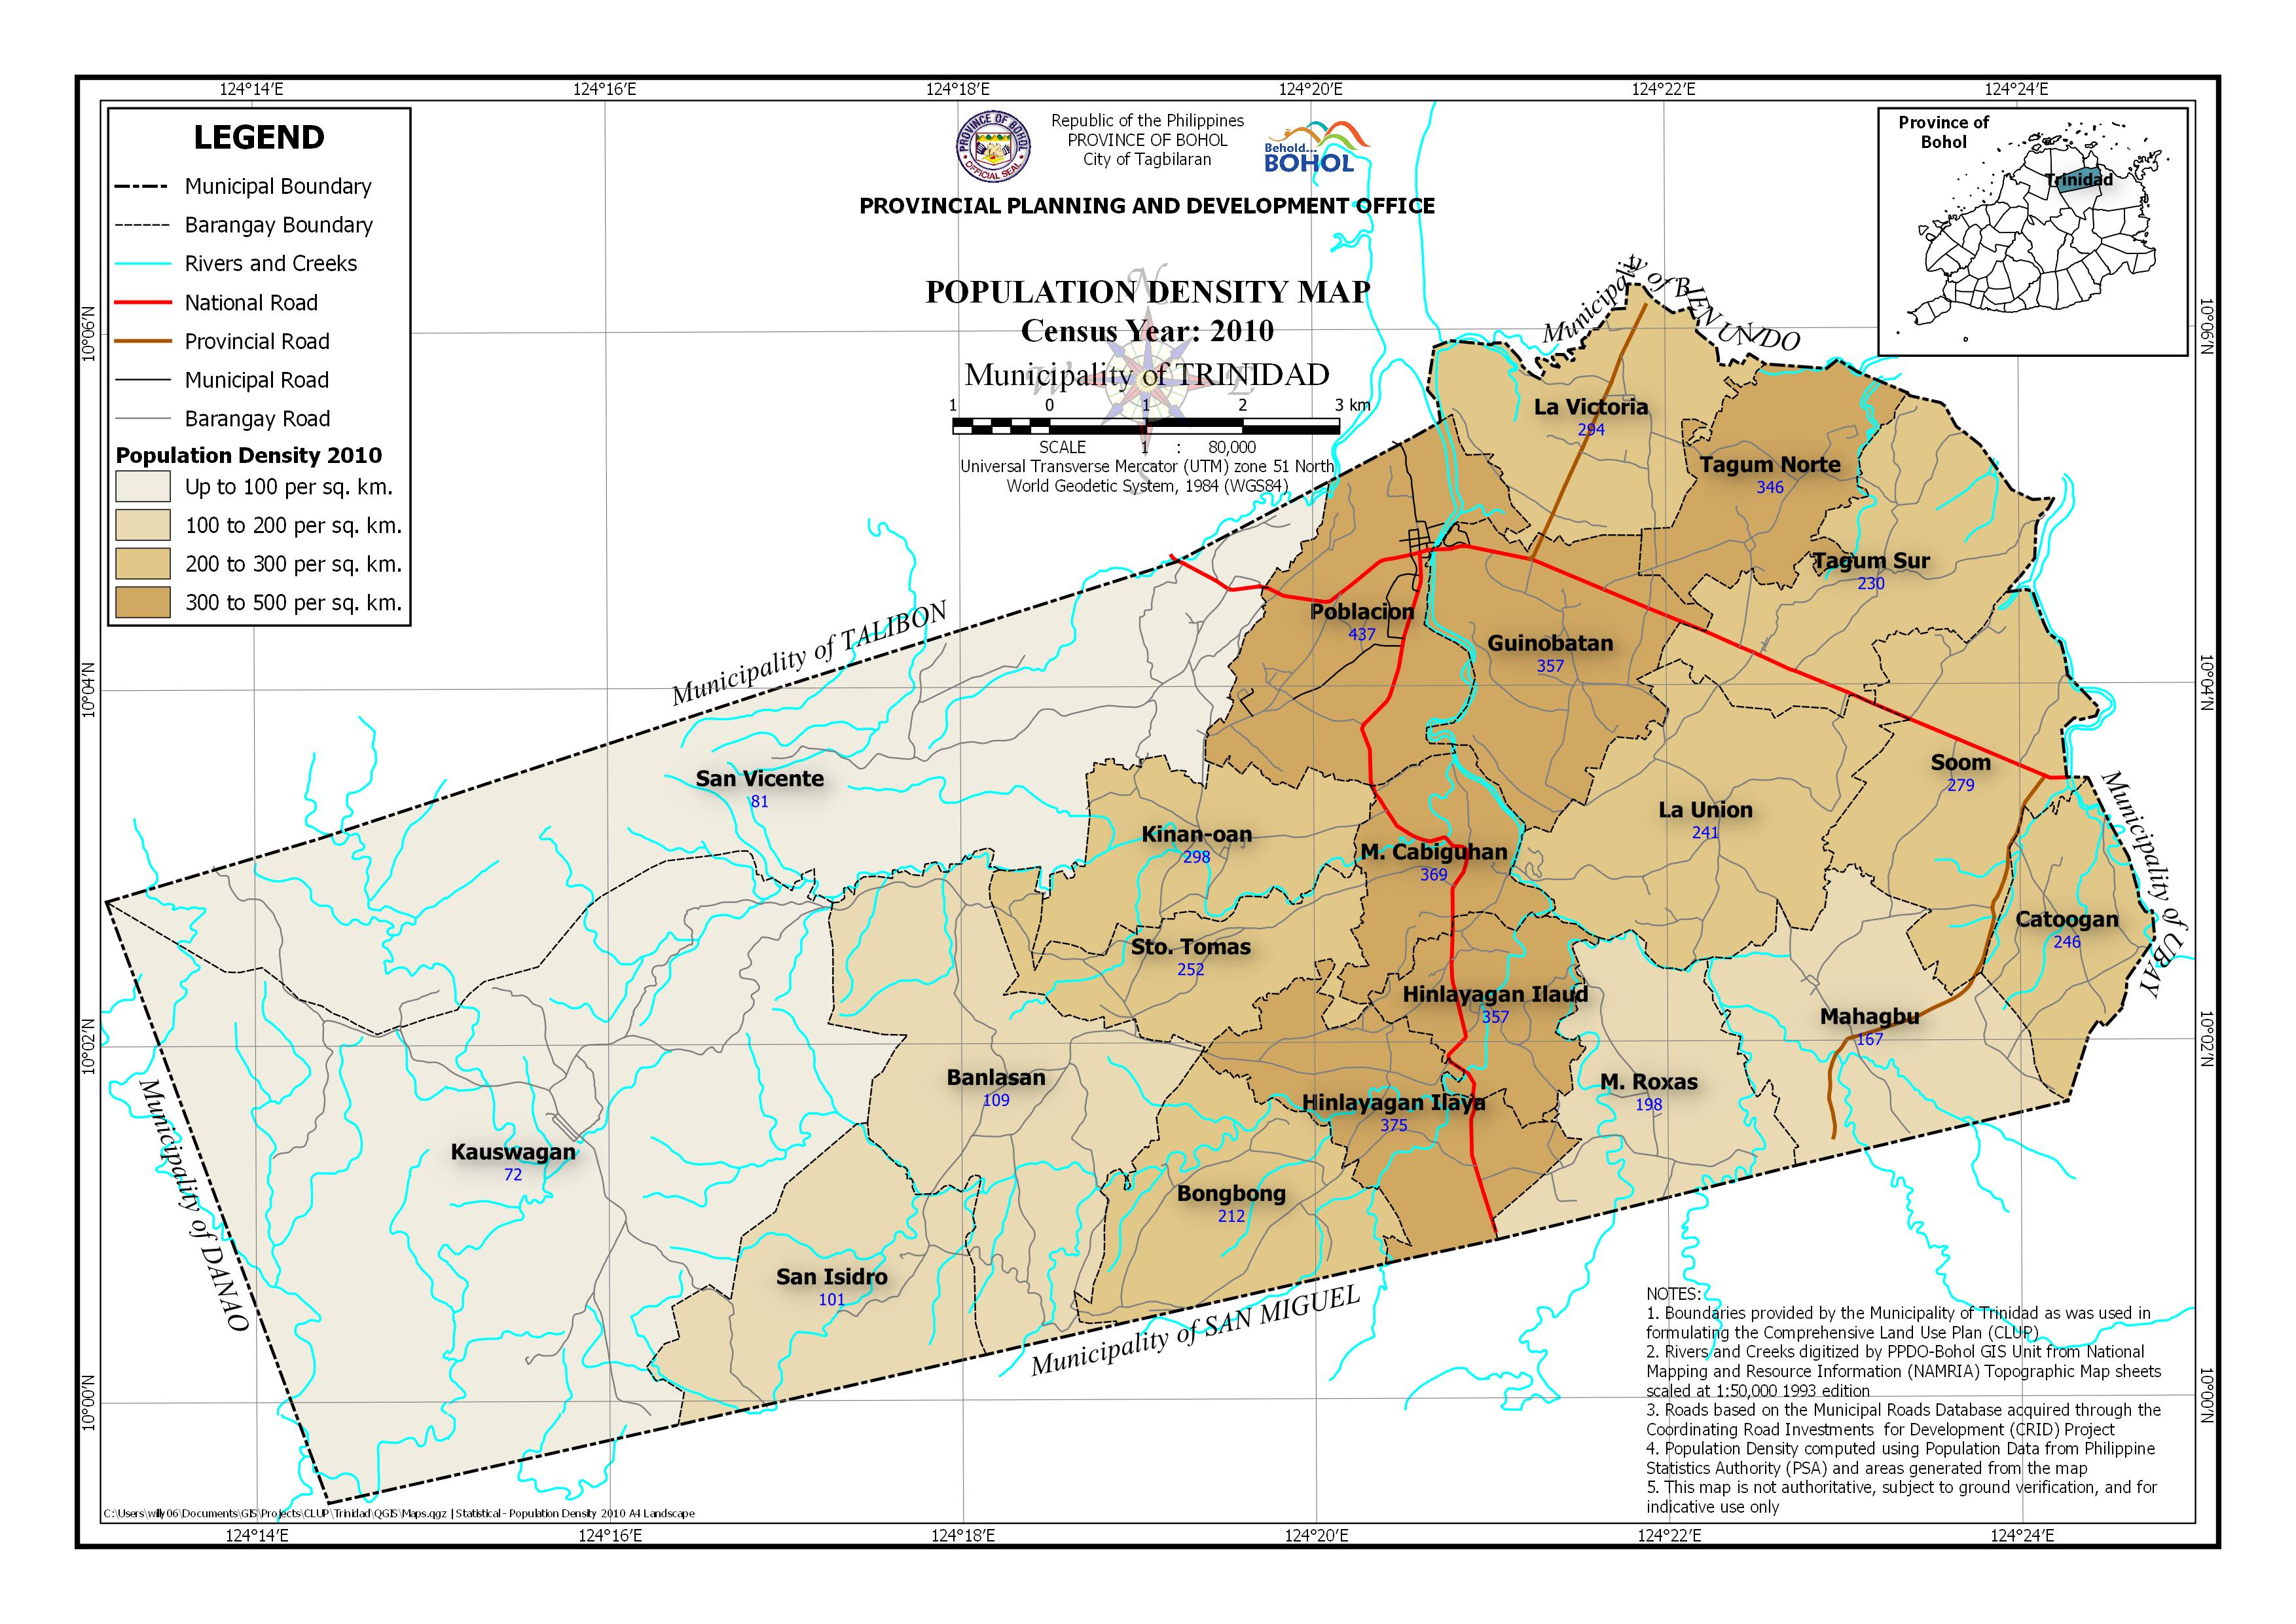 | Census Year: 2010 Download in PDF and JPG format |
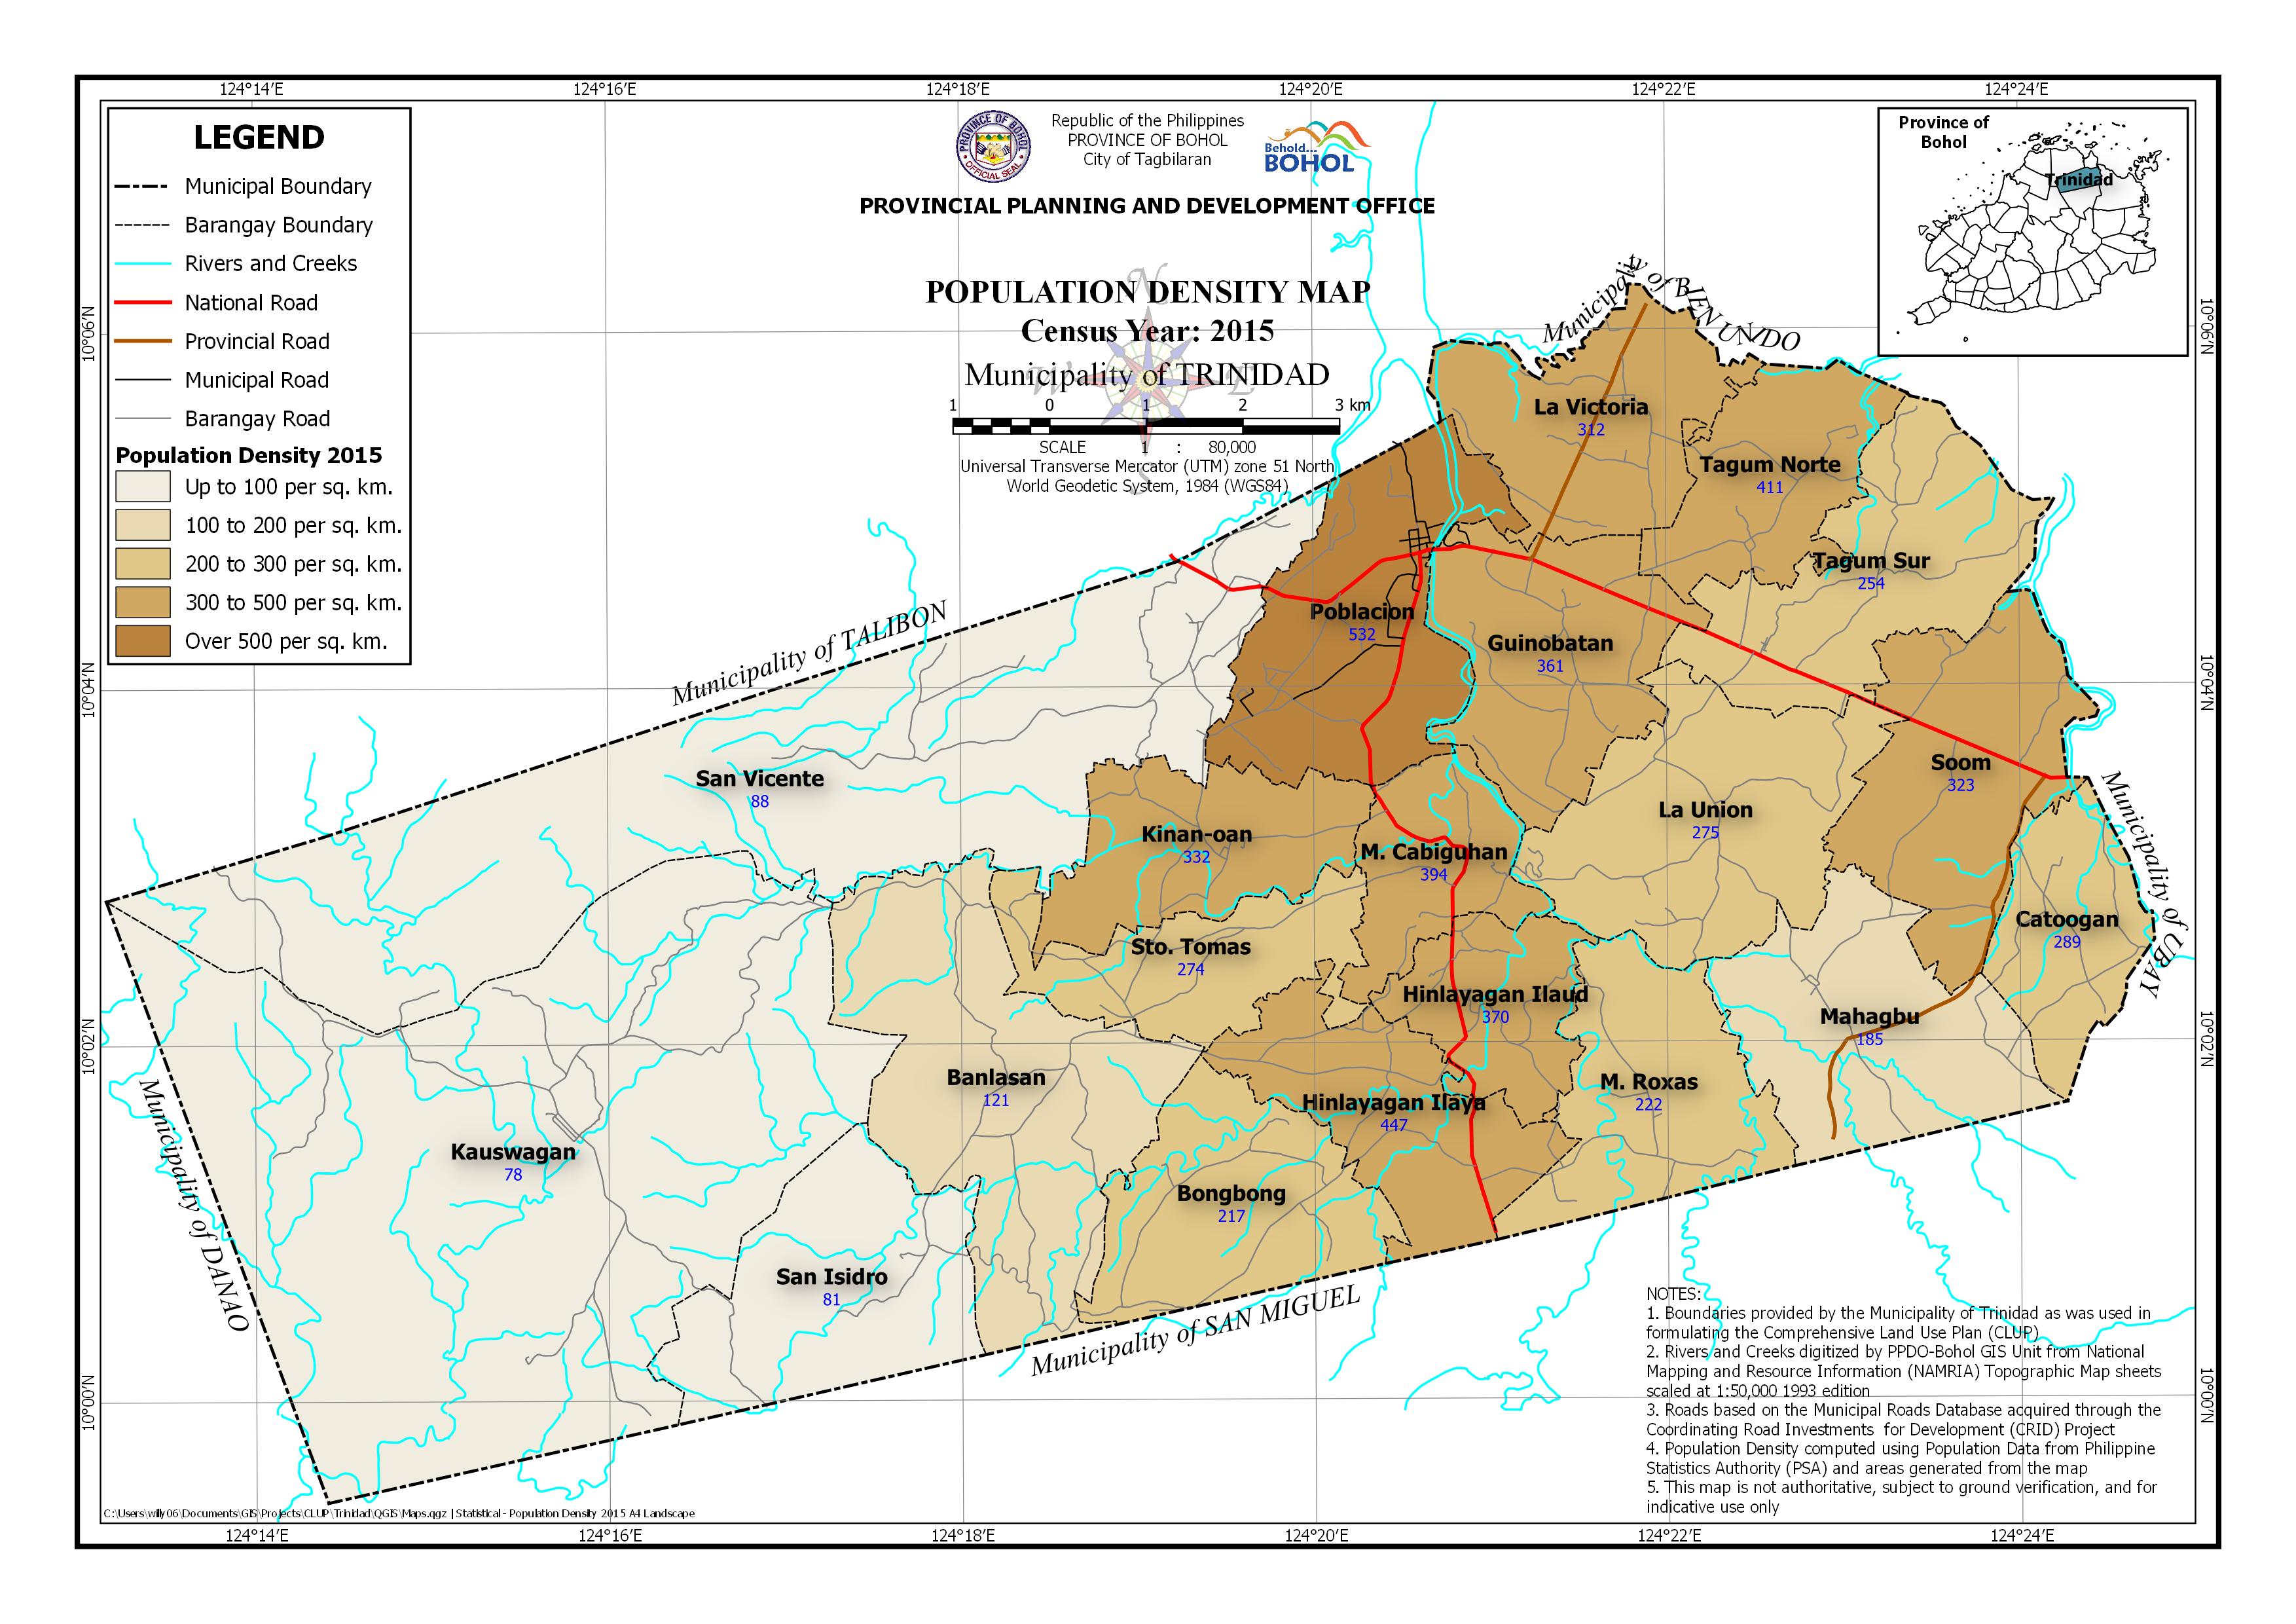 | Census Year: 2015 Download in PDF and JPG format |
| Barangay | Area | Census Year | |||||
| (Hectares) | 1990 | 1995 | 2000 | 2007 | 2010 | 2015 | |
| Banlasan | 988.739 | 86 | 86 | 112 | 88 | 109 | 121 |
| Bongbong | 540.748 | 141 | 153 | 191 | 196 | 212 | 217 |
| Catoogan | 335.1 | 170 | 185 | 238 | 238 | 246 | 289 |
| Guinobatan | 563.906 | 251 | 273 | 318 | 347 | 357 | 361 |
| Hinlayagan Ilaud | 306.645 | 253 | 199 | 321 | 346 | 357 | 370 |
| Hinlayagan Ilaya | 486.672 | 277 | 282 | 313 | 380 | 375 | 447 |
| Kauswagan | 3,091.78 | 55 | 56 | 65 | 70 | 72 | 78 |
| Kinan-oan | 439.893 | 180 | 211 | 272 | 270 | 298 | 332 |
| La Union | 724.351 | 138 | 192 | 221 | 232 | 241 | 275 |
| La Victoria | 516.037 | 209 | 223 | 271 | 299 | 294 | 312 |
| M. Cabiguhan | 306.975 | 275 | 230 | 291 | 336 | 369 | 394 |
| M. Roxas | 512.497 | 168 | 147 | 196 | 197 | 198 | 222 |
| Mahagbu | 627.355 | 127 | 102 | 147 | 163 | 167 | 185 |
| Poblacion | 671.786 | 335 | 370 | 432 | 443 | 437 | 532 |
| San Isidro | 620.653 | 74 | 82 | 86 | 85 | 101 | 81 |
| San Vicente | 2,233.06 | 29 | 47 | 59 | 76 | 81 | 88 |
| Soom | 616.046 | 164 | 148 | 236 | 278 | 279 | 323 |
| Sto. Tomas | 401.716 | 177 | 176 | 225 | 226 | 252 | 274 |
| Tagum Norte | 392.375 | 277 | 302 | 320 | 333 | 346 | 411 |
| Tagum Sur | 613.829 | 157 | 147 | 171 | 193 | 230 | 254 |
| Total | 14,990.16 | 133 | 139 | 171 | 184 | 192 | 213 |