
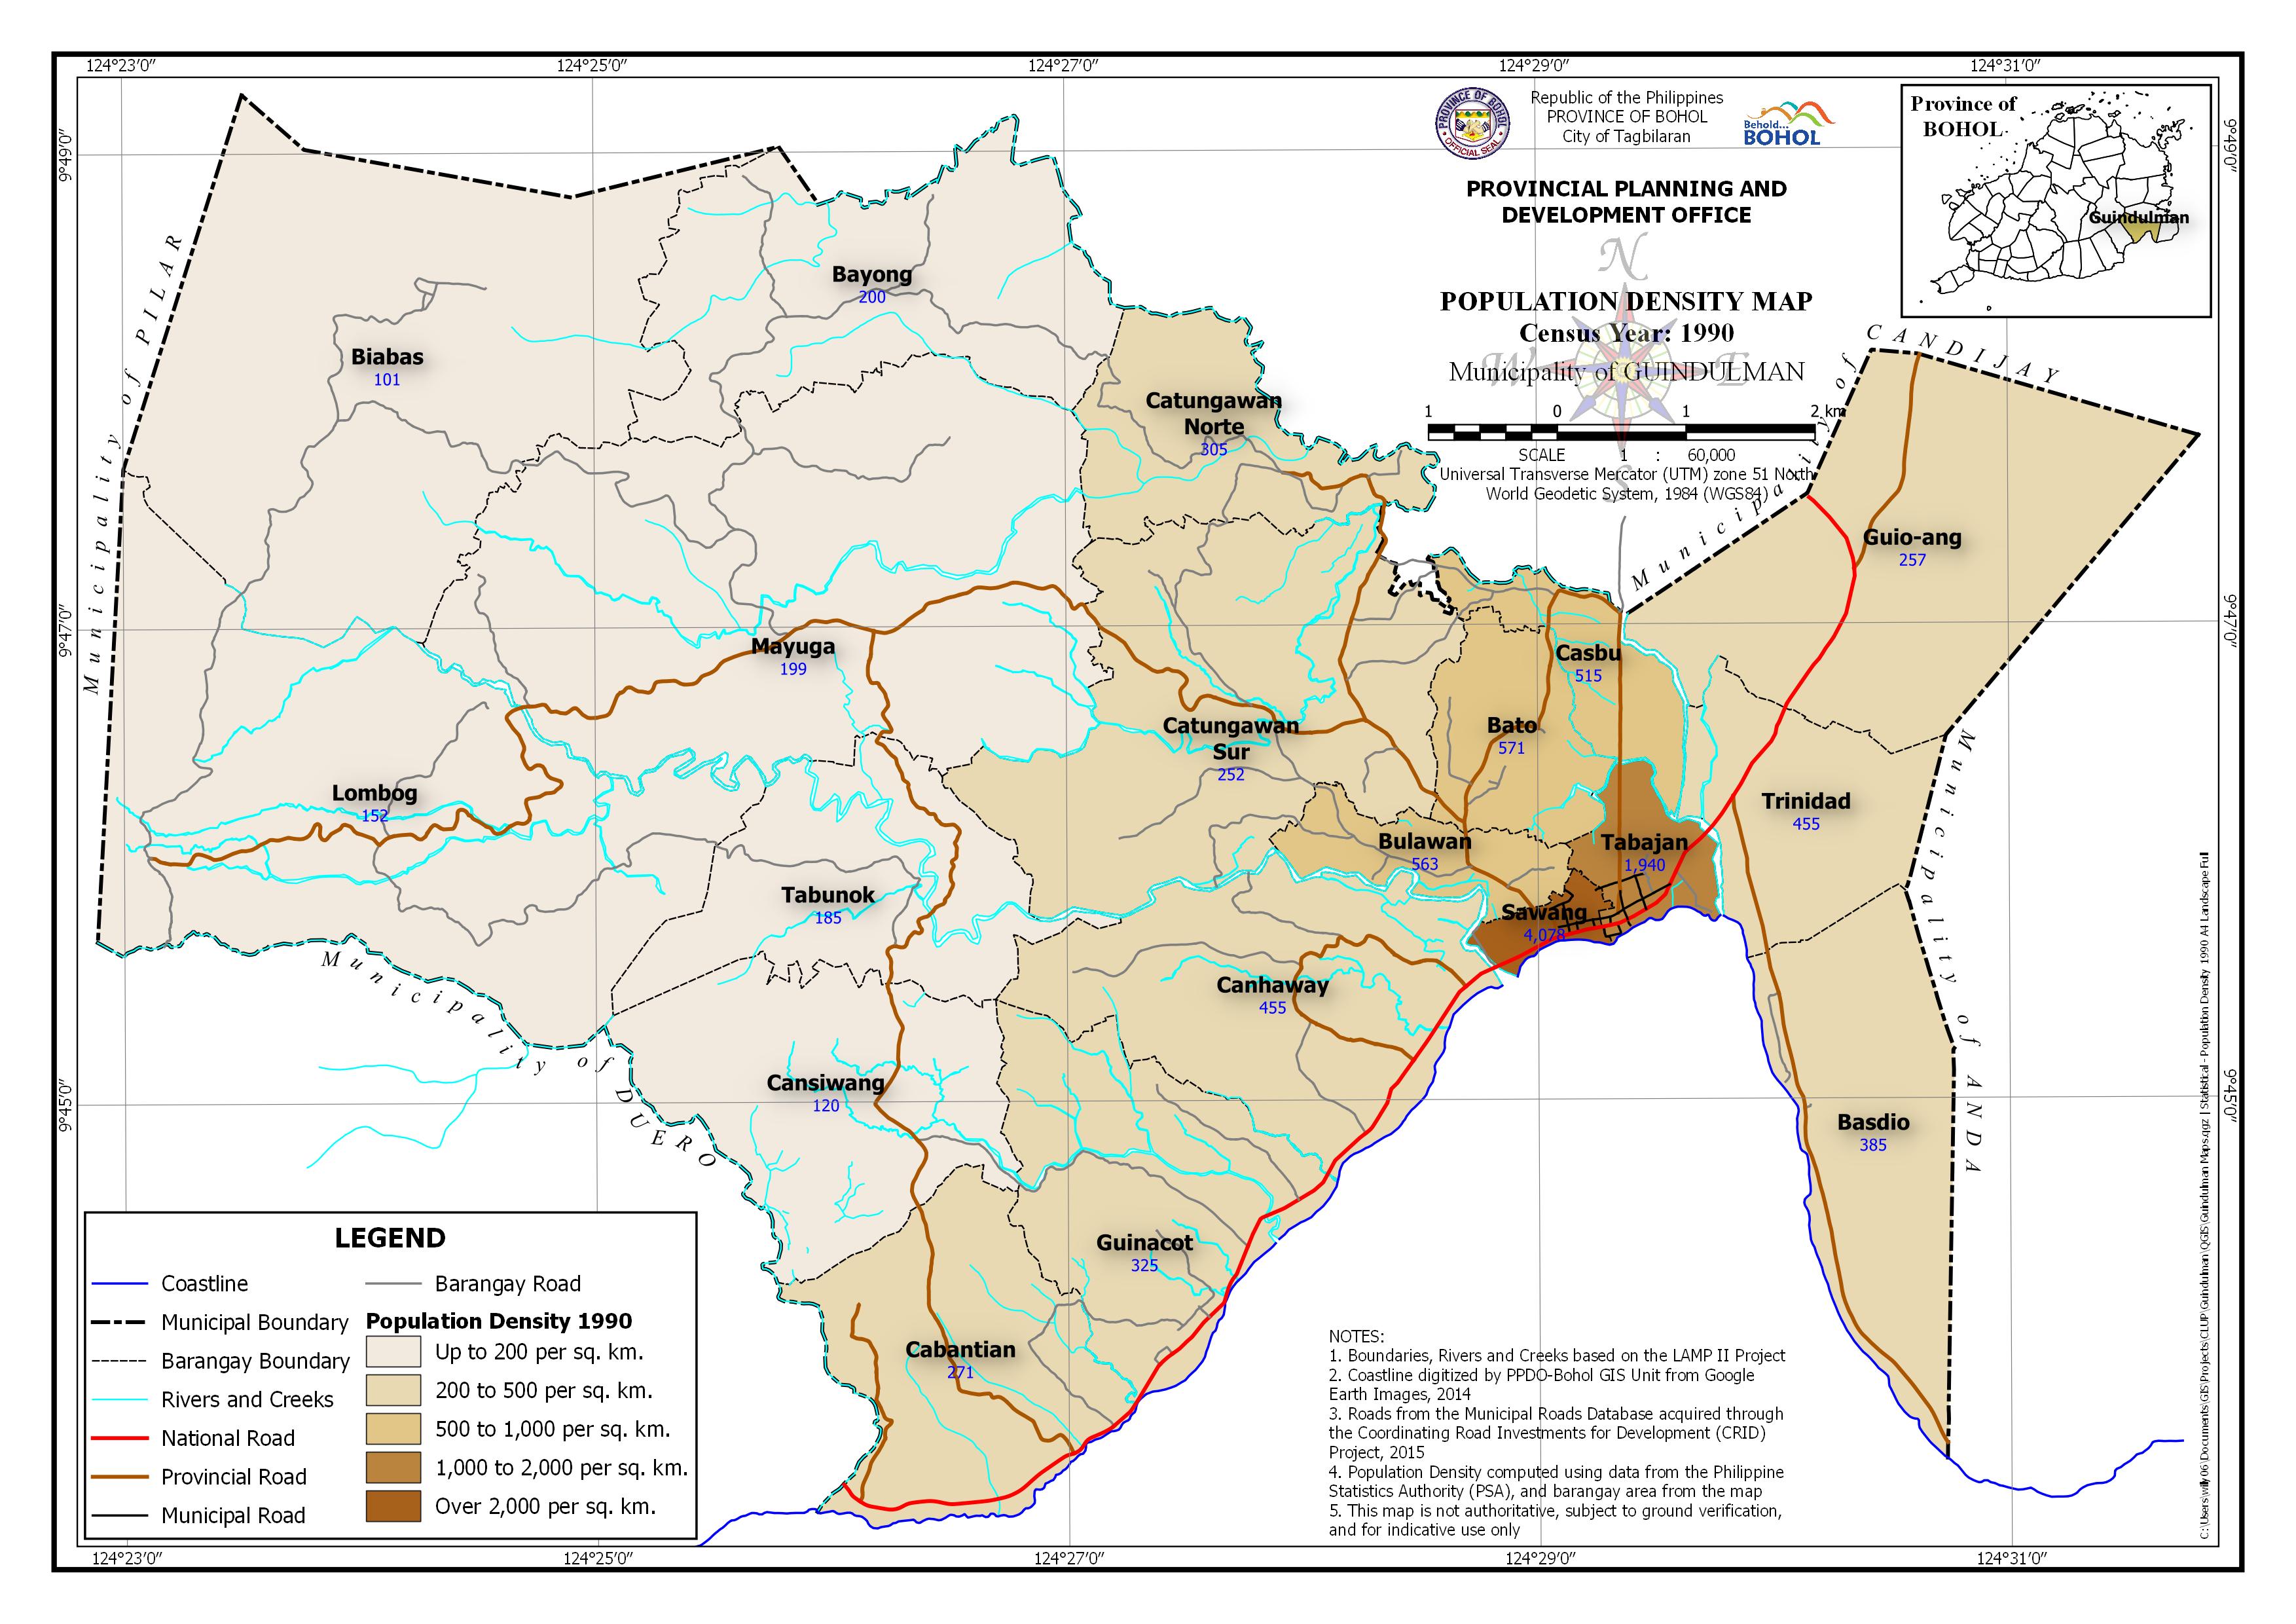
 | Census Year: 1990 Download in PDF and JPG format |
 | Census Year: 1995 Download in PDF and JPG format |
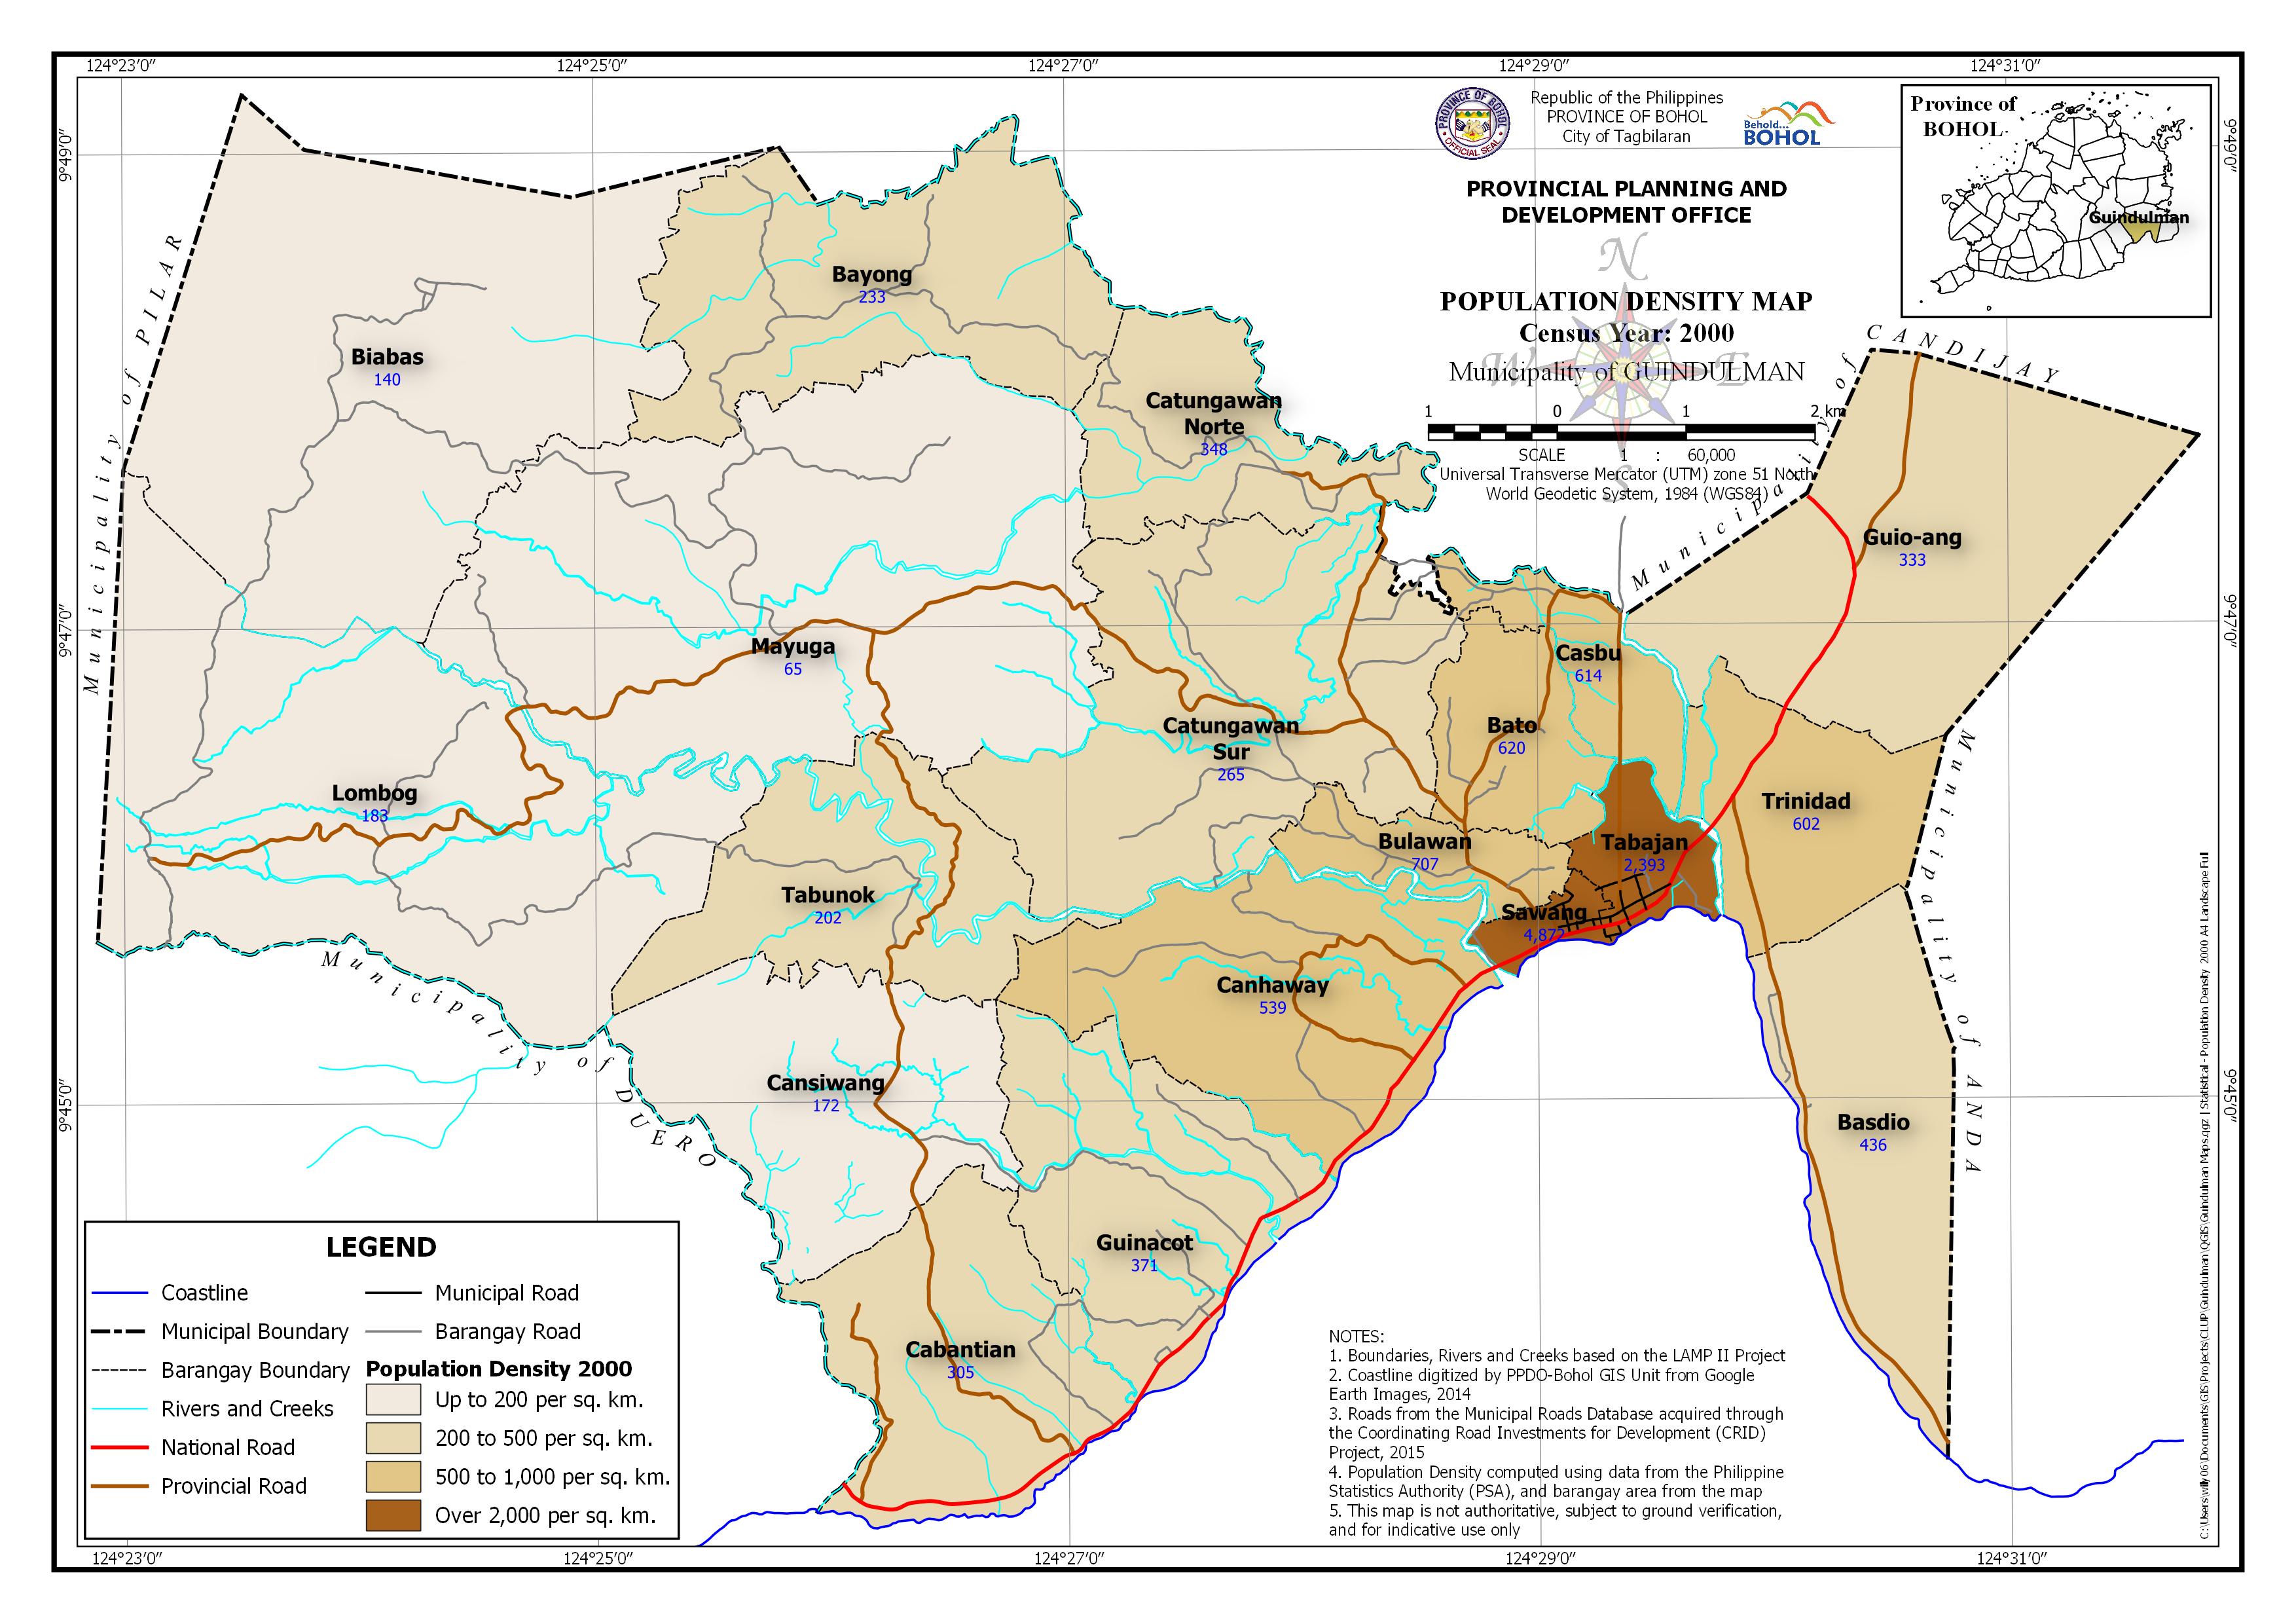 | Census Year: 2000 Download in PDF and JPG format |
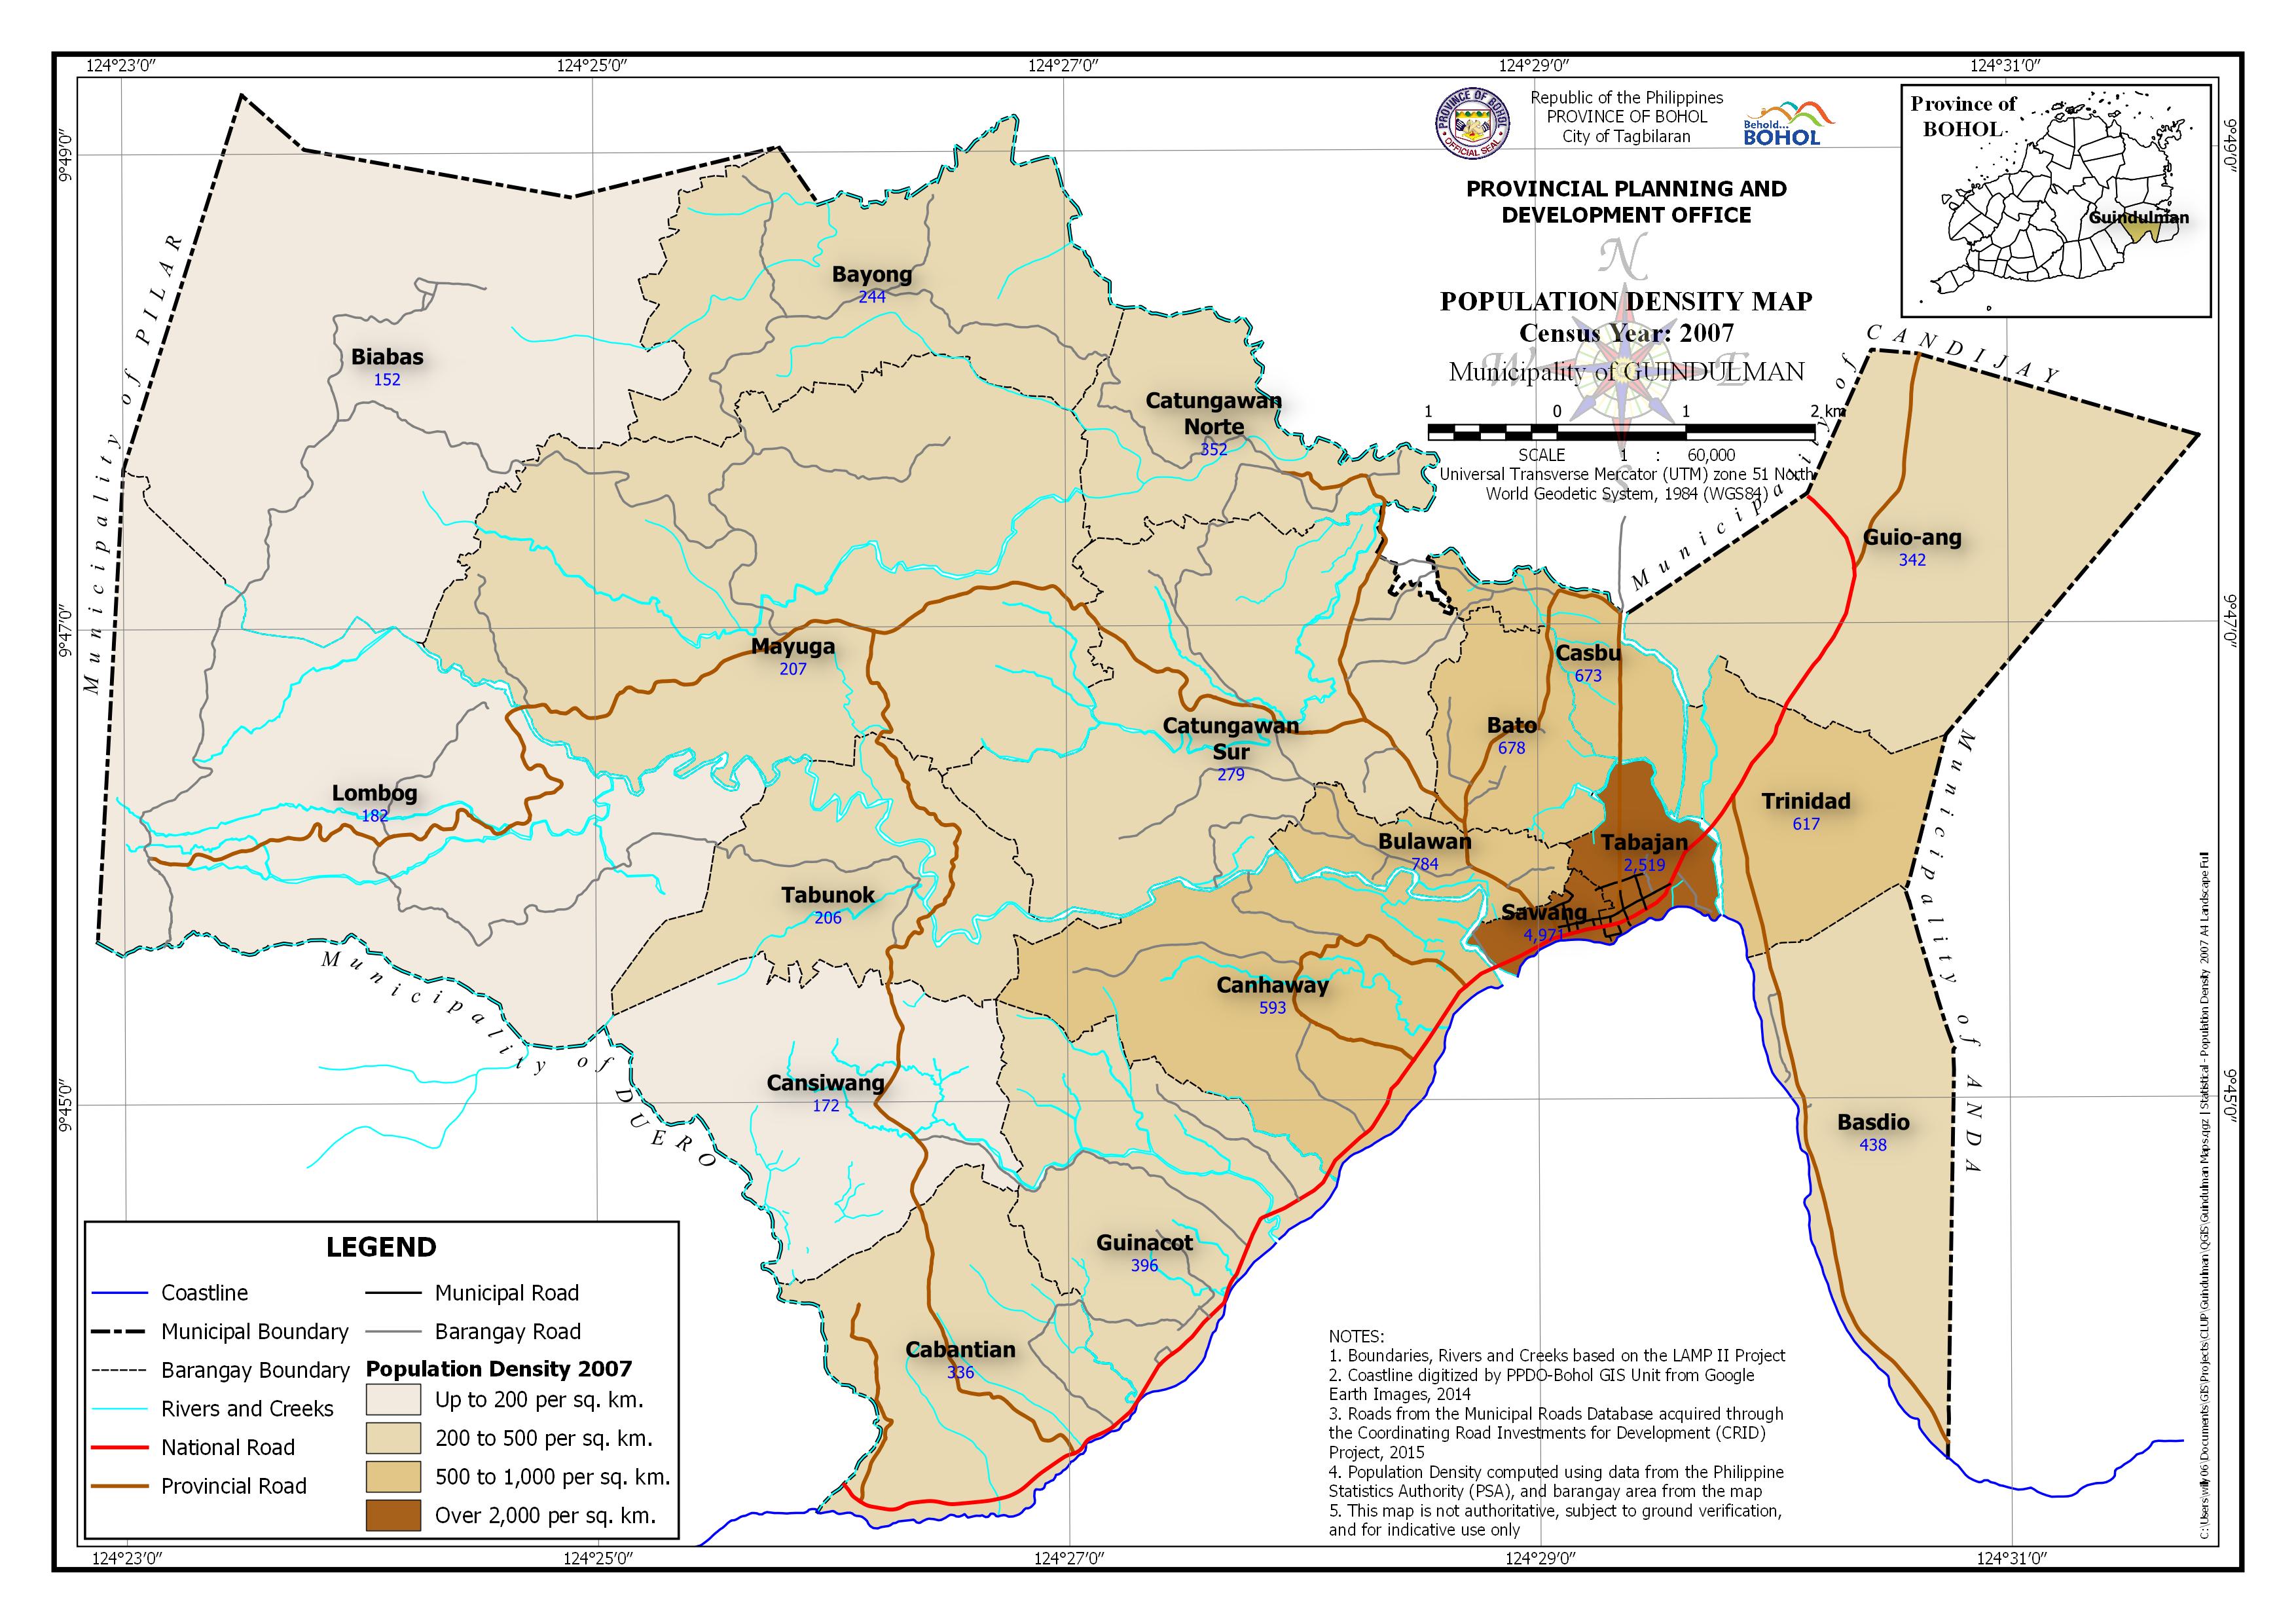 | Census Year: 2007 Download in PDF and JPG format |
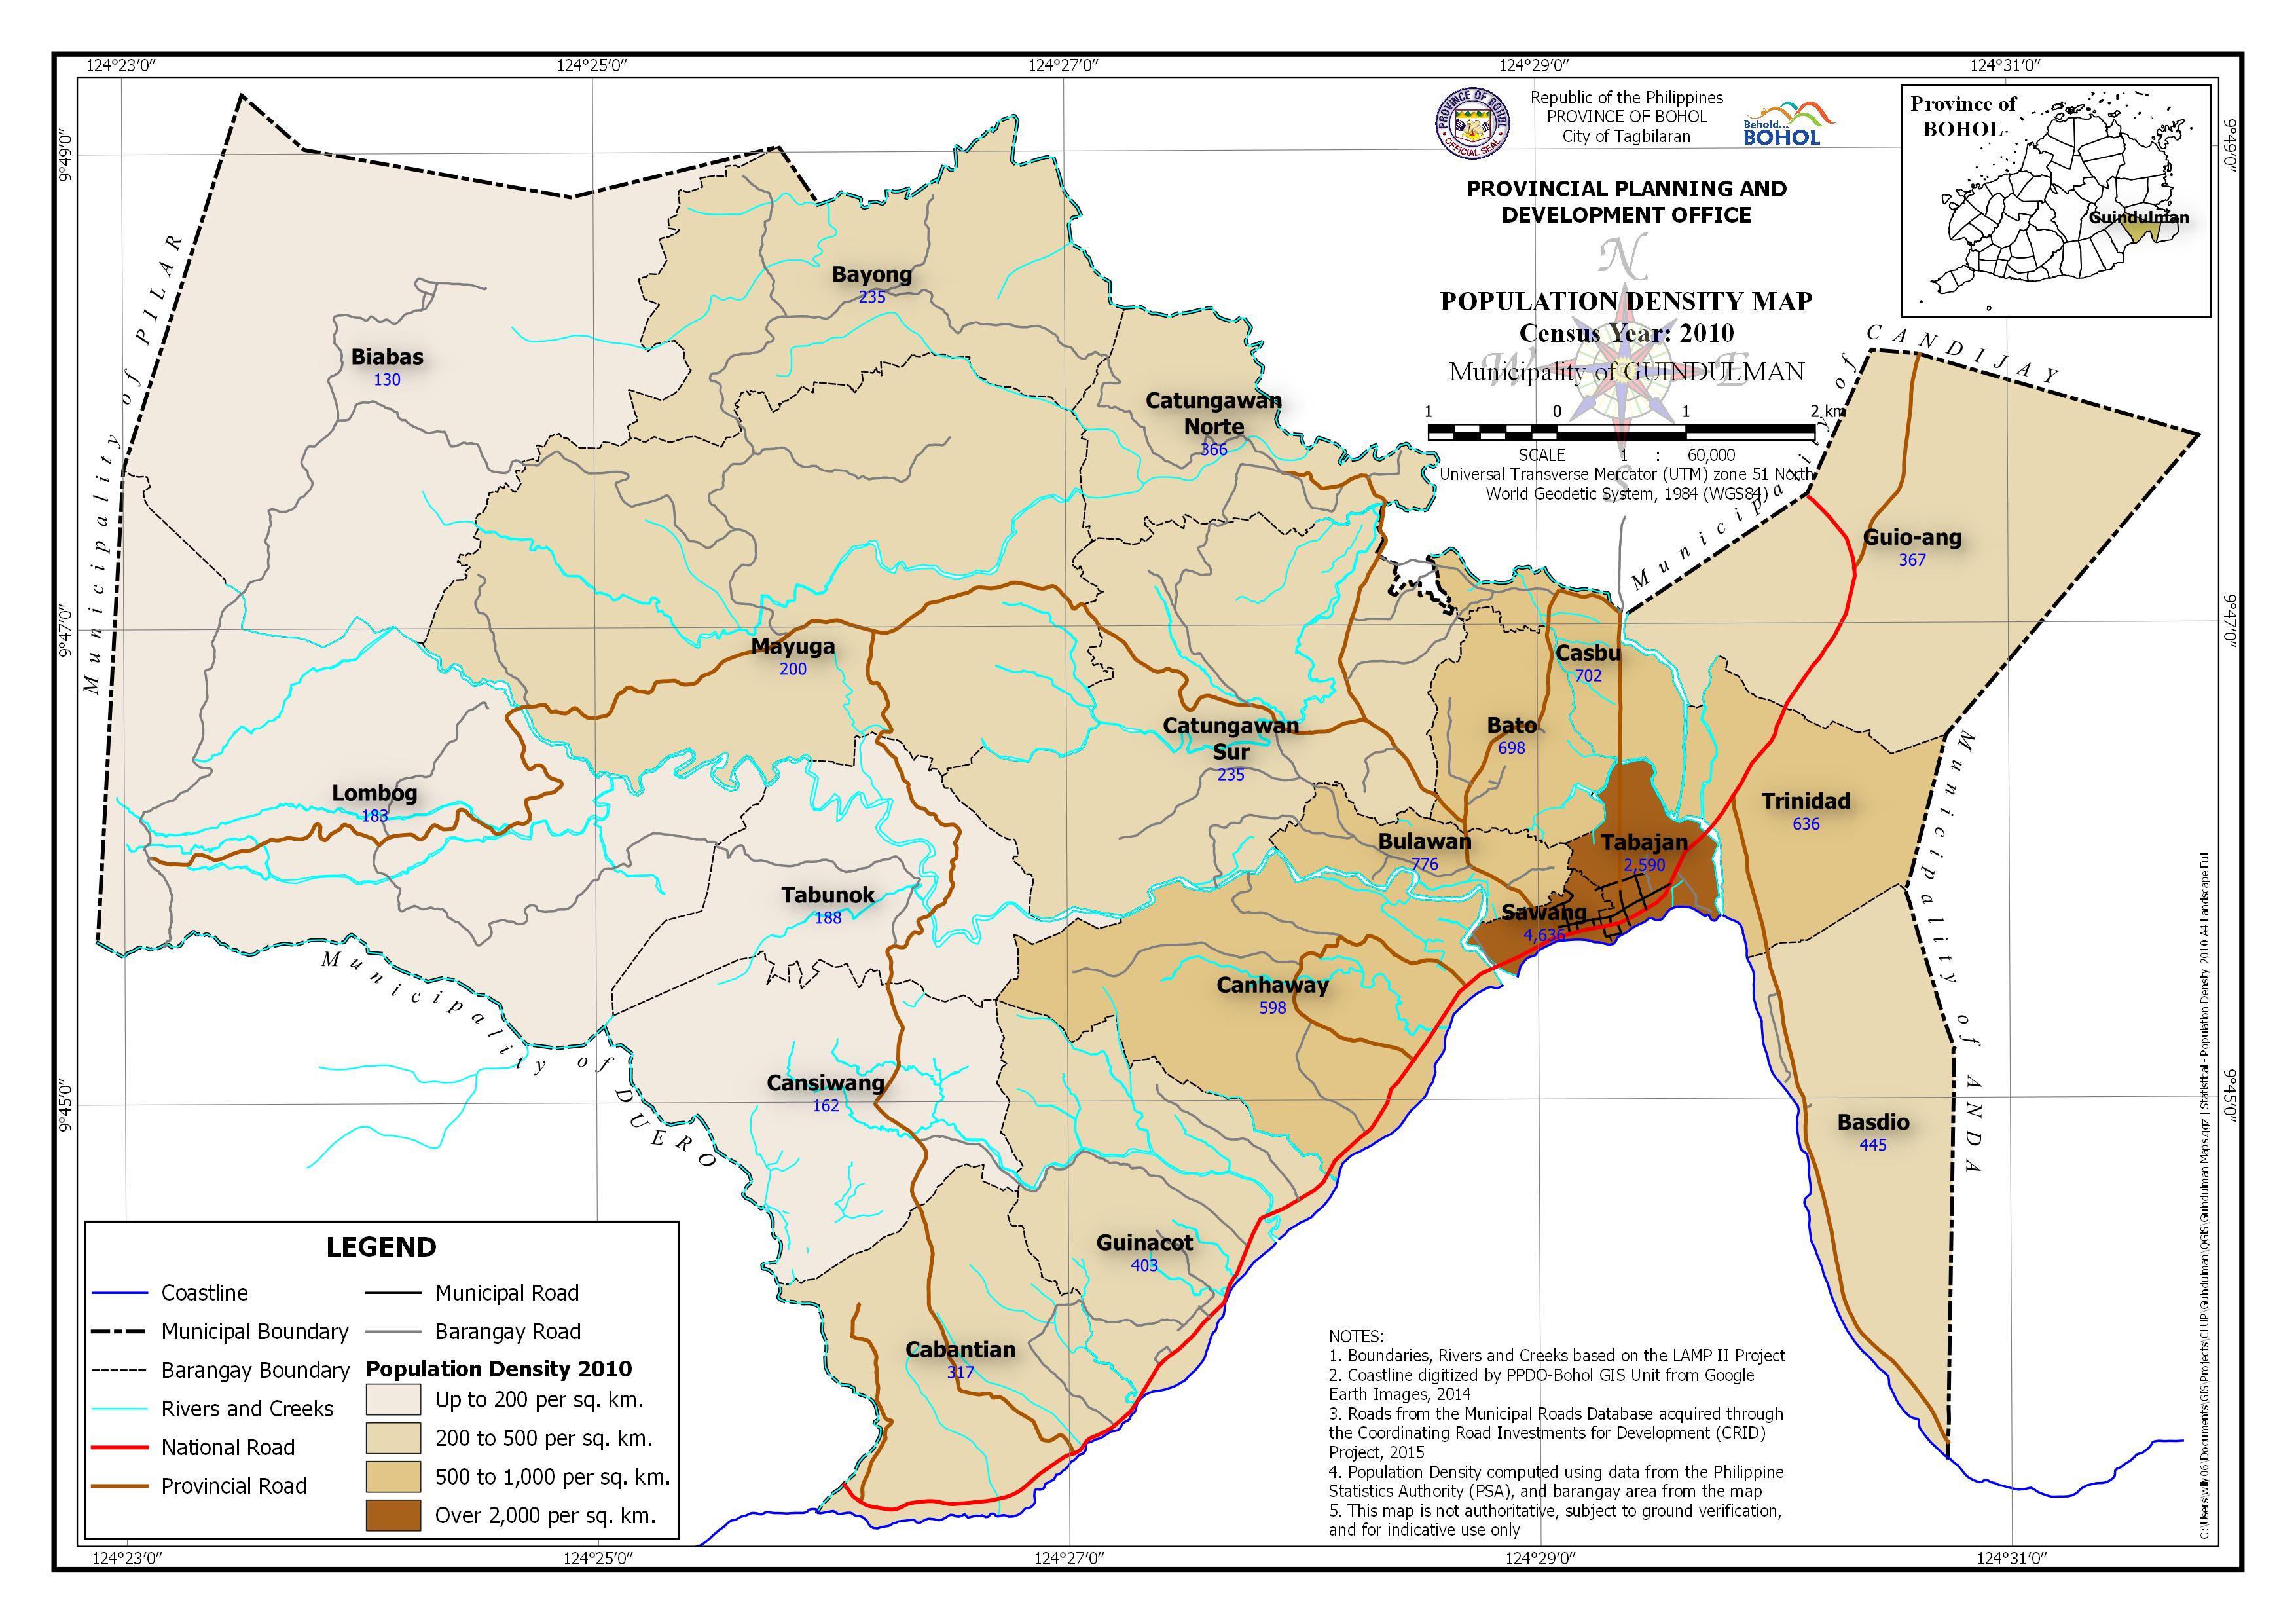 | Census Year: 2010 Download in PDF and JPG format |
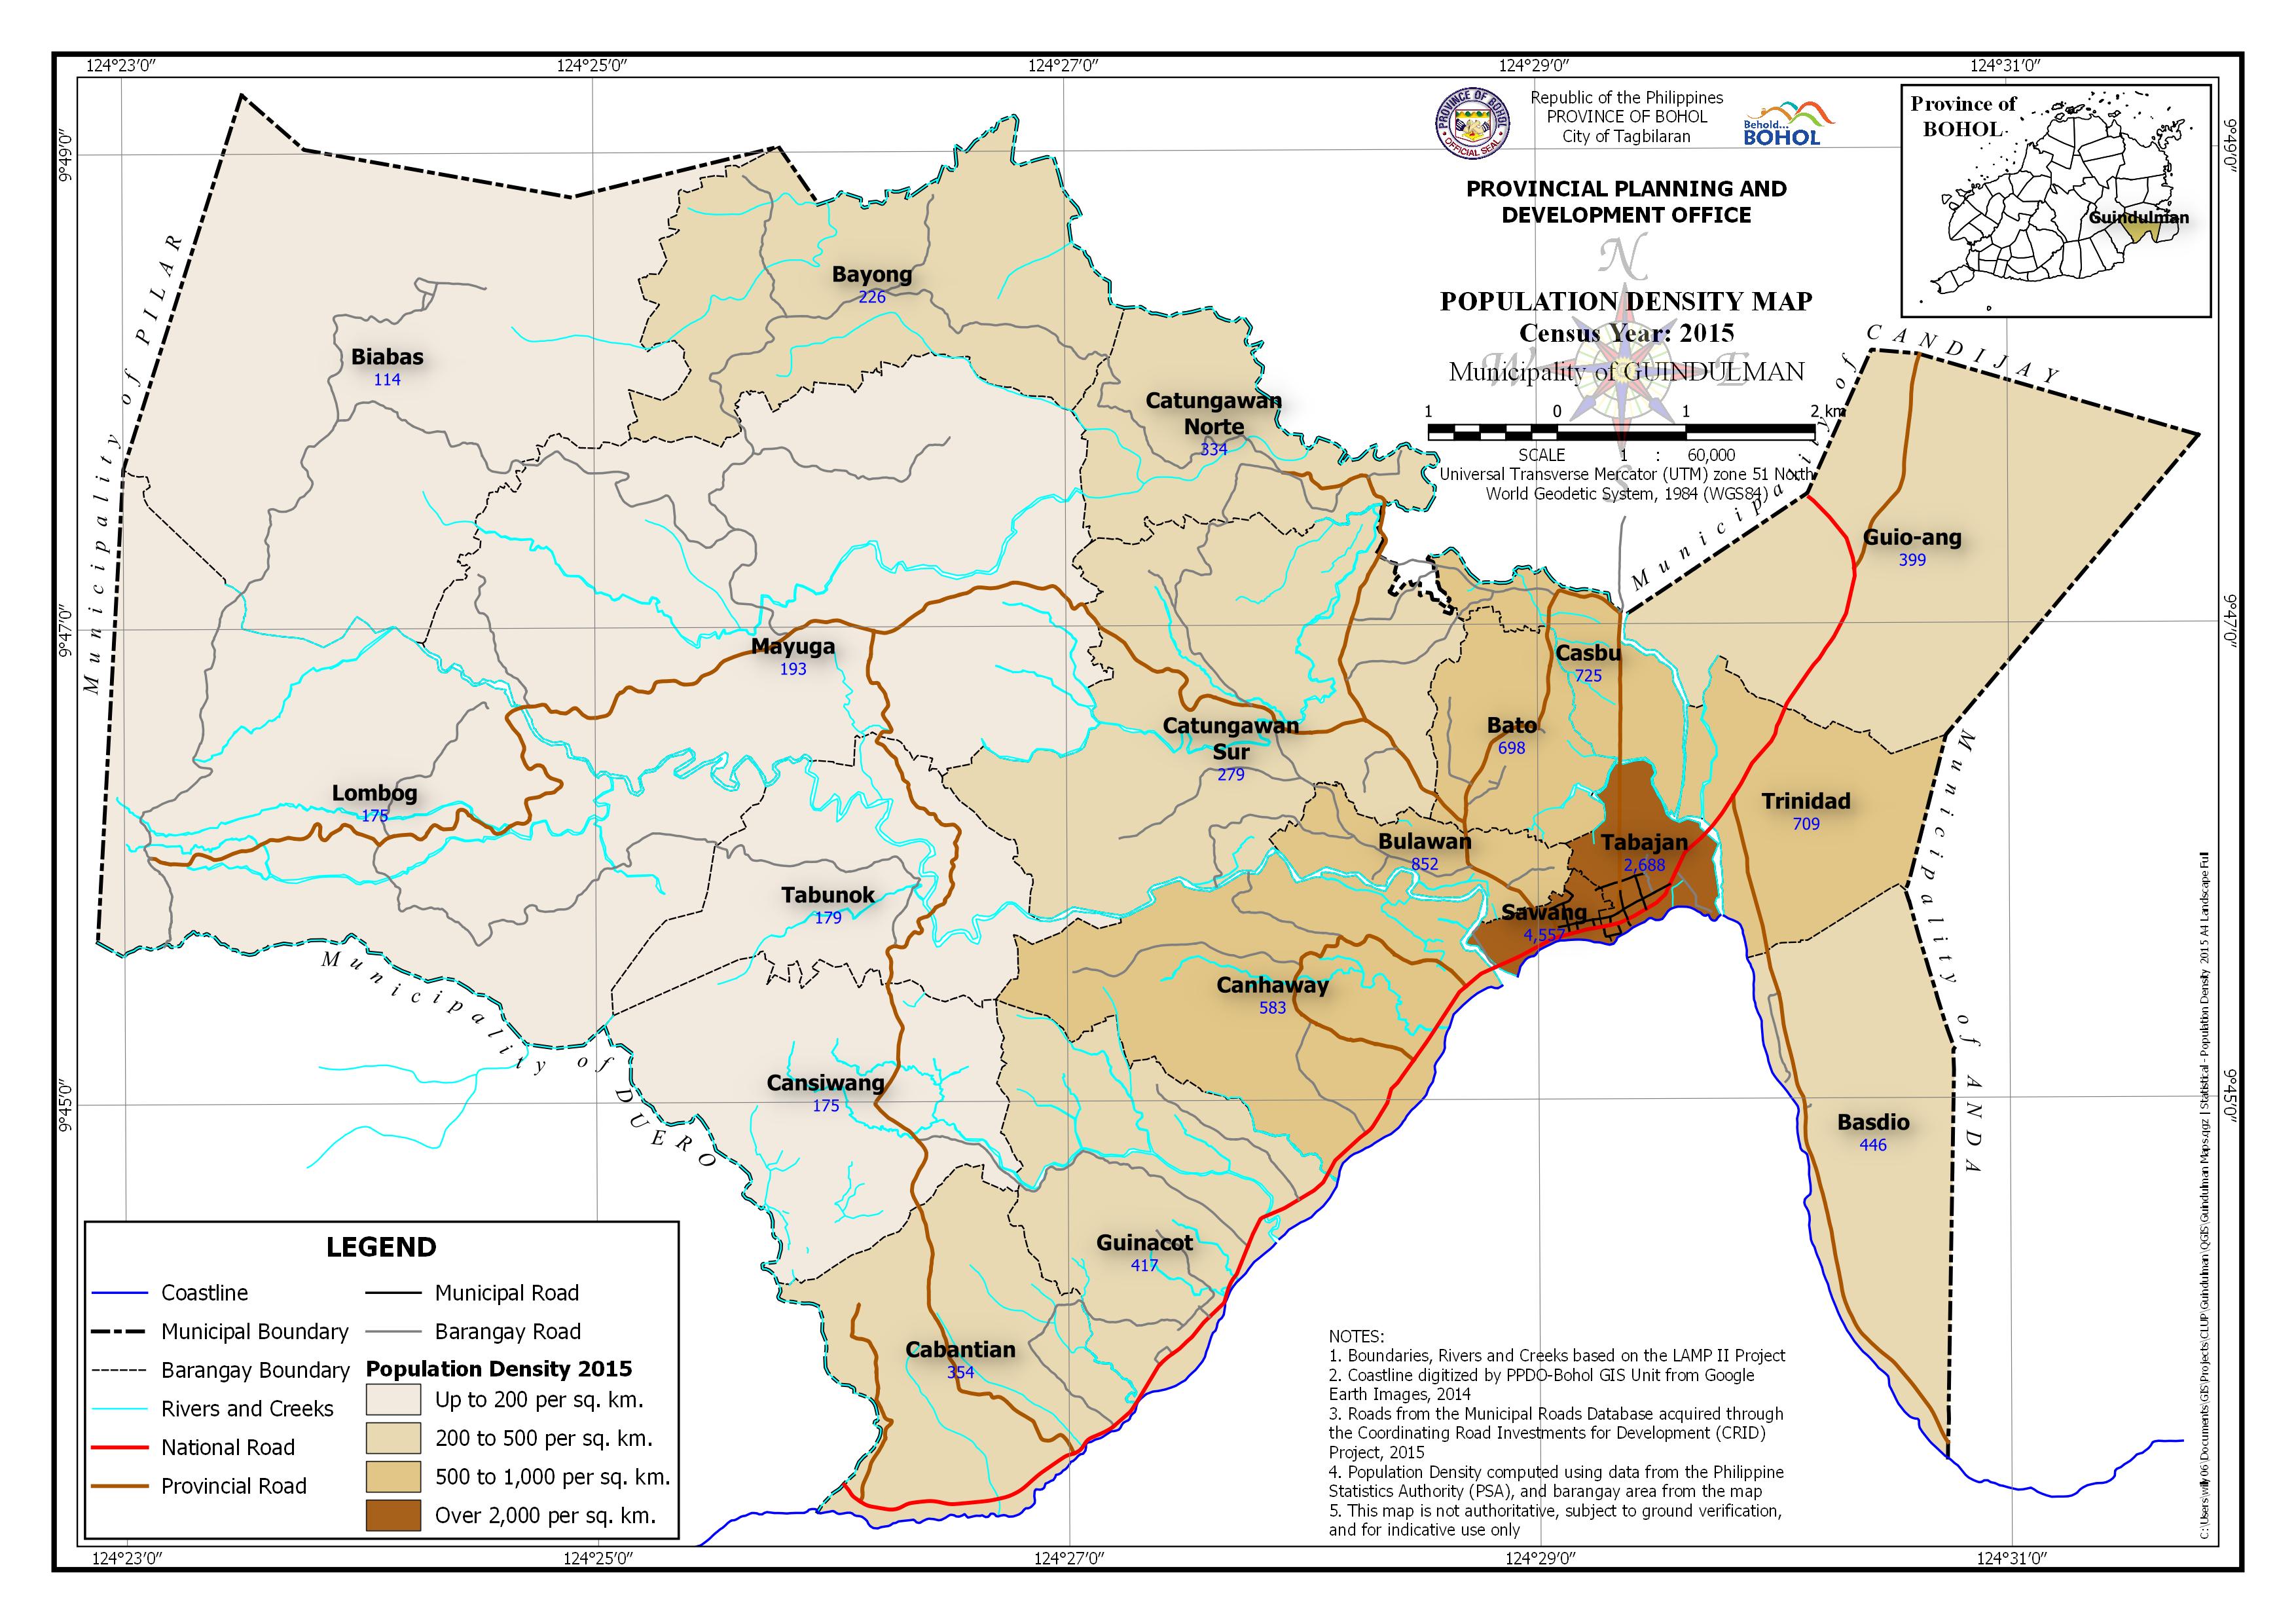 | Census Year: 2015 Download in PDF and JPG format |
| Barangay | Area (Hectares) | Population Density 1990 | Population Density 1995 | Population Density 2000 | Population Density 2007 | Population Density 2010 | Population Density 2015 |
| Basdio | 423.159 | 385 | 349 | 436 | 438 | 445 | 446 |
| Bato | 180.858 | 571 | 534 | 620 | 678 | 698 | 698 |
| Bayong | 575.094 | 200 | 209 | 233 | 244 | 235 | 226 |
| Biabas | 1,151.05 | 101 | 109 | 140 | 152 | 130 | 114 |
| Bulawan | 118.372 | 563 | 582 | 707 | 784 | 776 | 852 |
| Cabantian | 438.102 | 271 | 256 | 305 | 336 | 317 | 354 |
| Canhaway | 527.07 | 455 | 430 | 539 | 593 | 598 | 583 |
| Cansiwang | 485.754 | 120 | 124 | 172 | 172 | 162 | 175 |
| Casbu | 132.375 | 515 | 527 | 614 | 673 | 702 | 725 |
| Catungawan Norte | 292.09 | 305 | 346 | 348 | 352 | 366 | 334 |
| Catungawan Sur | 751.384 | 252 | 284 | 265 | 279 | 235 | 279 |
| Guinacot | 438.701 | 325 | 353 | 371 | 396 | 403 | 417 |
| Guio-ang | 716.046 | 257 | 273 | 333 | 342 | 367 | 399 |
| Lombog | 1,119.95 | 152 | 163 | 183 | 182 | 183 | 175 |
| Mayuga | 1,266.42 | 199 | 179 | 65 | 207 | 200 | 193 |
| Sawang | 40.313 | 4,078 | 4,232 | 4,872 | 4,971 | 4,636 | 4,557 |
| Tabajan | 94.106 | 1,940 | 2,172 | 2,393 | 2,519 | 2,590 | 2,688 |
| Tabunok | 398.162 | 185 | 178 | 202 | 206 | 188 | 179 |
| Trinidad | 277.31 | 455 | 529 | 602 | 617 | 636 | 709 |
| TOTAL | 9,426.31 | 11,329 | 11,829 | 13,401 | 14,141 | 13,865 | 14,102 |