
Download in PDF and JPG format
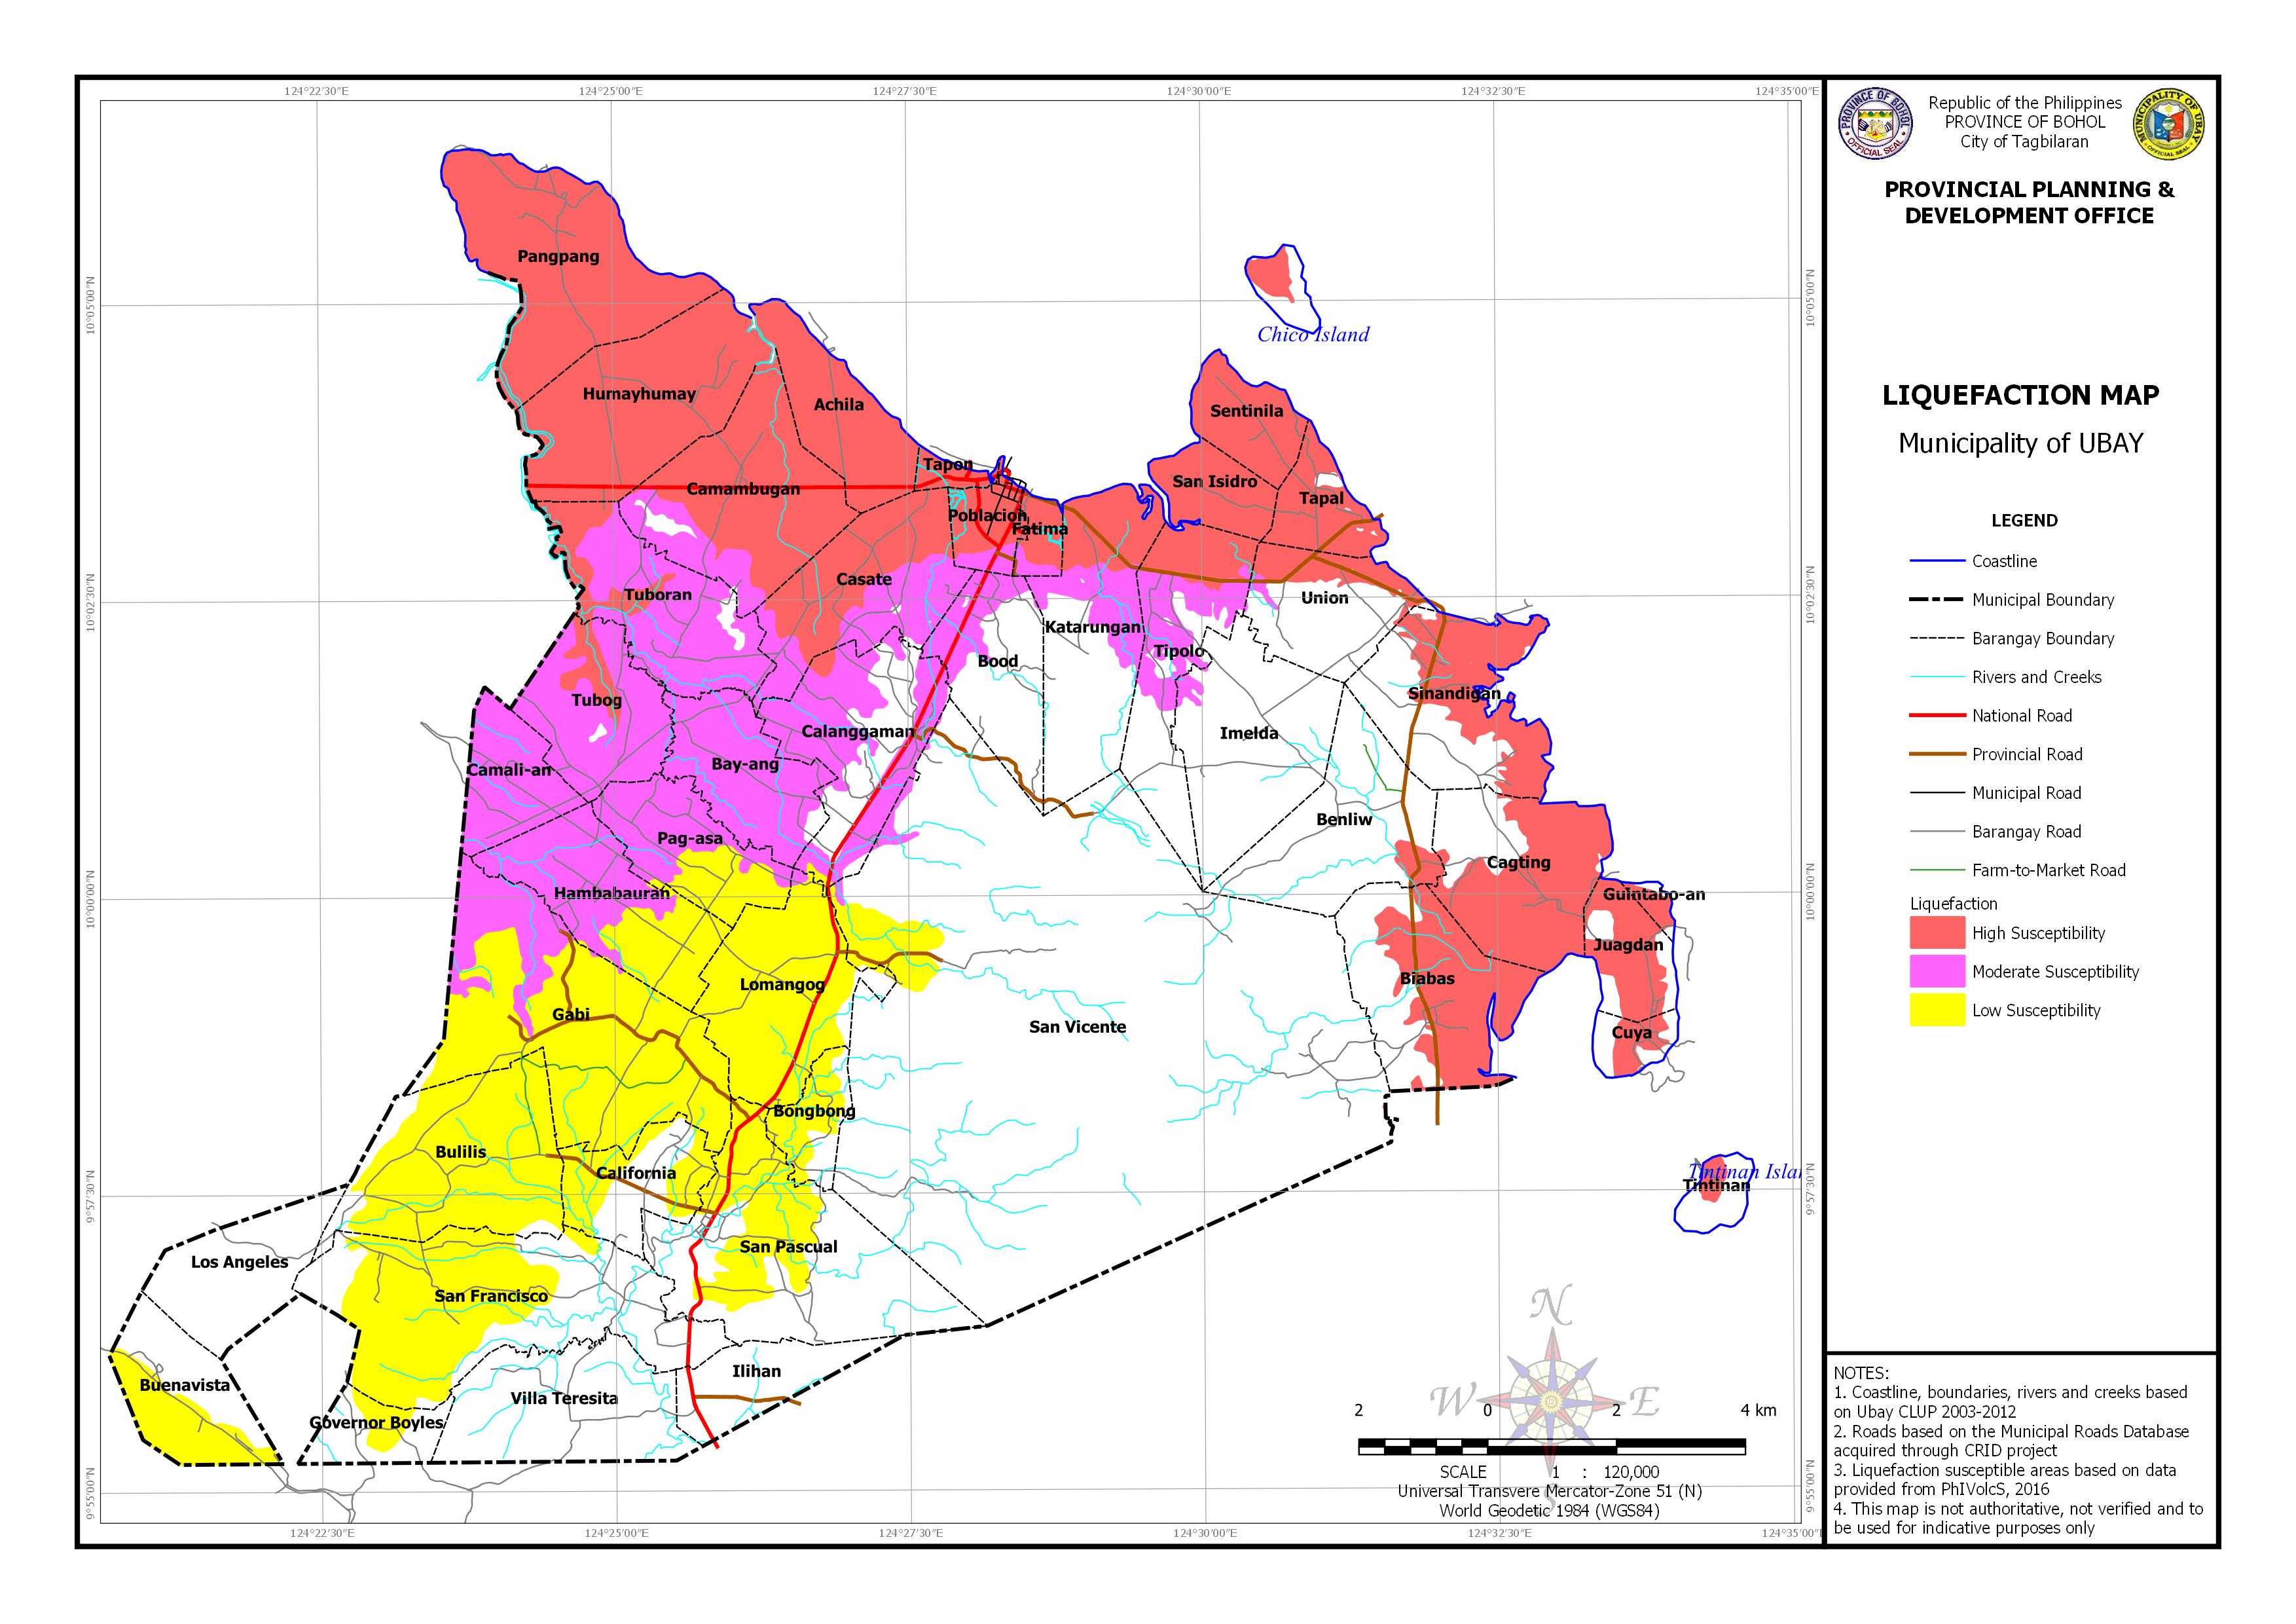
AREA EXPOSED TO LIQUEFACTION BY BARANGAY
| Barangay | Area | Area Exposed to High Susceptibility | Area Exposed to Low Susceptibility | Area Exposed to Moderate Susceptibility | |||
| (Hectares) | (Hectares) | Percentage | (Hectares) | Percentage | (Hectares) | Percentage | |
| Achila | 368.967 | 368.967 | 100.00% | ||||
| Bay-ang | 415.145 | 400.936 | 96.58% | ||||
| Benliw | 601.747 | 34.820 | 5.79% | ||||
| Biabas | 651.773 | 392.336 | 60.20% | ||||
| Bongbong | 171.884 | 115.454 | 67.17% | ||||
| Bood | 416.584 | 114.906 | 27.58% | ||||
| Buenavista | 387.243 | 186.377 | 48.13% | ||||
| Bulilis | 748.311 | 662.912 | 88.59% | ||||
| Cagting | 599.799 | 440.432 | 73.43% | ||||
| Calanggaman | 626.032 | 13.127 | 7.700 | 384.872 | 61.48% | ||
| California | 326.555 | 166.847 | 51.09% | ||||
| Camali-an | 276.417 | 276.417 | 100.00% | ||||
| Camambugan | 719.742 | 566.983 | 78.78% | 130.234 | 18.10% | ||
| Casate | 583.765 | 341.034 | 58.42% | 235.841 | 40.40% | ||
| Cuya | 104.240 | 47.501 | 45.57% | ||||
| Fatima | 79.998 | 63.961 | 79.95% | 16.037 | 20.05% | ||
| Gabi | 1157.012 | 929.285 | 80.32% | 216.655 | 18.73% | ||
| Governor Boyles | 187.582 | 44.563 | 23.76% | ||||
| Guintabo-an | 34.340 | 24.950 | 72.66% | ||||
| Hambabauran | 529.788 | 211.352 | 39.89% | 318.377 | 60.10% | ||
| Humayhumay | 739.160 | 739.160 | 100.00% | ||||
| Ilihan | 276.900 | ||||||
| Imelda | 665.930 | 12.554 | |||||
| Juagdan | 229.230 | 162.831 | 71.03% | ||||
| Katarungan | 662.961 | 171.192 | 25.82% | 133.089 | 20.08% | ||
| Lomangog | 619.483 | 581.313 | 93.84% | 4.522 | |||
| Los Angeles | 402.969 | ||||||
| Pag-asa | 384.338 | 143.715 | 37.39% | 240.891 | 62.68% | ||
| Pangpang | 802.227 | 802.227 | 100.00% | ||||
| Poblacion | 146.363 | 117.583 | 80.34% | 28.779 | 19.66% | ||
| San Francisco | 1124.516 | 610.545 | 54.29% | ||||
| San Isidro | 196.710 | 196.543 | 99.92% | ||||
| San Pascual | 995.168 | 342.119 | 34.38% | ||||
| San Vicente | 5232.845 | 0.169 | 137.515 | 22.517 | |||
| Sentinila | 223.647 | 223.523 | 99.95% | ||||
| Sinandigan | 618.453 | 322.621 | 52.17% | ||||
| Tapal | 204.493 | 192.069 | 93.93% | ||||
| Tapon | 48.963 | 48.963 | 100.00% | ||||
| Tintinan | 101.455 | 20.836 | 20.54% | ||||
| Tipolo | 530.348 | 124.959 | 23.56% | 162.144 | 30.57% | ||
| Tubog | 451.619 | 72.622 | 16.08% | 373.778 | 82.76% | ||
| Tuboran | 559.370 | 125.340 | 22.41% | 413.144 | 73.86% | ||
| Union | 402.419 | 111.384 | 27.68% | 8.584 | |||
| Villa Teresita | 611.564 | 0.005 | |||||
| Total | 25218.055 | 5726.133 | 1508.19% | 4139.701 | 618.85% | 3494.278 | 732.61% |