
Download in PDF and JPG format
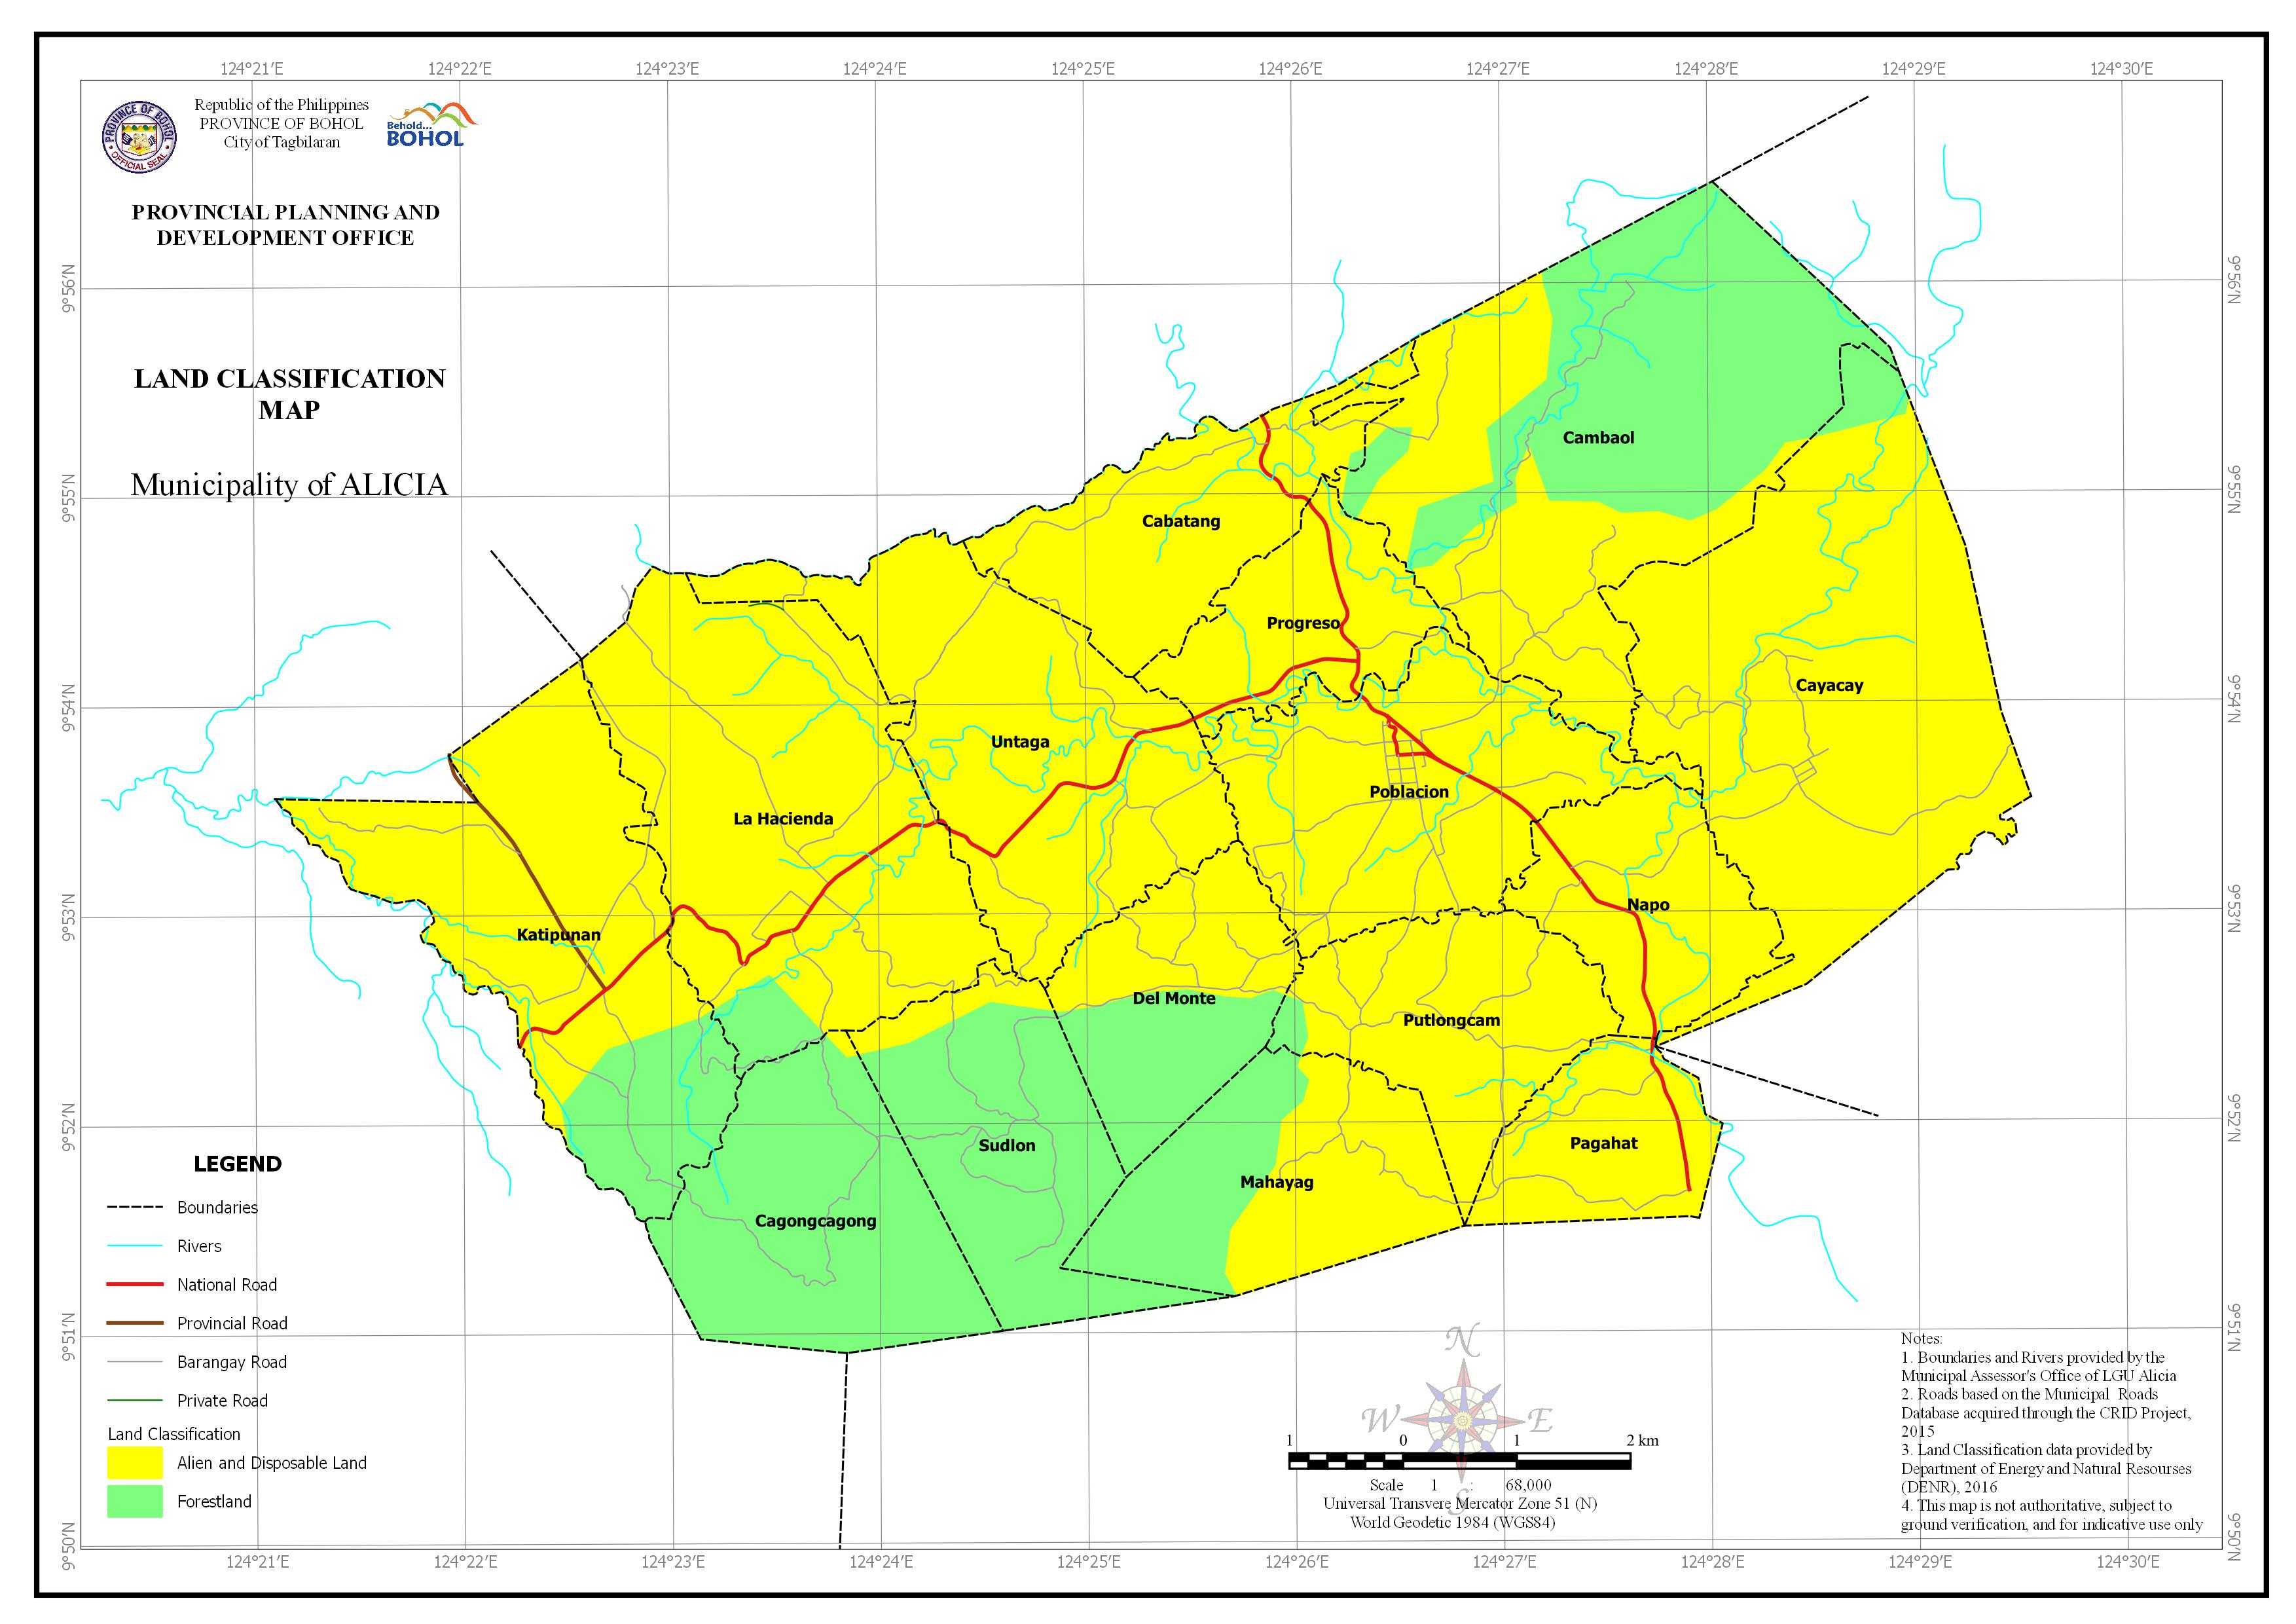
AREA PER LAND CLASSIFICATION BY BARANGAY
| Barangay | Area | Alienable and Disposable Land | Forestland | ||
| (Hectares) | (Hectares) | (Percentage) | (Hectares) | (Percentage) | |
| Cabatang | 425.212 | 422.842 | 99.44% | 2.371 | 0.56% |
| Cagongcagong | 539.183 | 3.33 | 0.62% | 535.853 | 99.38% |
| Cambaol | 1,212.39 | 523.586 | 43.19% | 688.807 | 56.81% |
| Cayacay | 1,146.16 | 1,109.44 | 96.80% | 36.723 | 3.20% |
| Del Monte | 372.367 | 190.163 | 51.07% | 182.204 | 48.93% |
| Katipunan | 823.27 | 638.478 | 77.55% | 184.793 | 22.45% |
| La Hacienda | 967.4 | 919.686 | 95.07% | 47.714 | 4.93% |
| Mahayag | 479.164 | 261.475 | 54.57% | 217.689 | 45.43% |
| Napo | 335.262 | 335.262 | 100.00% | ||
| Pagahat | 260.509 | 260.509 | 100.00% | ||
| Poblacion | 626.04 | 626.04 | 100.00% | ||
| Progreso | 295.251 | 294.458 | 99.73% | 0.793 | 0.27% |
| Putlongcam | 415.066 | 401.576 | 96.75% | 13.489 | 3.25% |
| Sudlon | 468.629 | 45.254 | 9.66% | 423.375 | 90.34% |
| Untaga | 763.01 | 763.01 | 100.00% | ||
| Total | 9,128.92 | 6,795.11 | 74.44% | 2,333.81 | 25.57% |
good morning! how much is the total agricultural land of Alicia,bohol tnx! PPDO
Hi Danilo, we can’t find records of any official agricultural area of the Municipality of Alicia. You might want to refer your concern to the their Municipal Agricultural Officer.