
Download in PDF and JPG format
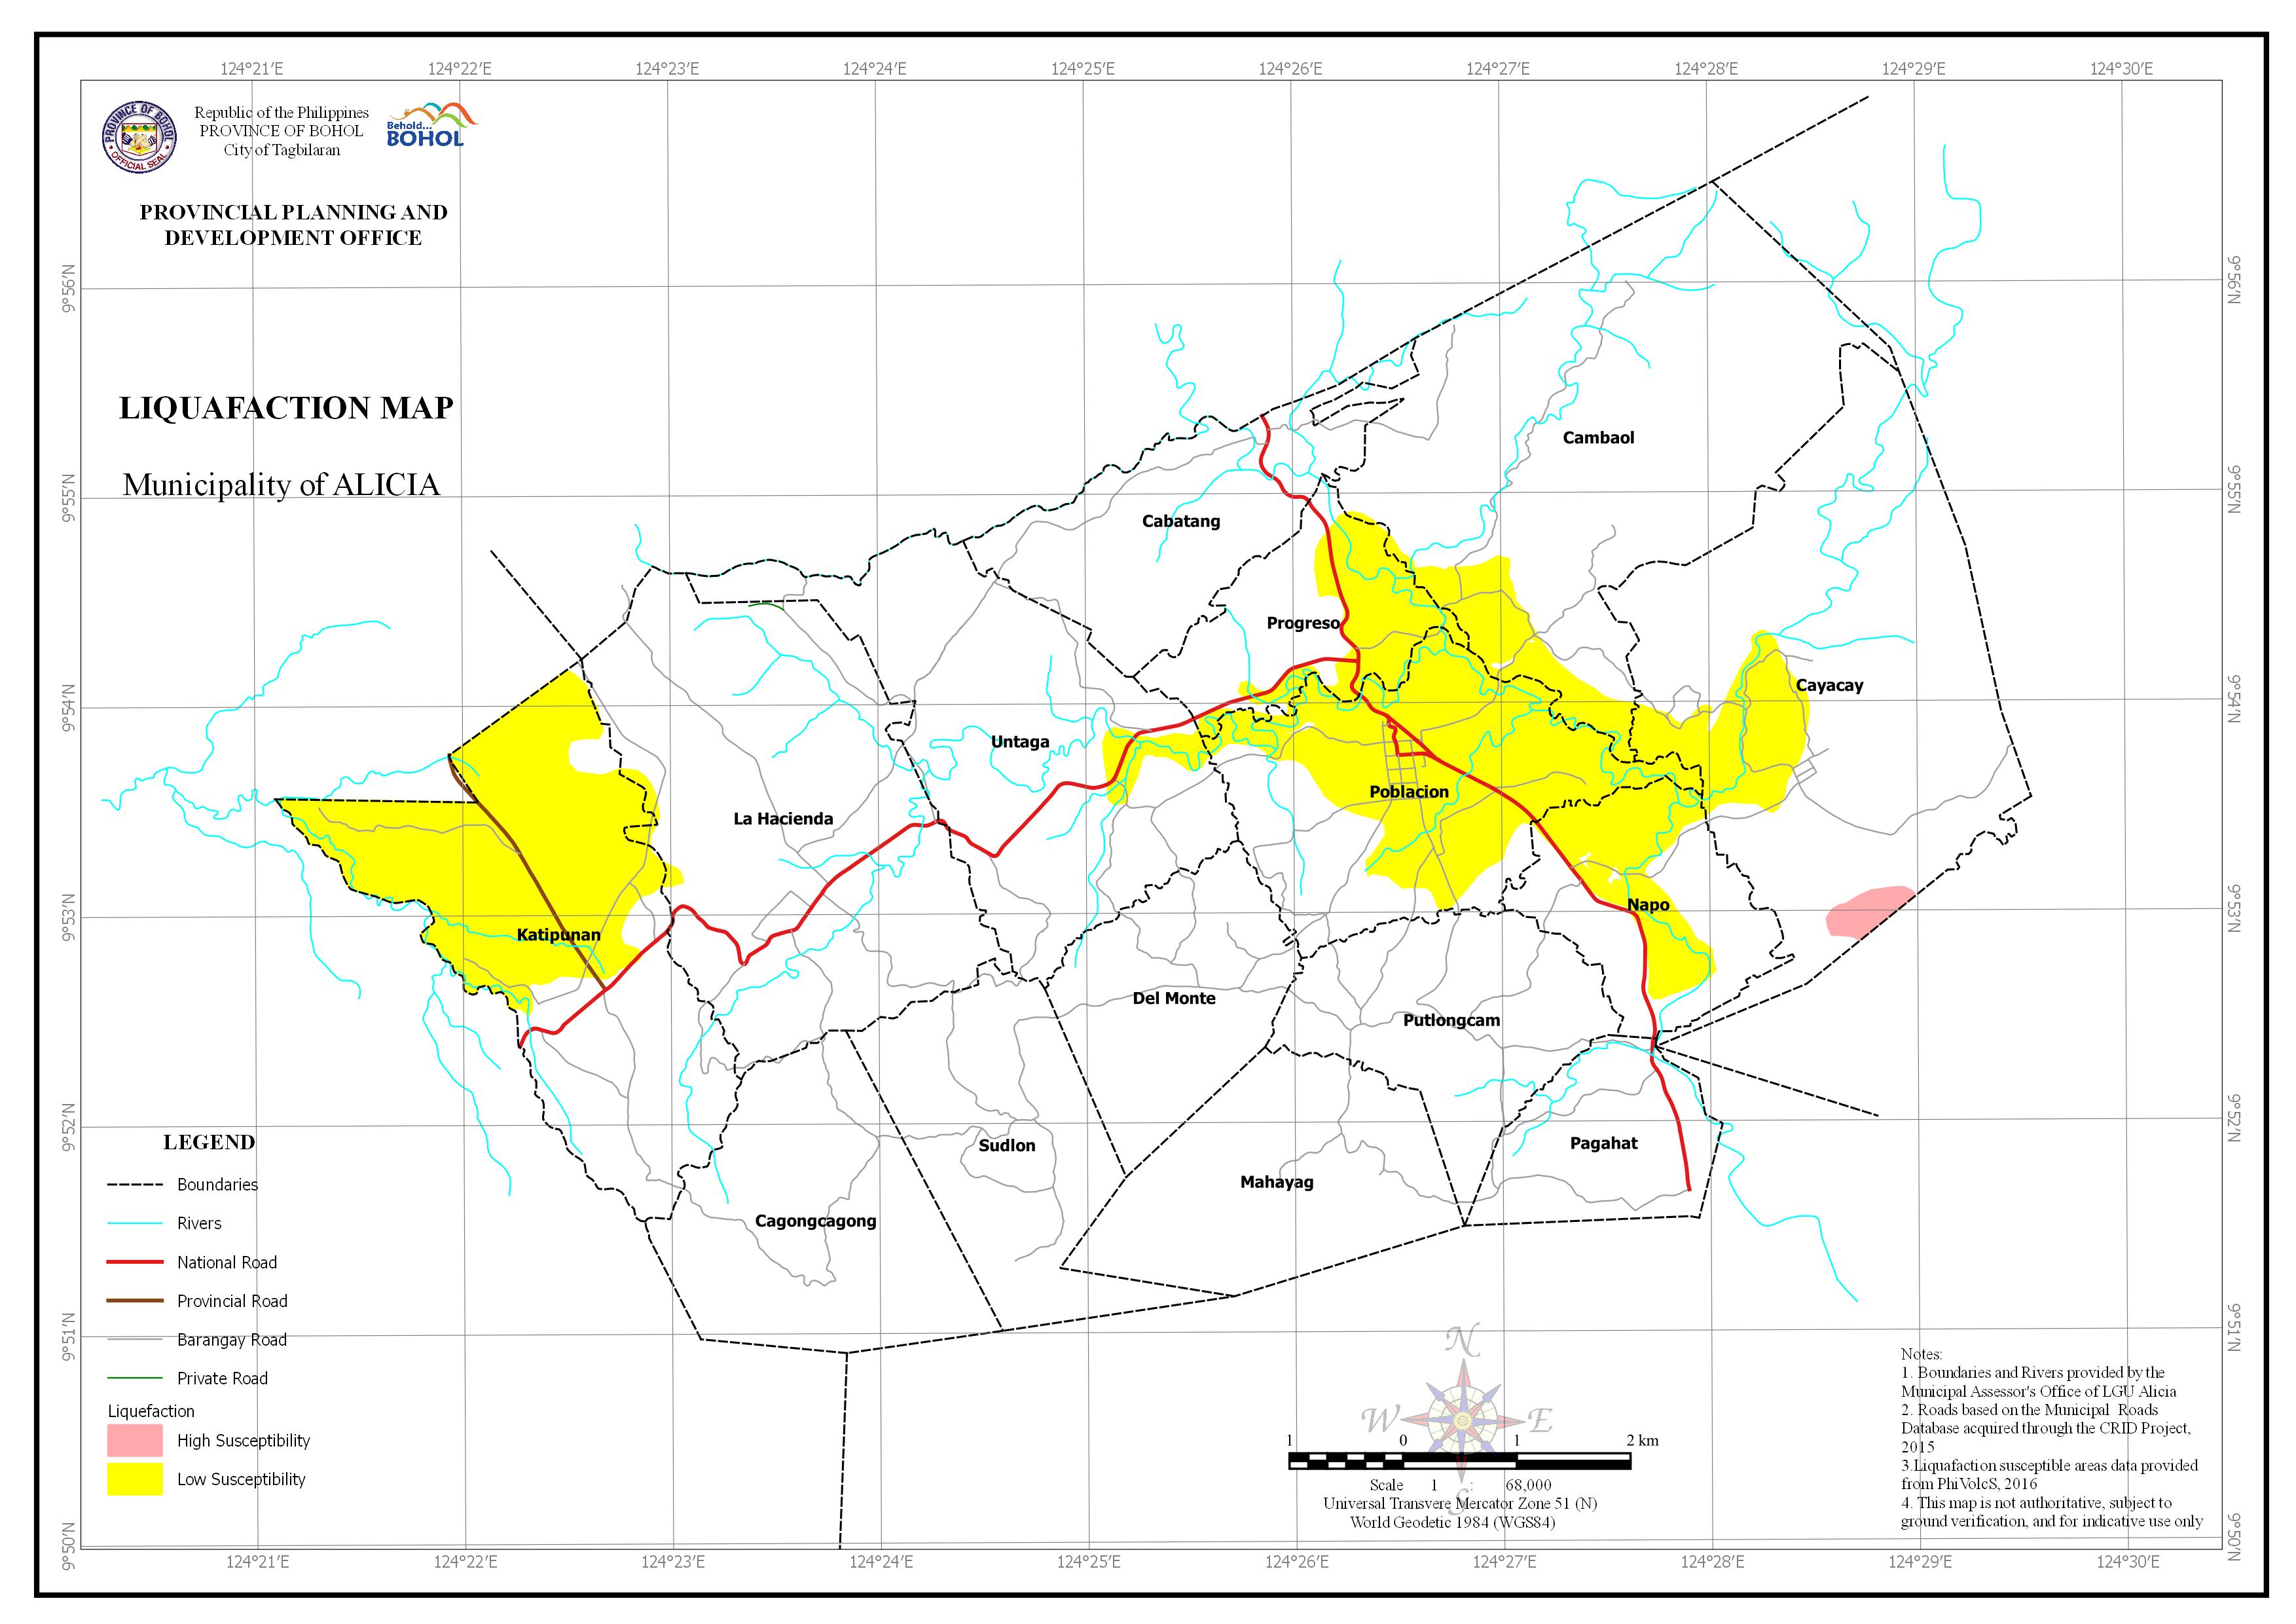
AREA EXPOSED TO LIQUEFACTION BY BARANGAY
| Barangay | Area | Area Exposed to High Susceptibility | Area Exposed to Low Susceptibility | Area Not Exposed | |||
| (Hectares) | (Hectares) | Percentage | (Hectares) | Percentage | (Hectares) | Percentage | |
| Cabatang | 425.212 | 425.212 | 100.00% | ||||
| Cagongcagong | 539.183 | 539.183 | 100.00% | ||||
| Cambaol | 1,212.39 | 102.363 | 8.44% | 1,110.03 | 91.56% | ||
| Cayacay | 1,146.16 | 20.073 | 1.75% | 125.64 | 10.96% | 1,000.45 | 87.29% |
| Del Monte | 372.367 | 372.367 | 100.00% | ||||
| Katipunan | 823.27 | 483.464 | 58.73% | 339.806 | 41.28% | ||
| La Hacienda | 967.4 | 10.757 | 1.11% | 956.643 | 98.89% | ||
| Mahayag | 479.164 | 479.164 | 100.00% | ||||
| Napo | 335.262 | 130.893 | 39.04% | 204.369 | 60.96% | ||
| Pagahat | 260.509 | 260.509 | 100.00% | ||||
| Poblacion | 626.04 | 419.478 | 67.01% | 206.562 | 32.99% | ||
| Progreso | 295.251 | 124.537 | 42.18% | 170.714 | 57.82% | ||
| Putlongcam | 415.066 | 415.066 | 100.00% | ||||
| Sudlon | 468.629 | 468.629 | 100.00% | ||||
| Untaga | 763.01 | 29.768 | 3.90% | 733.242 | 96.10% | ||
| Total | 9,128.92 | 20.073 | 0.22% | 1,426.90 | 15.63% | 7,681.94 | 84.15% |