
Download in PDF and JPG format
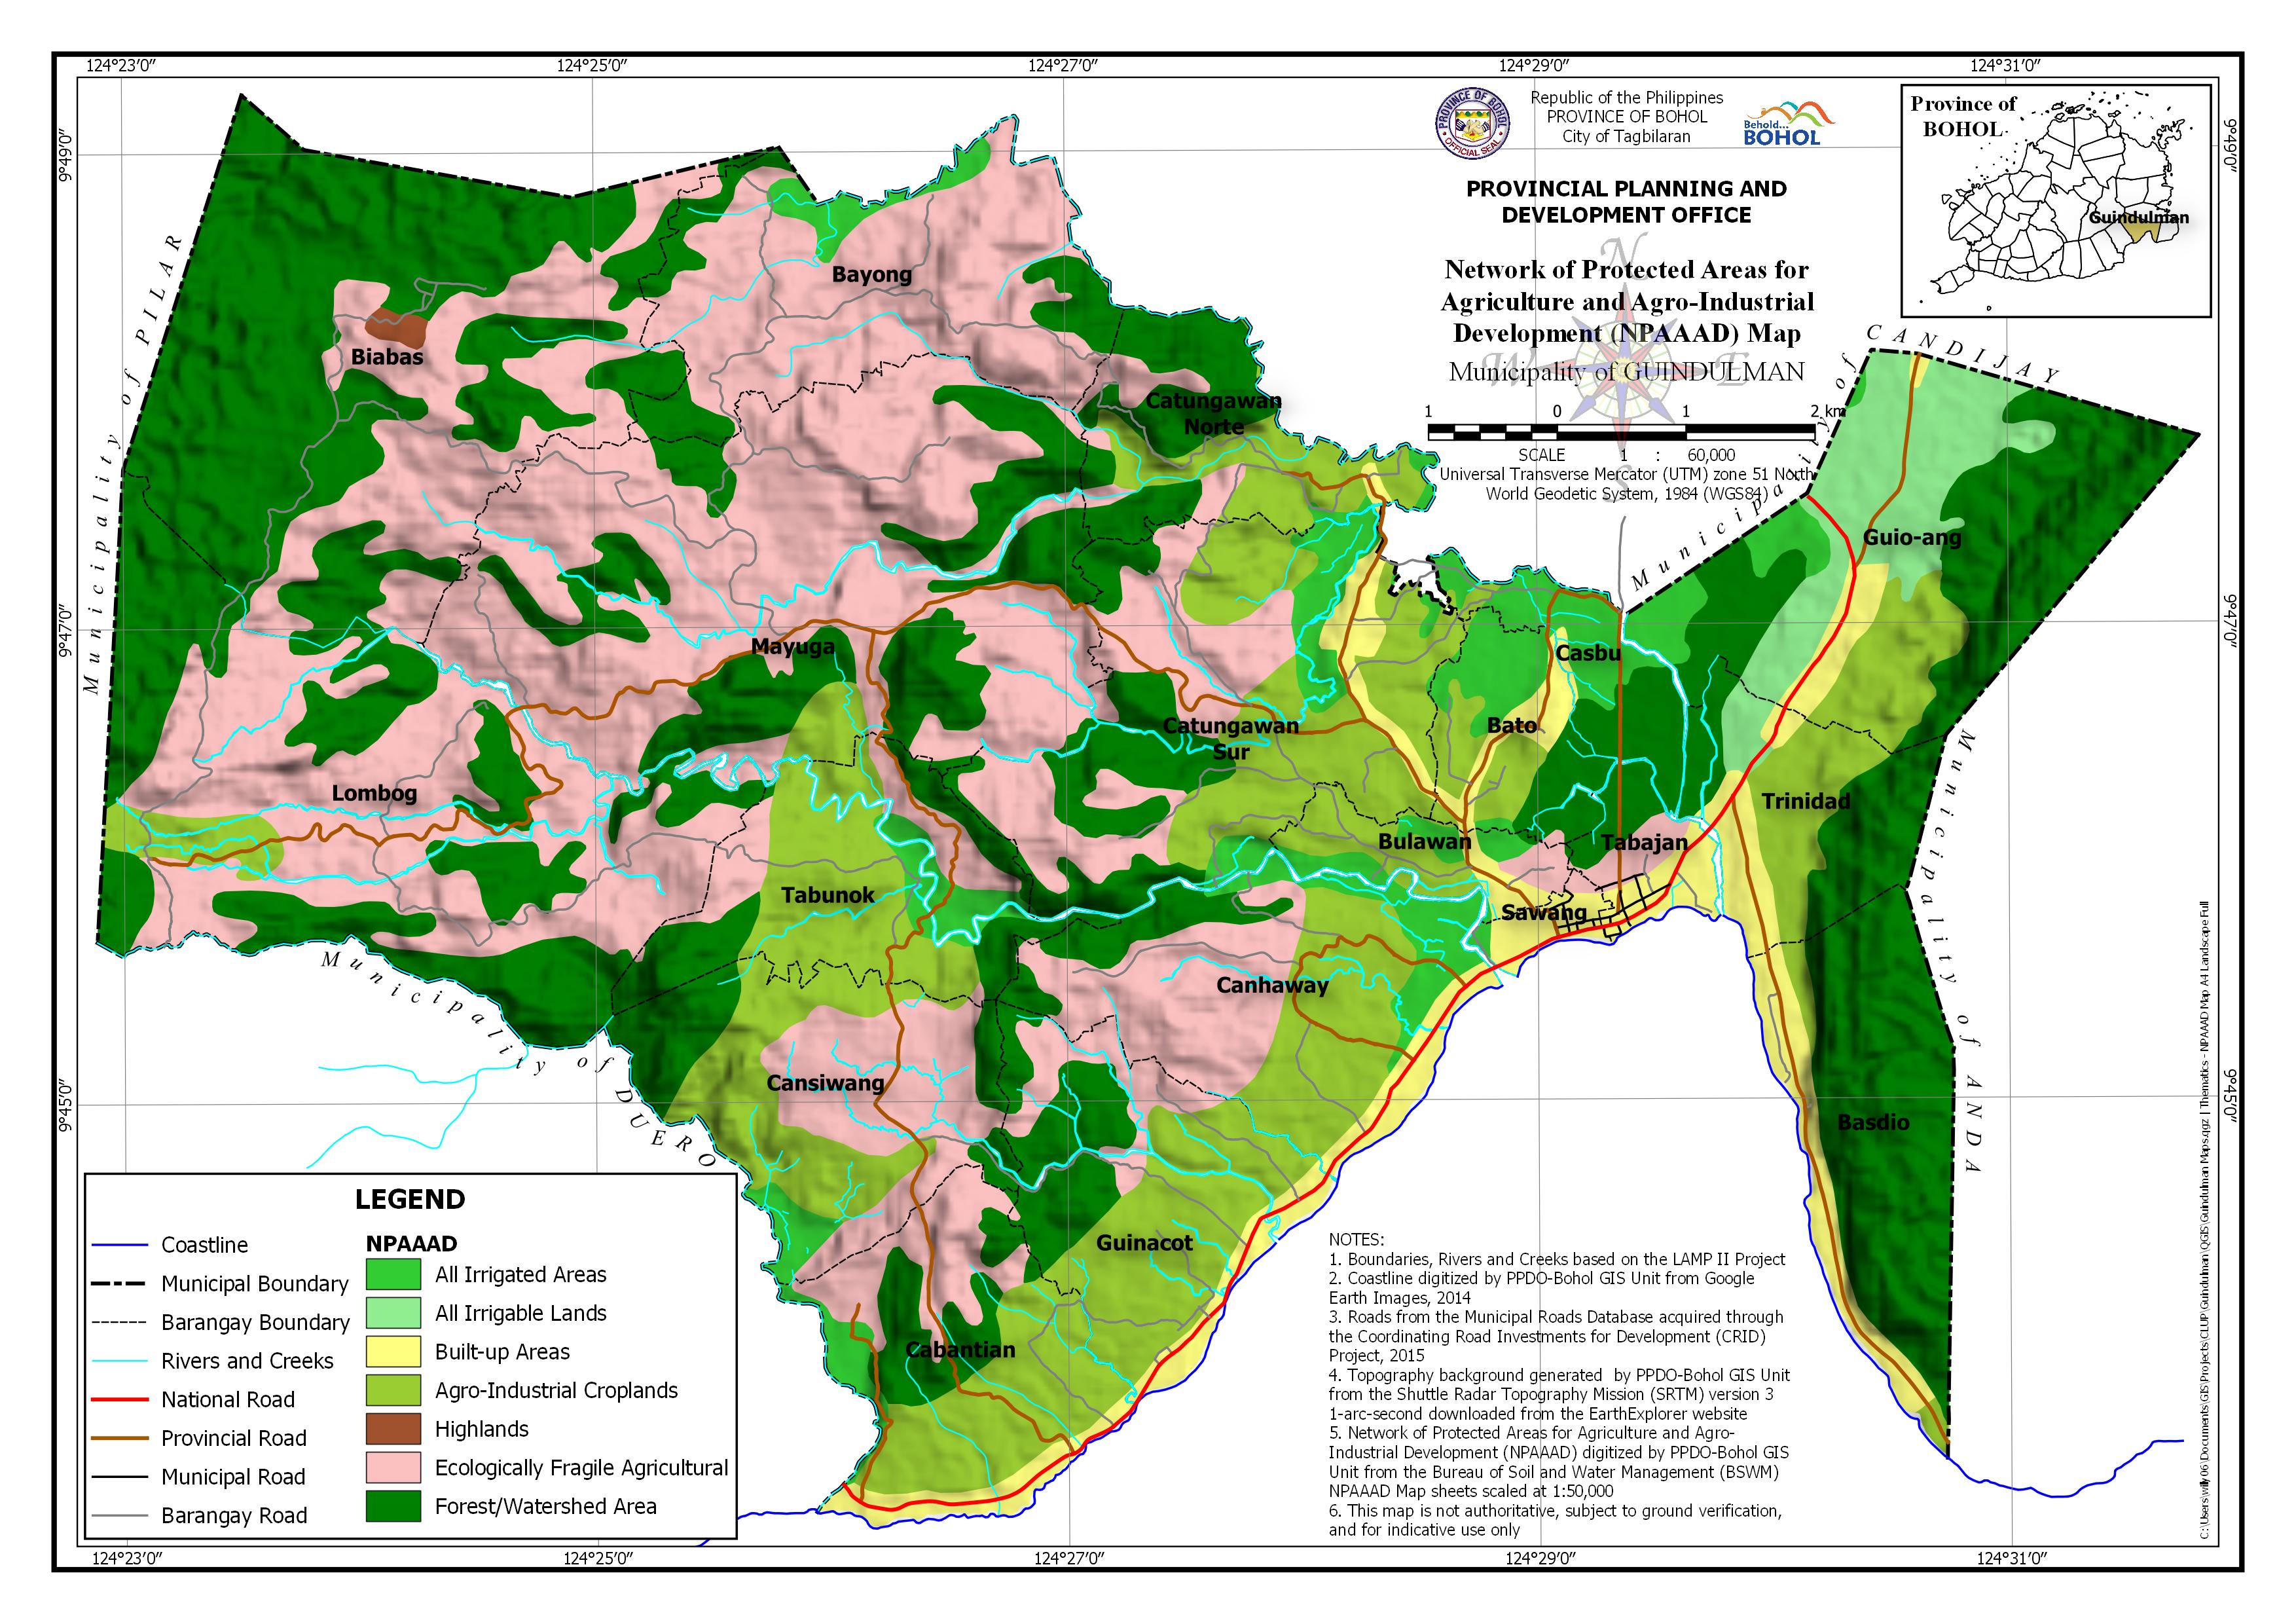
AREAS PER NPAAAD CLASSIFICATION BY BARANGAY
| Barangay | Area | All Irrigated Areas | All Irrigable Lands | Built-up Areas | Agro-Industrial Croplands | Highlands | Ecologically Fragile Agricultural | Forest/Watershed Area | |||||||
| Hectares | Hectares | Percentage | Hectares | Percentage | Hectares | Percentage | Hectares | Percentage | Hectares | Percentage | Hectares | Percentage | Hectares | Percentage | |
| Basdio | 423.159 | 83.804 | 19.80% | 16.857 | 3.98% | 317.496 | 75.03% | ||||||||
| Bato | 180.858 | 54.639 | 30.21% | 34.892 | 19.29% | 49.024 | 27.11% | 1.69 | 0.94% | 40.613 | 22.46% | ||||
| Bayong | 575.094 | 37.21 | 6.47% | 457.273 | 79.51% | 80.611 | 14.02% | ||||||||
| Biabas | 1,151.05 | 11.037 | 0.96% | 353.675 | 30.73% | 786.334 | 68.32% | ||||||||
| Bulawan | 118.372 | 32.86 | 27.76% | 18.433 | 15.57% | 52.117 | 44.03% | 13.644 | 11.53% | 1.317 | 1.11% | ||||
| Cabantian | 438.102 | 25.445 | 5.81% | 49.885 | 11.39% | 174.6 | 39.85% | 101.059 | 23.07% | 82 | 18.72% | ||||
| Canhaway | 527.07 | 63.915 | 12.13% | 45.494 | 8.63% | 171.859 | 32.61% | 187.258 | 35.53% | 56.516 | 10.72% | ||||
| Cansiwang | 485.754 | 24.4 | 5.02% | 168.799 | 34.75% | 202.95 | 41.78% | 89.606 | 18.45% | ||||||
| Casbu | 132.375 | 70.261 | 53.08% | 3.631 | 2.74% | 5.049 | 3.81% | 0.037 | 0.03% | 53.396 | 40.34% | ||||
| Catungawan Norte | 292.09 | 9.052 | 3.10% | 4.67 | 1.60% | 110.231 | 37.74% | 39.257 | 13.44% | 128.881 | 44.12% | ||||
| Catungawan Sur | 751.384 | 72.298 | 9.62% | 43.744 | 5.82% | 266.083 | 35.41% | 214.84 | 28.59% | 154.419 | 20.55% | ||||
| Guinacot | 438.701 | 44.077 | 10.05% | 211.925 | 48.31% | 68.697 | 15.66% | 109.552 | 24.97% | ||||||
| Guio-ang | 716.046 | 52.004 | 7.26% | 227.274 | 31.74% | 40.638 | 5.68% | 87.736 | 12.25% | 308.393 | 43.07% | ||||
| Lombog | 1,119.95 | 50.726 | 4.53% | 590.785 | 52.75% | 478.442 | 42.72% | ||||||||
| Mayuga | 1,266.42 | 30.123 | 2.38% | 909.985 | 71.86% | 326.309 | 25.77% | ||||||||
| Sawang | 40.313 | 3.261 | 8.09% | 32.948 | 81.73% | 3.177 | 7.88% | ||||||||
| Tabajan | 94.106 | 41.072 | 43.64% | 23.752 | 25.24% | 28.826 | 30.63% | ||||||||
| Tabunok | 398.162 | 44.344 | 11.14% | 188.097 | 47.24% | 70.198 | 17.63% | 95.522 | 23.99% | ||||||
| Trinidad | 277.31 | 21.505 | 7.76% | 53.585 | 19.32% | 86.609 | 31.23% | 0.057 | 0.02% | 115.456 | 41.63% | ||||
| TOTAL | 9,426.31 | 489.691 | 5.20% | 248.779 | 2.64% | 496.873 | 5.27% | 1,669.84 | 17.72% | 11.037 | 0.12% | 3,238.33 | 34.35% | 3,253.69 | 34.52% |