
Download in PDF and JPG format
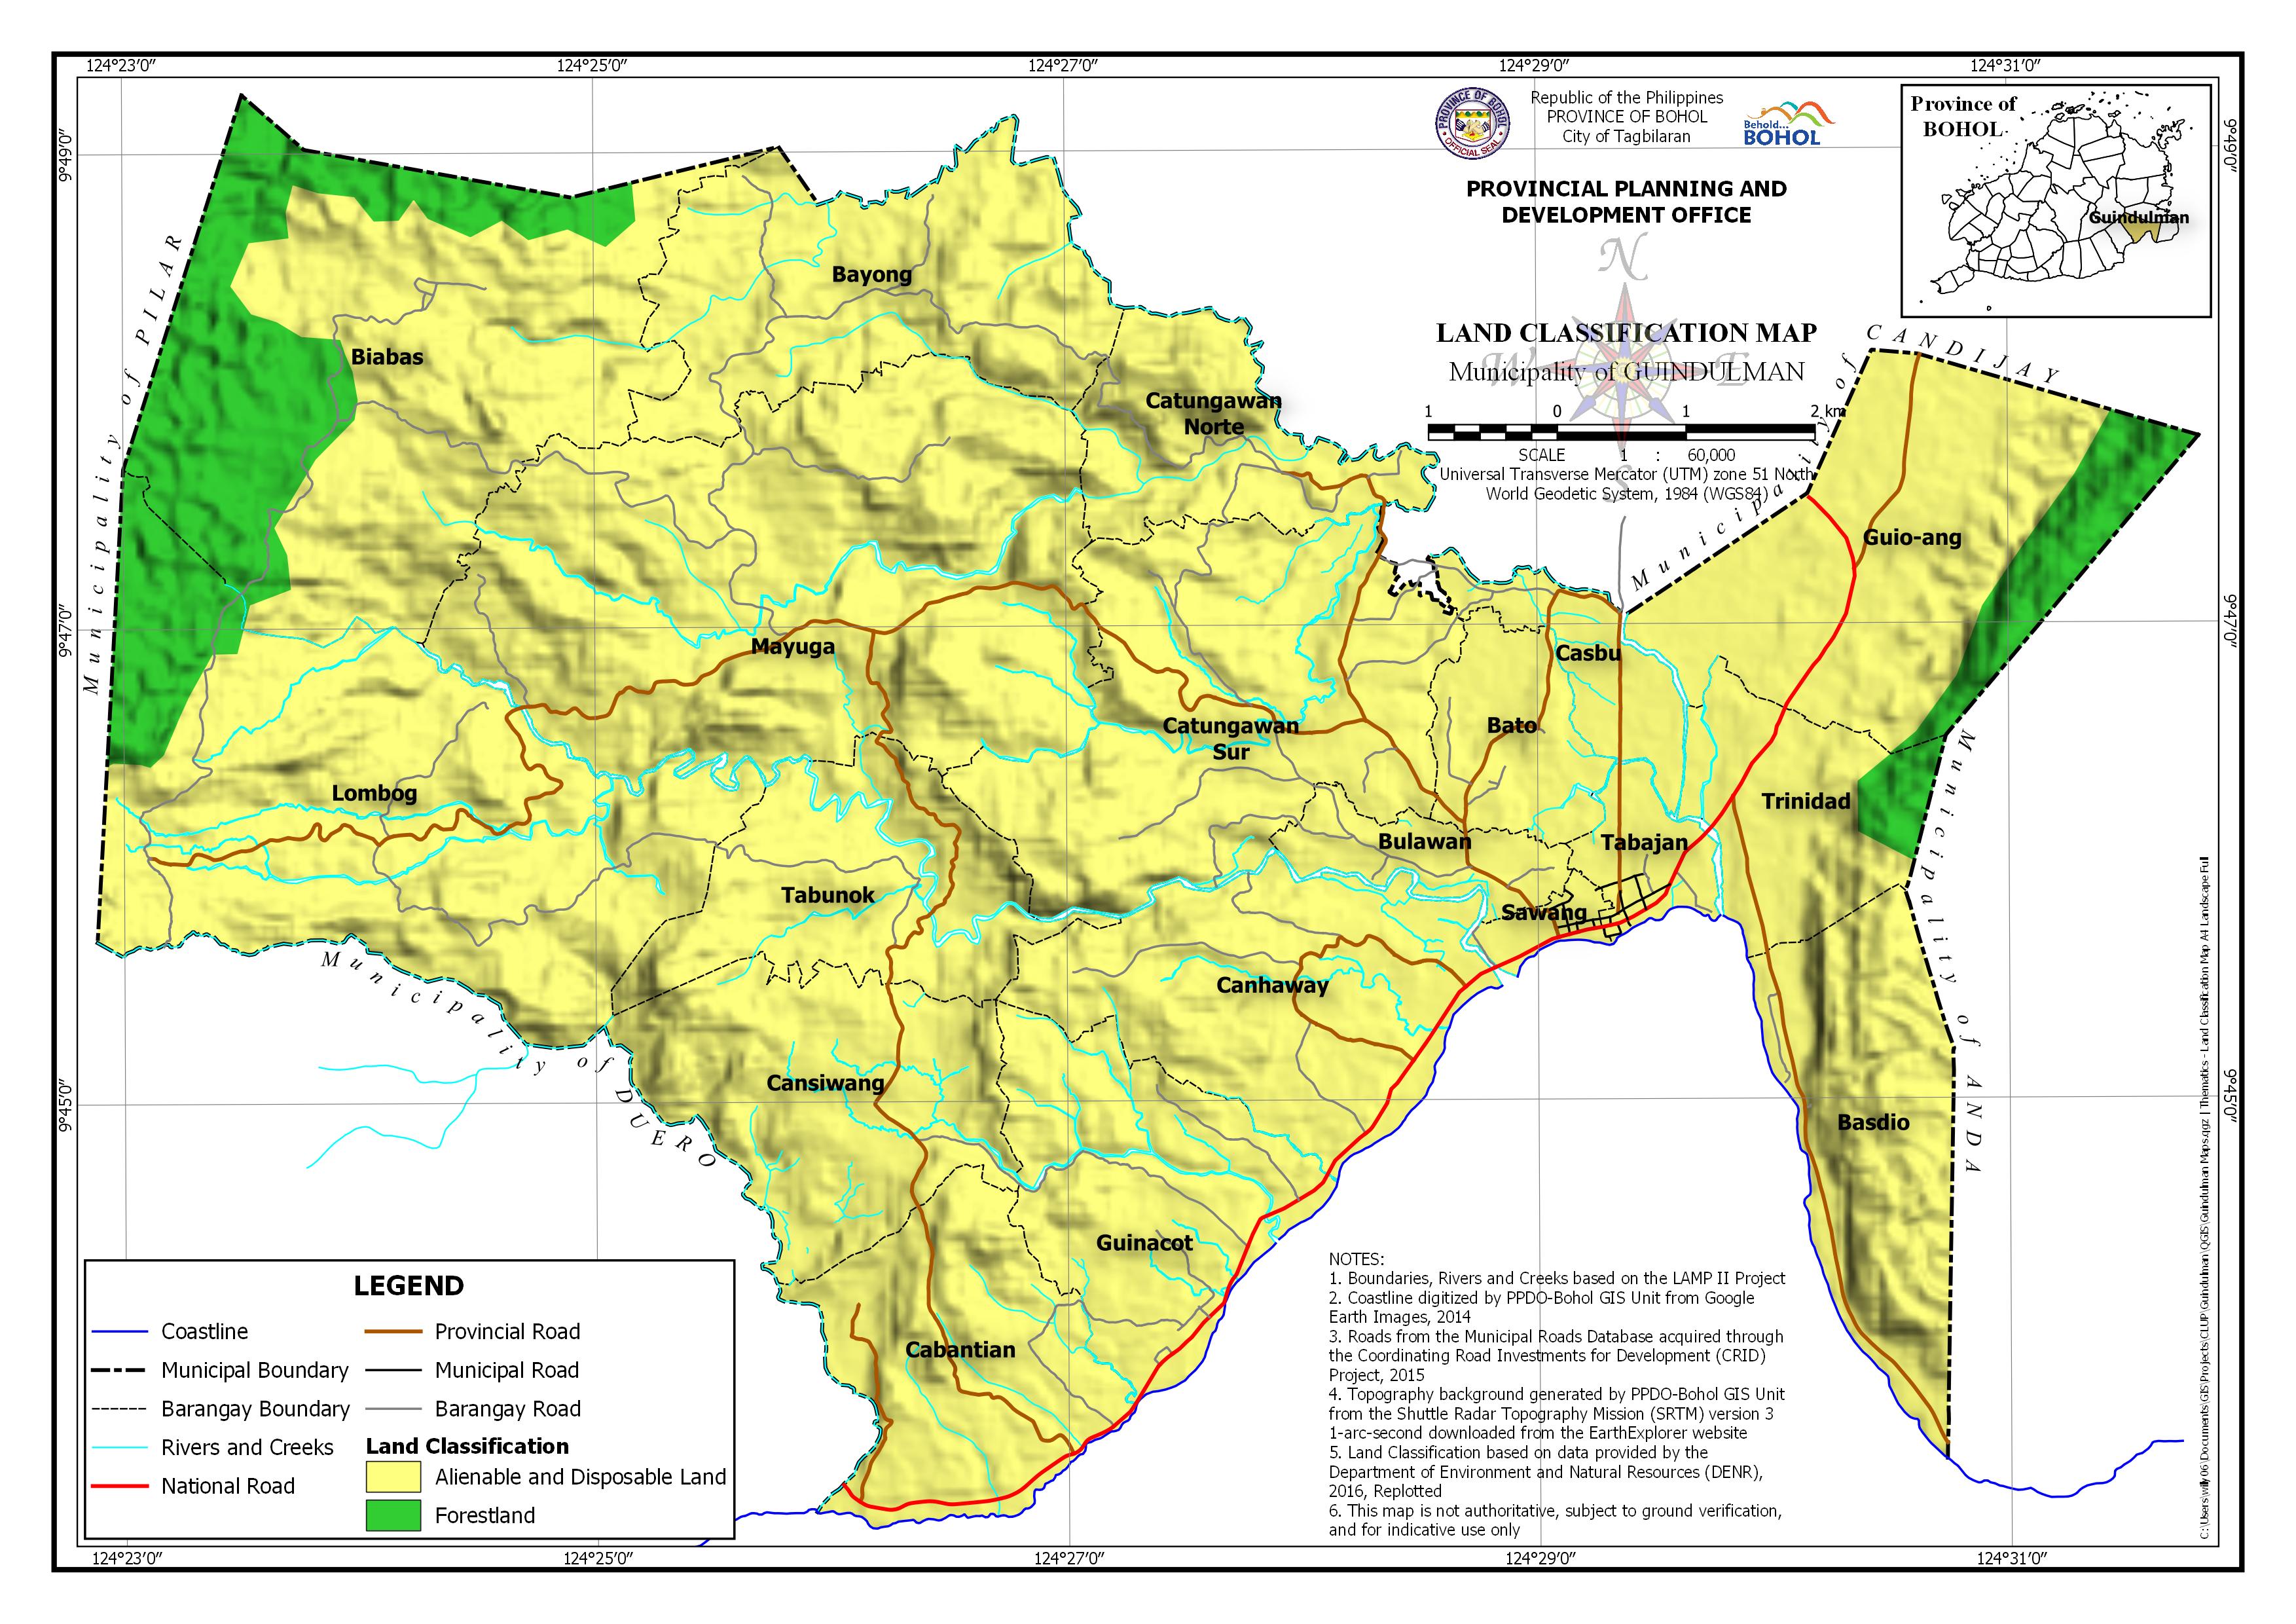
| Barangay | Area | Alienable and Disposable Land | Forestland | ||
| Hectares | Hectares | Percentage | Hectares | Percentage | |
| Basdio | 423.159 | 423.159 | 100.00% | ||
| Bato | 180.858 | 180.858 | 100.00% | ||
| Bayong | 575.094 | 575.094 | 100.00% | ||
| Biabas | 1,151.05 | 713.604 | 62.00% | 437.443 | 38.00% |
| Bulawan | 118.372 | 118.372 | 100.00% | ||
| Cabantian | 438.102 | 438.102 | 100.00% | ||
| Canhaway | 527.07 | 527.07 | 100.00% | ||
| Cansiwang | 485.754 | 485.754 | 100.00% | ||
| Casbu | 132.375 | 132.375 | 100.00% | ||
| Catungawan Norte | 292.09 | 292.09 | 100.00% | ||
| Catungawan Sur | 751.384 | 751.384 | 100.00% | ||
| Guinacot | 438.701 | 438.701 | 100.00% | ||
| Guio-ang | 716.046 | 582.617 | 81.37% | 133.429 | 18.63% |
| Lombog | 1,119.95 | 979.384 | 87.45% | 140.569 | 12.55% |
| Mayuga | 1,266.42 | 1,266.42 | 100.00% | ||
| Sawang | 40.313 | 40.313 | 100.00% | ||
| Tabajan | 94.106 | 94.106 | 100.00% | ||
| Tabunok | 398.162 | 398.162 | 100.00% | ||
| Trinidad | 277.31 | 236.664 | 85.34% | 40.646 | 14.66% |
| TOTAL | 9,426.31 | 8,674.23 | 92.02% | 752.087 | 7.98% |