
Download in PDF and JPG format
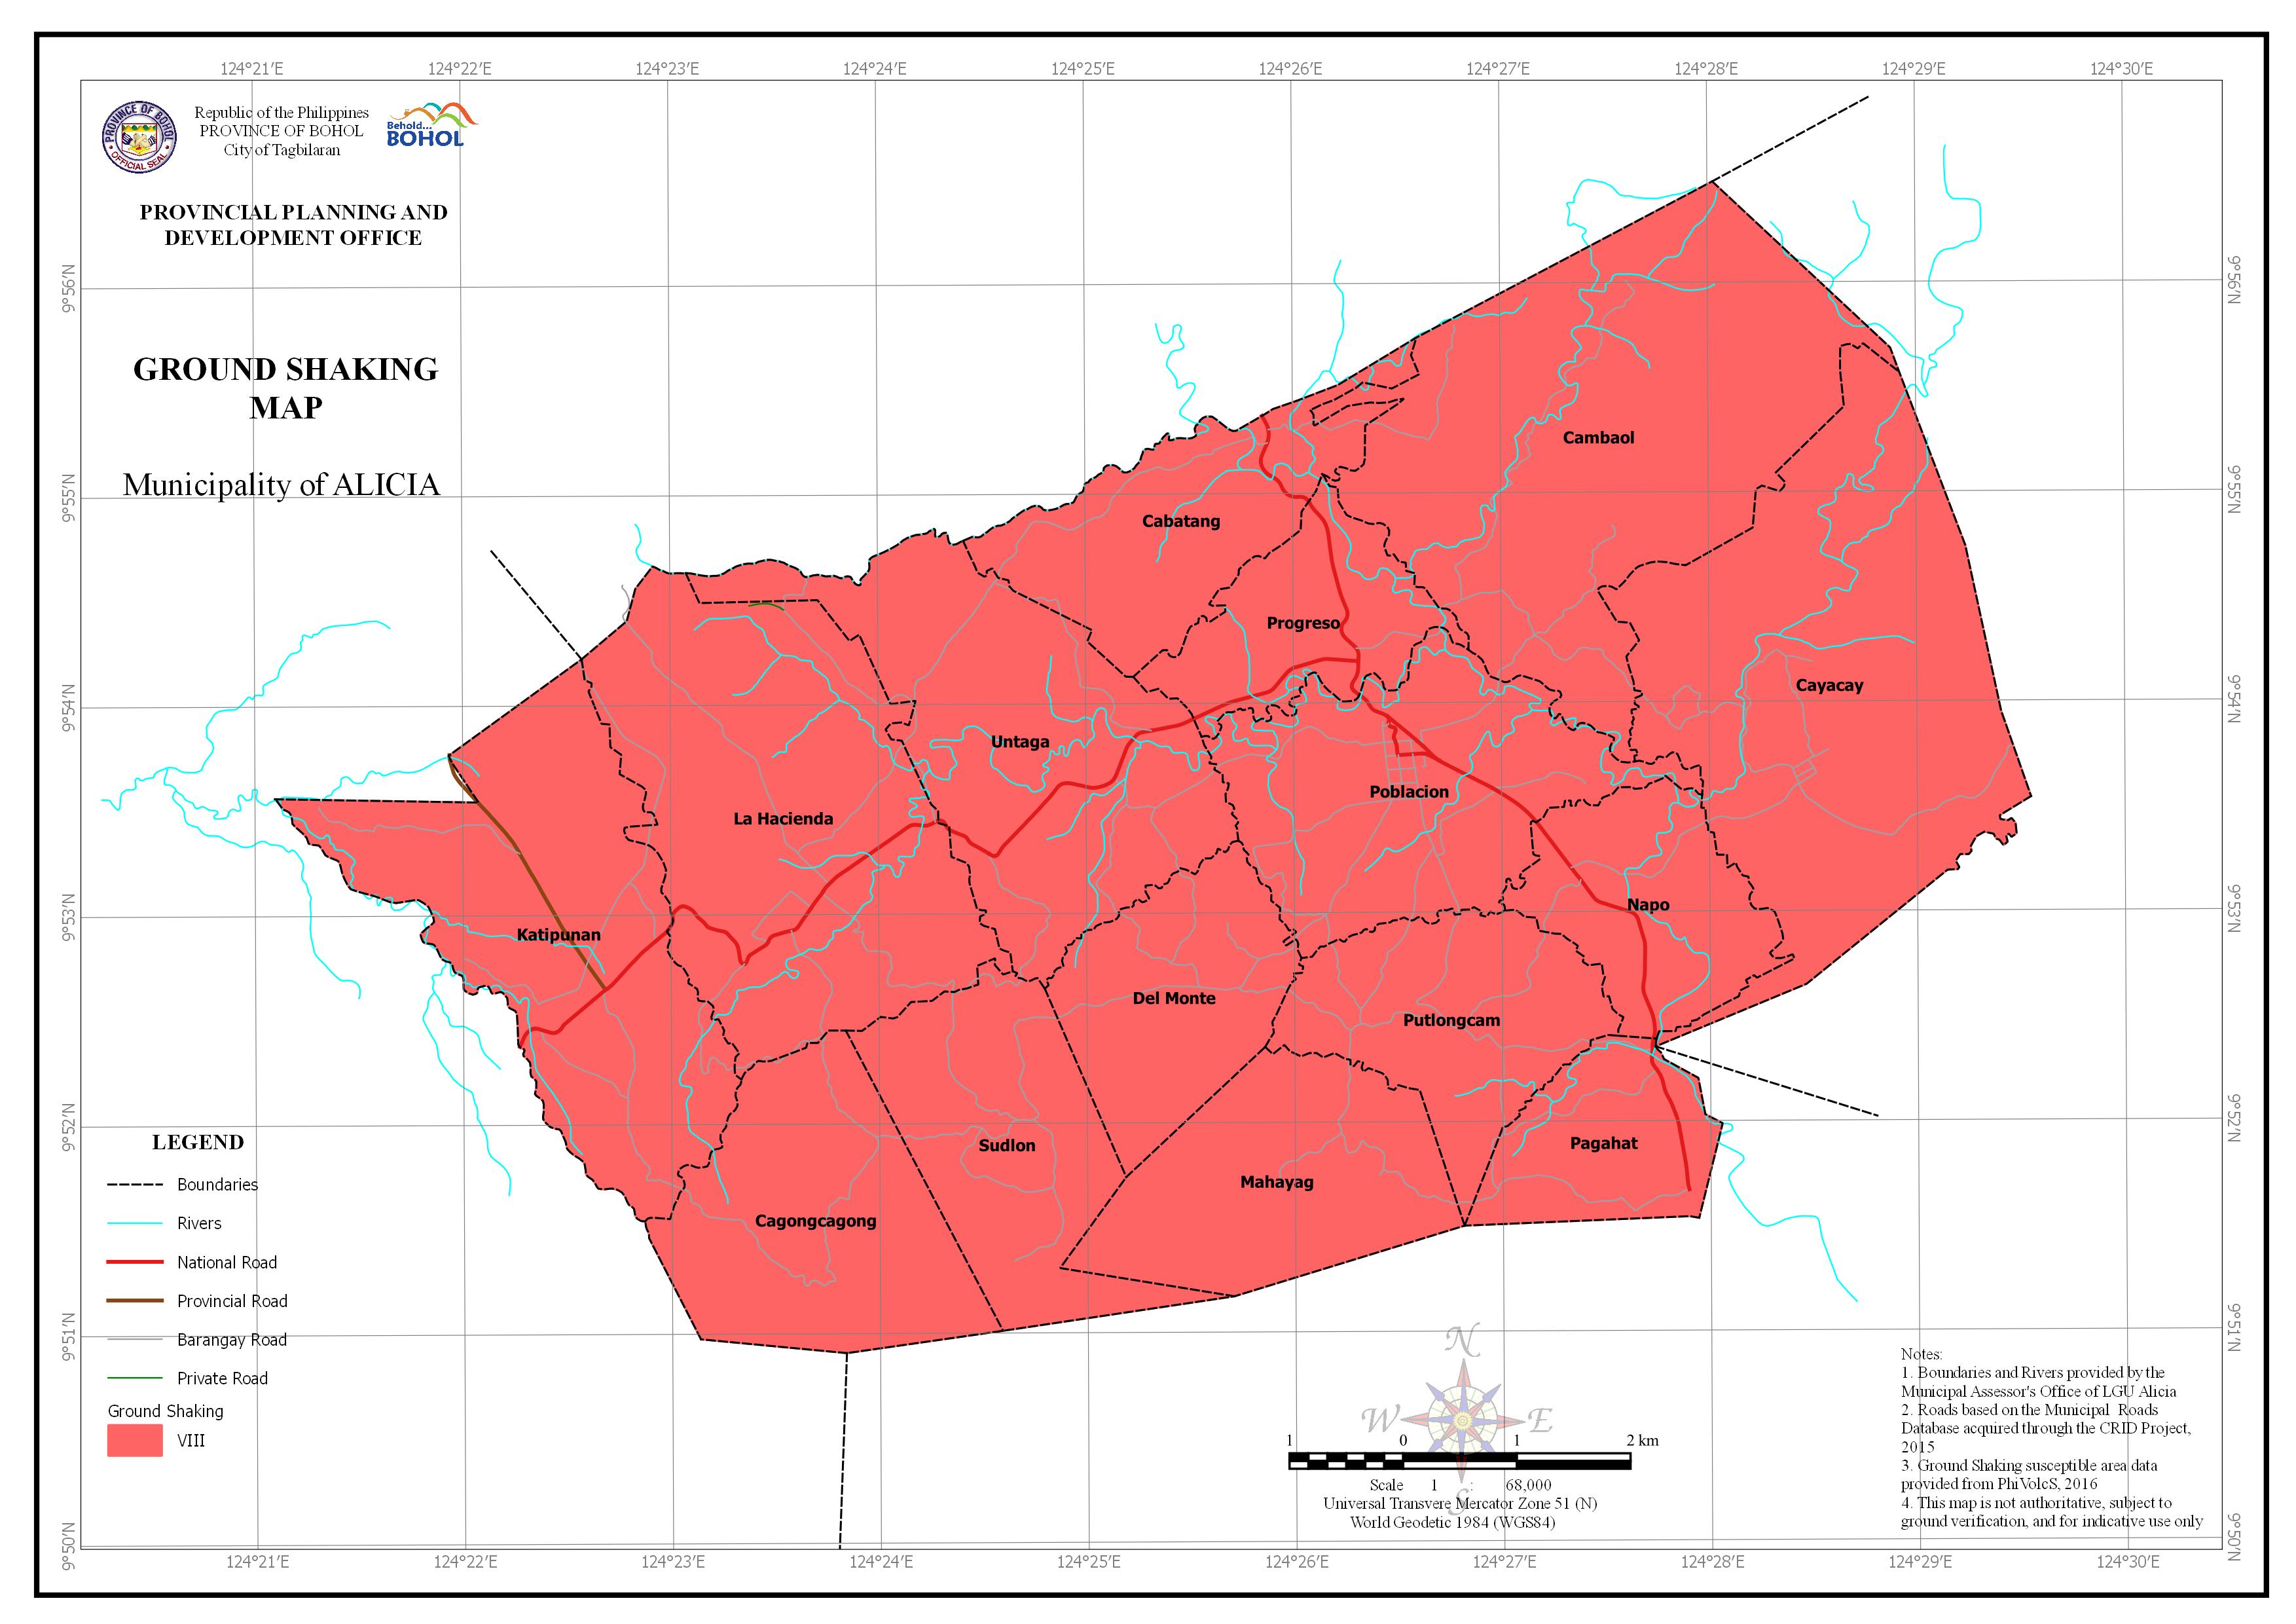
AREA EXPOSED TO GROUND SHAKING BY BARANGAY
| Barangay | Area | Area Exposed to Intensity 8 and Above | |
| (Hectares) | (Hectares) | (Percentage) | |
| Cabatang | 425.212 | 425.212 | 100.00% |
| Cagongcagong | 539.183 | 539.183 | 100.00% |
| Cambaol | 1,212.39 | 1,212.39 | 100.00% |
| Cayacay | 1,146.16 | 1,146.16 | 100.00% |
| Del Monte | 372.367 | 372.367 | 100.00% |
| Katipunan | 823.27 | 823.27 | 100.00% |
| La Hacienda | 967.4 | 967.4 | 100.00% |
| Mahayag | 479.164 | 479.164 | 100.00% |
| Napo | 335.262 | 335.262 | 100.00% |
| Pagahat | 260.509 | 260.509 | 100.00% |
| Poblacion | 626.04 | 626.04 | 100.00% |
| Progreso | 295.251 | 295.251 | 100.00% |
| Putlongcam | 415.066 | 415.066 | 100.00% |
| Sudlon | 468.629 | 468.629 | 100.00% |
| Untaga | 763.01 | 763.01 | 100.00% |
| Total | 9,128.92 | 9,128.92 | 100.00% |