
Download in PDF and JPG format
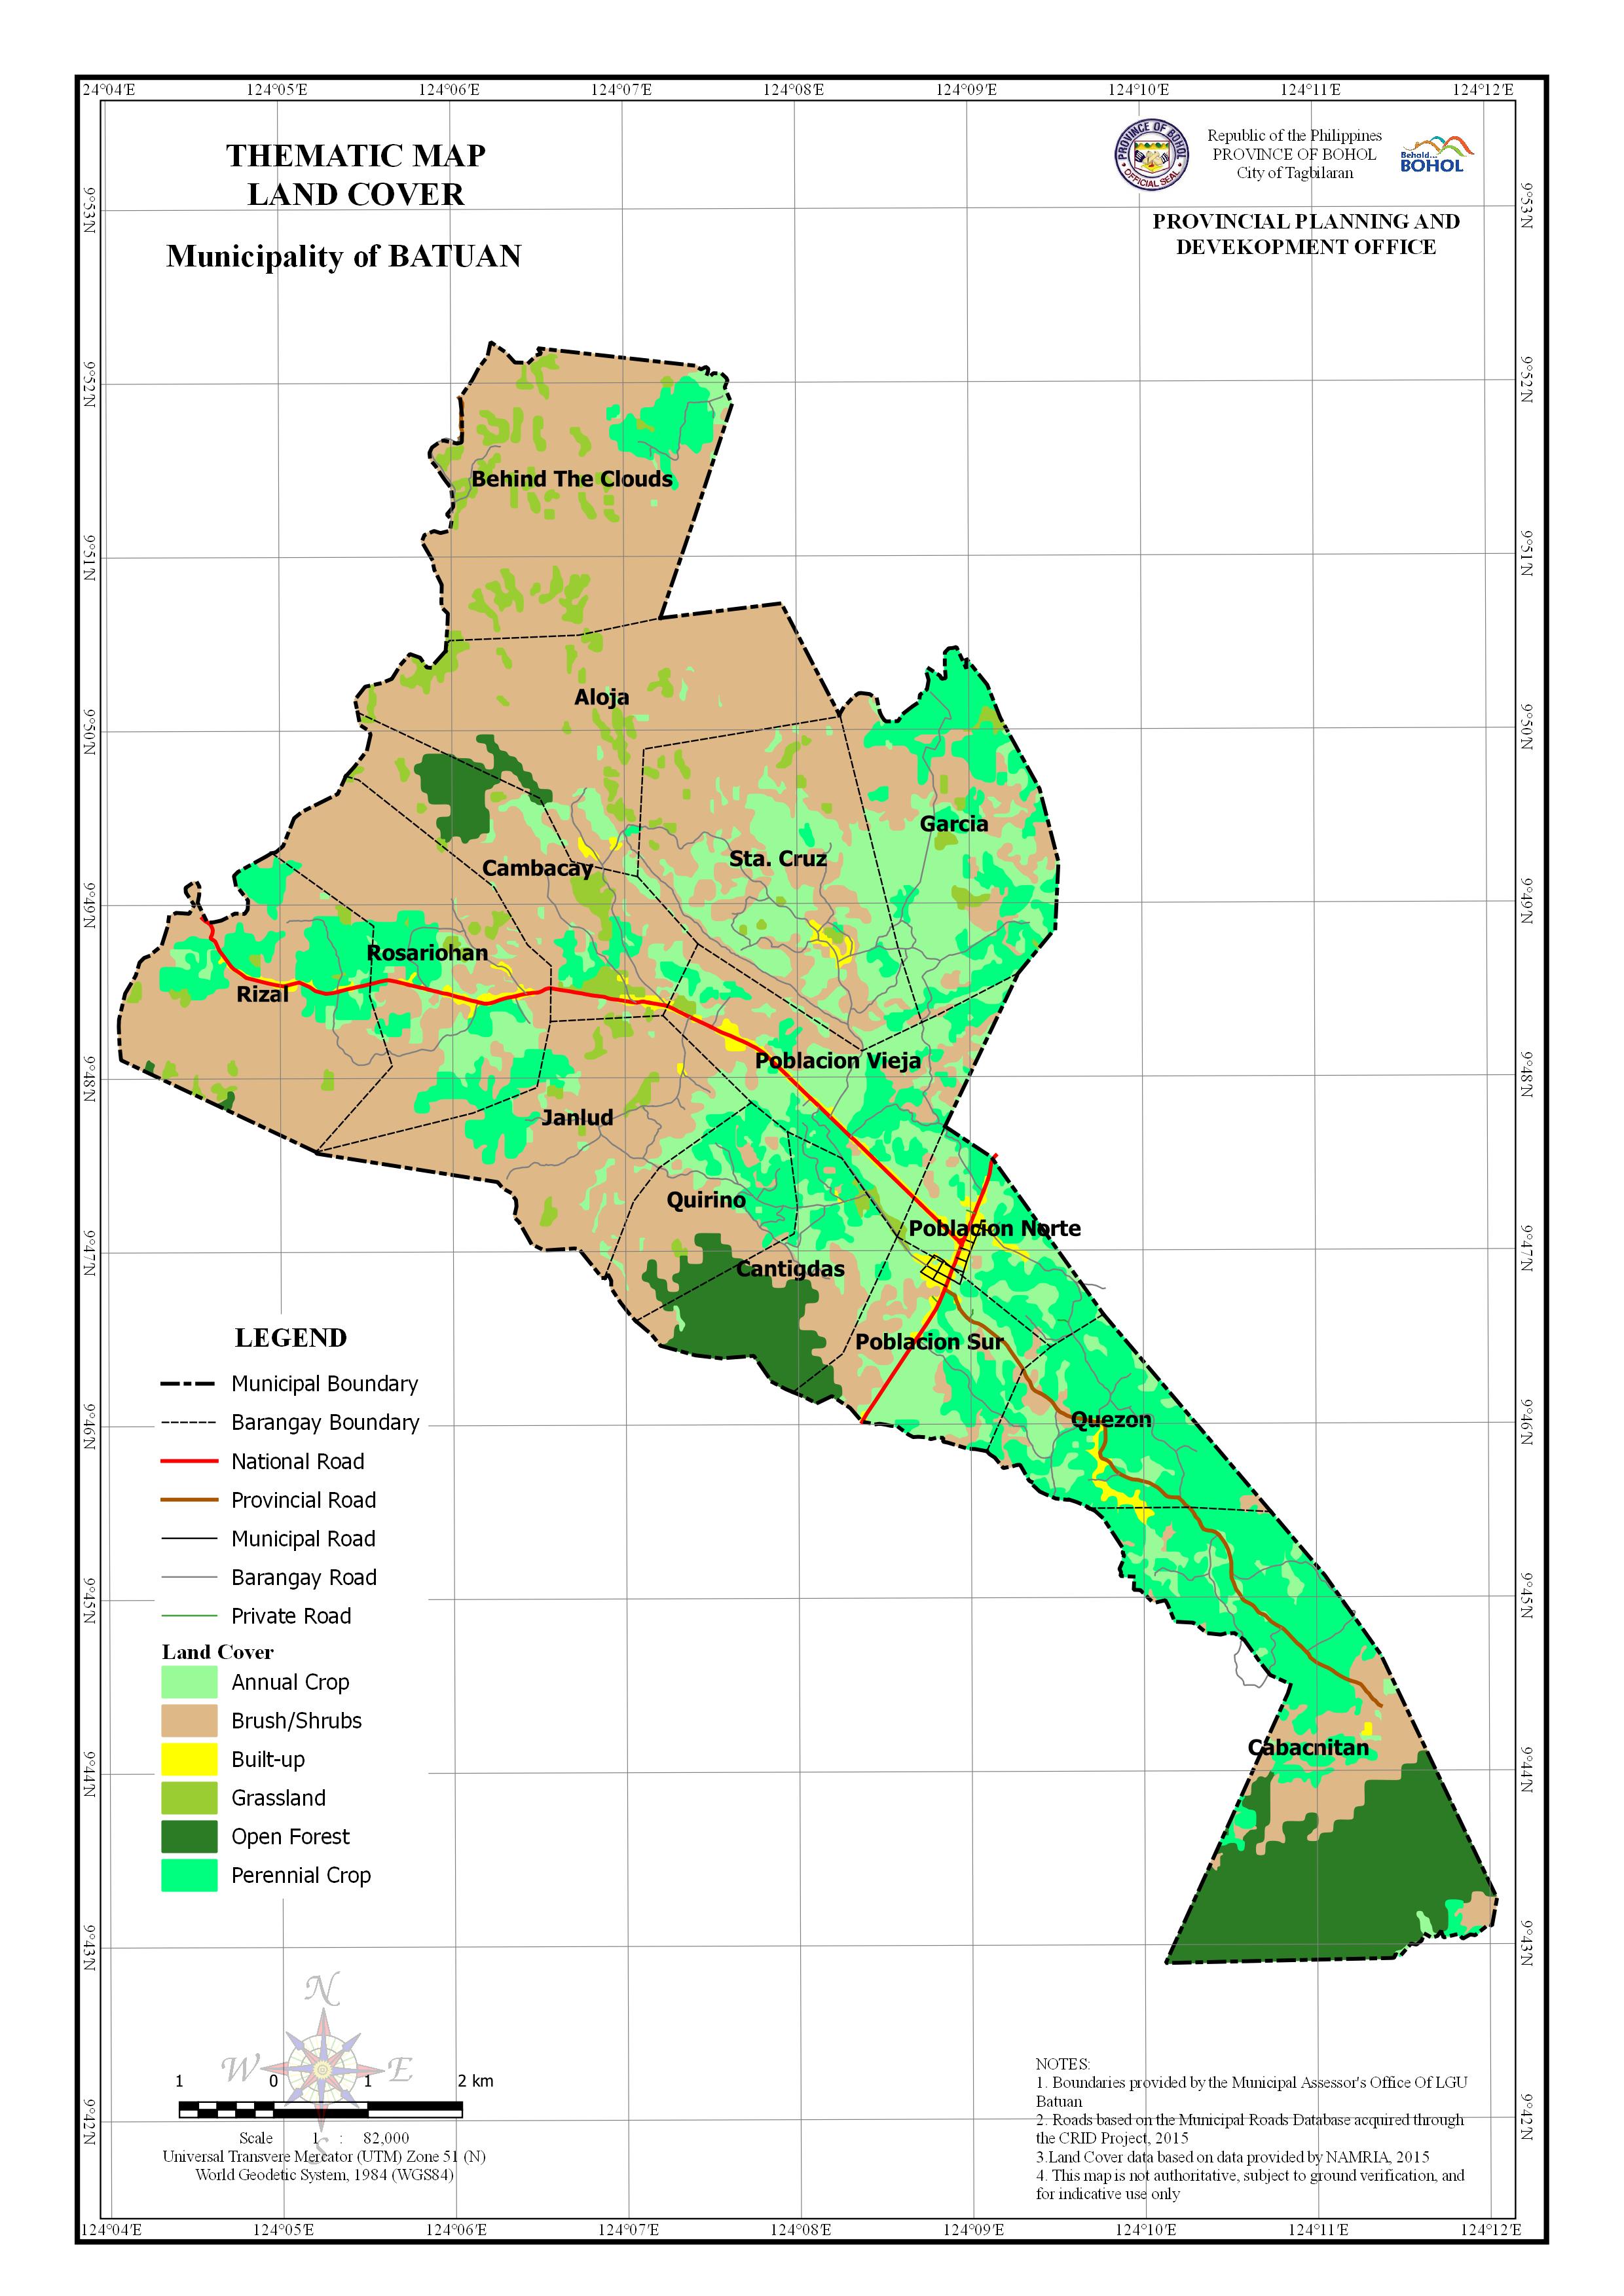
AREA PER LAND COVER BY BARANGAY
| Barangay | Area | Annual Crop | Brush/Shrubs | Built-Up | Grassland | Open Forest | Perennial Crop | ||||||
| (Hectares) | (Hectares) | Percentage | (Hectares) | Percentage | (Hectares) | Percentage | (Hectares) | Percentage | (Hectares) | Percentage | (Hectares) | Percentage | |
| Aloja | 703.38 | 30.994 | 4.406% | 613.384 | 87.205% | 2.633 | 0.374% | 41.426 | 5.890% | 14 | 1.990% | 0.939 | 0.134% |
| Behind The Clouds | 777.08 | 16.538 | 2.128% | 628.091 | 80.827% | 74.942 | 9.644% | 57.508 | 7.401% | ||||
| Cabacnitan | 1009.193 | 62.192 | 6.163% | 188.689 | 18.697% | 3.783 | 0.375% | 440.927 | 43.691% | 313.612 | 31.076% | ||
| Cambacay | 434.135 | 50.155 | 11.553% | 266.914 | 61.482% | 6.499 | 1.497% | 36.609 | 8.433% | 49.233 | 11.340% | 24.726 | 5.695% |
| Cantigdas | 326.134 | 66.18 | 20.292% | 78.067 | 23.937% | 0.892 | 0.273% | 4.35 | 1.334% | 133.72 | 41.002% | 42.927 | 13.162% |
| Garcia | 565.007 | 231.639 | 40.997% | 148.968 | 26.366% | 16.249 | 2.876% | 168.15 | 29.761% | ||||
| Janlud | 506.905 | 56.868 | 11.219% | 396.052 | 78.131% | 0.705 | 0.139% | 16.69 | 3.293% | 36.591 | 7.219% | ||
| Poblacion Norte | 224.341 | 115.084 | 51.299% | 5.427 | 2.419% | 21.281 | 9.486% | 0.886 | 0.395% | 81.664 | 36.402% | ||
| Poblacion Sur | 317.725 | 162.901 | 51.271% | 66.988 | 21.084% | 13.83 | 4.353% | 0.606 | 0.191% | 10.621 | 3.343% | 62.78 | 19.759% |
| Poblacion Vieja | 447.363 | 197.139 | 44.067% | 127.065 | 28.403% | 19.539 | 4.368% | 6.969 | 1.558% | 96.65 | 21.604% | ||
| Quezon | 344.134 | 67.249 | 19.541% | 25.416 | 7.386% | 15.064 | 4.377% | 236.41 | 68.697% | ||||
| Quirino | 269.747 | 42.543 | 15.771% | 137.156 | 50.846% | 1.697 | 0.629% | 27.519 | 10.202% | 60.832 | 22.551% | ||
| Rizal | 583.21 | 21.191 | 3.633% | 411.968 | 70.638% | 9.358 | 1.605% | 17.265 | 2.960% | 2.306 | 0.395% | 121.121 | 20.768% |
| Rosariohan | 588.702 | 90.8 | 15.424% | 387.329 | 65.794% | 11.918 | 2.024% | 8.99 | 1.527% | 89.666 | 15.231% | ||
| Sta. Cruz | 676.062 | 292.789 | 43.308% | 349.924 | 51.759% | 6.621 | 0.979% | 15.097 | 2.233% | 11.632 | 1.721% | ||
| Total | 7773.119 | 1504.259 | 19.352% | 3831.438 | 49.291% | 112.122 | 1.442% | 241.775 | 3.110% | 678.326 | 8.727% | 1405.209 | 18.078% |