
Download in PDF and JPG format
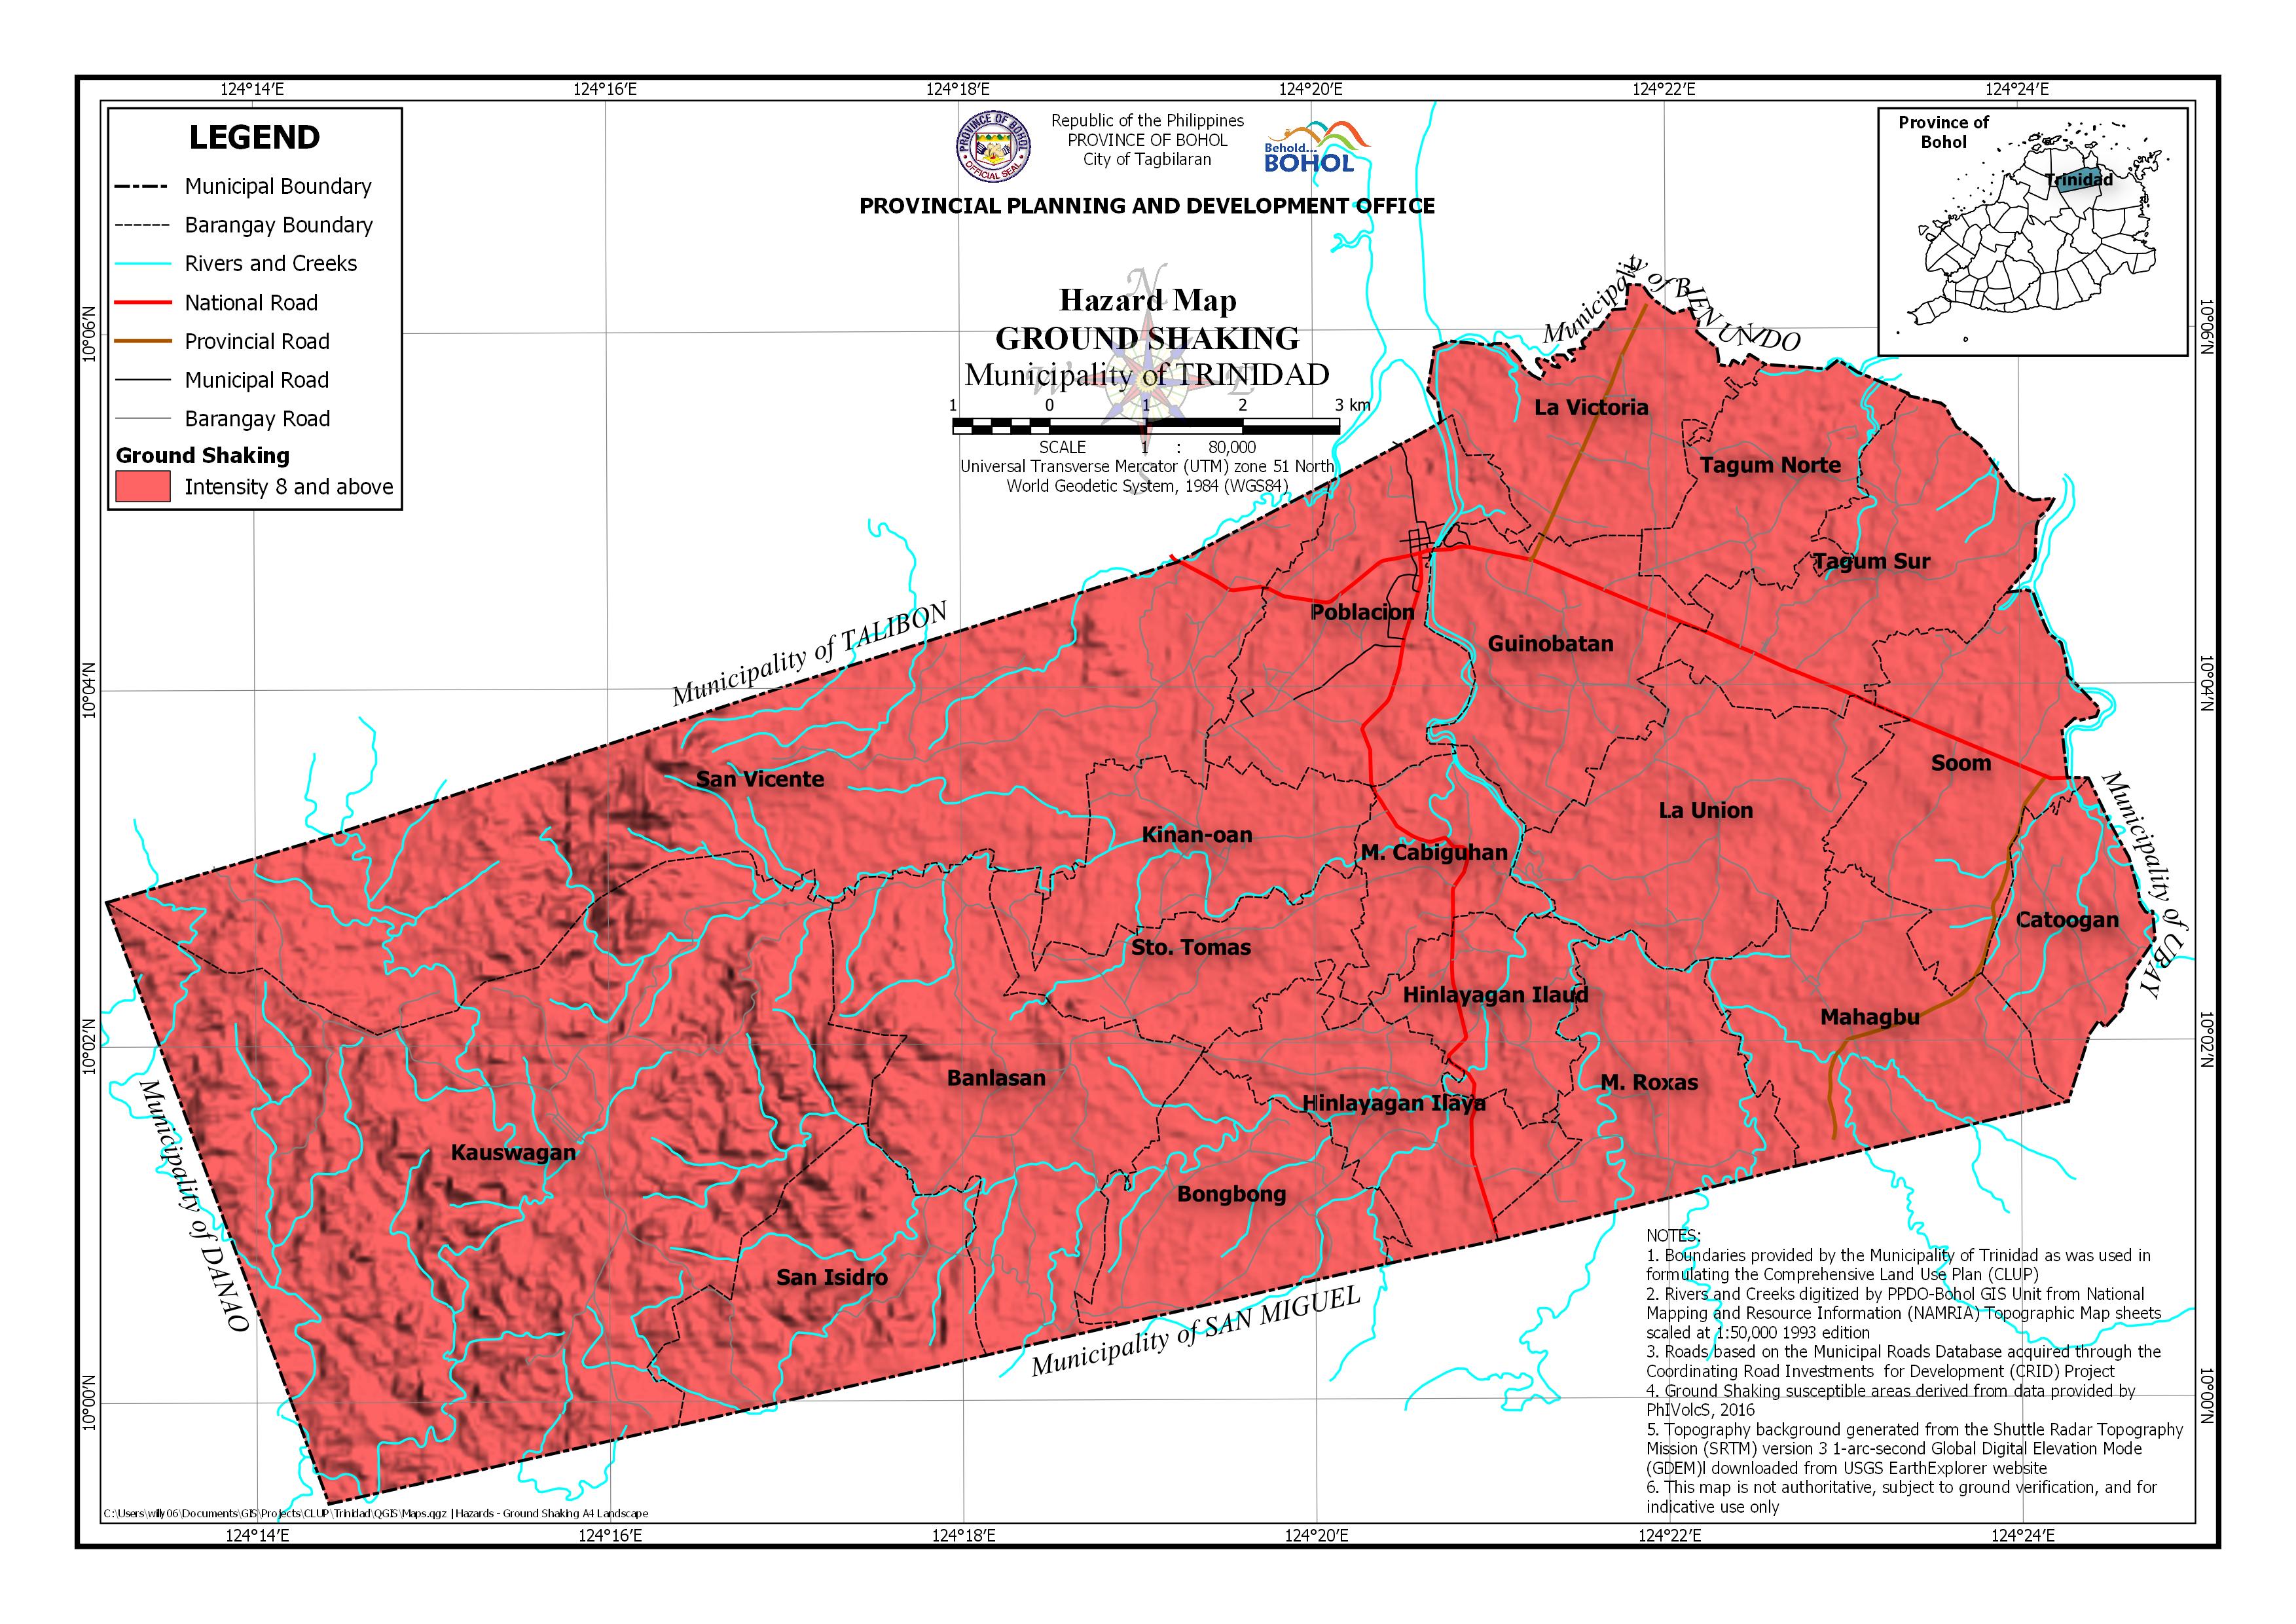
AREA EXPOSED TO GROUND SHAKING HAZARD BY BARANGAY
| Barangay | Area | Barangay Area Exposed to Intensity 8 and above | |
| (Hectares) | (Hectares) | (Percentage) | |
| Banlasan | 988.739 | 988.739 | 100.00% |
| Bongbong | 540.748 | 540.748 | 100.00% |
| Catoogan | 335.1 | 335.1 | 100.00% |
| Guinobatan | 563.906 | 563.906 | 100.00% |
| Hinlayagan Ilaud | 306.645 | 306.645 | 100.00% |
| Hinlayagan Ilaya | 486.672 | 486.672 | 100.00% |
| Kauswagan | 3,091.78 | 3,091.78 | 100.00% |
| Kinan-oan | 439.893 | 439.893 | 100.00% |
| La Union | 724.351 | 724.351 | 100.00% |
| La Victoria | 516.037 | 516.037 | 100.00% |
| M. Cabiguhan | 306.975 | 306.975 | 100.00% |
| M. Roxas | 512.497 | 512.497 | 100.00% |
| Mahagbu | 627.355 | 627.355 | 100.00% |
| Poblacion | 671.786 | 671.786 | 100.00% |
| San Isidro | 620.653 | 620.653 | 100.00% |
| San Vicente | 2,233.06 | 2,233.06 | 100.00% |
| Soom | 616.046 | 616.046 | 100.00% |
| Sto. Tomas | 401.716 | 401.716 | 100.00% |
| Tagum Norte | 392.375 | 392.375 | 100.00% |
| Tagum Sur | 613.829 | 613.829 | 100.00% |
| Total | 14,990.16 | 14,990.16 | 100.00% |